. 2025 Feb 10;10(3):e184379.
doi: 10.1172/jci.insight.184379.

Mapping cell diversity and dynamics in inflammatory temporomandibular joint osteoarthritis with pain at single-cell resolution

Affiliations

Mapping cell diversity and dynamics in inflammatory temporomandibular joint osteoarthritis with pain at single-cell resolution

Supawadee Jariyasakulroj et al. JCI Insight. .

Abstract

Temporomandibular joint (TMJ) osteoarthritis with pain is a highly prevalent disorder affecting patients' quality of life. A comprehensive understanding of cell type diversity and its dynamics in painful TMJ osteoarthritis (TMJOA) is lacking. Here, we utilized an inflammatory TMJOA mouse model via intra-articular injection of CFA. TMJOA mice exhibited cartilage remodeling, bone loss, synovitis, increased osteoarthritis (OA) score, and orofacial pain, recapitulating hallmark symptoms in patients. Single-cell transcriptomic profiling of the TMJ was performed in conjunction with mouse genetic labeling, tissue clearing, light sheet and confocal 3D imaging, multiplex RNAscope, and immunodetection. We visualized, reconstructed, and analyzed the distribution and density of nociceptive innervation of TMJ at single-axon levels. We systematically mapped the heterogeneity and anatomical position of blood endothelial cells, synovial fibroblasts, and immune cells, including Cx3cr1-positive barrier macrophages. Importantly, TMJOA mice exhibited enhanced neurovascular coupling, sublining fibroblast hyperplasia, inflammatory immune cell expansion, disrupted signaling-dependent cell-cell interaction, and a breakdown of the sandwich-like organization consisting of synovial barrier macrophages and fibroblasts. By utilizing a mouse model with combined TMJ pain history and OA, we reveal the cellular diversity, anatomical structure, and cell dynamics of the TMJ at single-cell resolution, which facilitate our understanding and potential targeting of TMJOA.

Keywords: Behavior; Bioinformatics; Cell biology; Inflammation; Osteoarthritis.


Figures
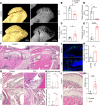
Figure 1
Figure 1. TMJ OA-like defects in CFA intra-articular injection mice.
(A) Micro-CT of live images of a sagittal view of the mandibular condyle. Scale bar: 500 μm. (BE) Quantification analysis of microarchitecture parameters of the subchondral bone. Values represent mean ± SD, *P < 0.05, **P < 0.01, ****P < 0.0001 (n = 4 control mice, n = 6 CFA-injected mice). BV/TV, bone volume/total volume; 1/mm, 1 trabecular number per mm region. (F) H&E staining of sagittal TMJ sections. Black dashed boxes indicate the anterior and posterior synovial tissue around the condyle. Scale bar: 500 μm. (G) TMJ synovitis tissue histopathology from boxed regions in F. The TMJ of CFA-injected mice presented features of OA-like defects, including hyperplastic epithelial lining (black arrows in anterior area) and immune cellular infiltration caused by inflammation (black arrows in posterior area). Scale bar: 100 μm. (H and I) Quantification of TMJ synovitis evaluated by Synovitis Scoring System with 2 assessment criteria: synovial hyperplasia (H) and inflammatory infiltrate (I). Values represent mean ± SD. *P < 0.05 (n = 12 sections from 3 control mice, n = 18 sections from 4 CFA-injected mice). (J) Immunofluorescence staining of Cathepsin K (green) in mandibular condyles. Scale bar: 100 μm. (K) Quantification of Cathepsin K+ osteoclast cells in subchondral bone of the TMJ condylar head. Values represent mean ± SD calculated by Student’s t test. n ≥ 3 mice, *P < 0.05. (L) H&E staining of sagittal TMJ condylar cartilage part from sections in F. Arrowheads indicate uneven surface and loss of fibrous layer in the CFA group. Note the unclear borders between cartilage and subchondral bone, uneven cartilage surfaces, and decreased hypertrophic layer thickness in the CFA group. Scale bar: 100 μm. (M) Quantification of Osteoarthritis Research Society International (OARSI) score in TMJs. Data are represented as mean ± SEM calculated by Student’s t test. n ≥ 3 mice, ***P < 0.001.
Figure 2
Figure 2. Painful behaviors and neuroimmune response in CFA intra-articular injection mice.
(A) Diagram of von Frey filament test. (B) Diagram of bite force measurement. (C) Quantification of head withdrawal threshold measurement at different time points after CFA injection. N = 7 mice (control), n = 10 mice (CFA). (D) Quantification of relative bite force values at different time points. N = 7 mice (control), n = 10 mice (CFA). (E) Confocal imaging of tdTomato TG section after retrograde tracer Fast Blue in the TMJ. V1, V2, V3 represent ophthalmic nerve (V1), maxillary nerve (V2), and mandibular nerve (V3). Original magnification, 4× for original image; 20× for zoomed-in image. (F) Immunofluorescence staining of CGRP (green) and Iba1 (red) in V3 section of TG. Scale bar 100 μm. (G and H) Quantification of the percentage of CGRP+ neurons and the percentage of Iba1+ area fraction in the V3 of TG. N = 3 mice. (I) Immunofluorescence staining of spinal trigeminal nucleus caudalis (SpVC) using antibodies against microglia marker Iba1 (red) and microglial activation marker CD68 (green). Scale bars: 100 μm. (J) Quantification of the total length of processes per microglia. N ≥ 3 mice. (K) Quantification of Iba1+ cells in SpVC area. N = 3. (L) Quantification of the number of primary processes per microglia. N ≥ 3 mice. All data are represented as mean ± SEM calculated by Student’s t test. n ≥ 3 mice, *P < 0.05, **P < 0.01, ***P < 0.001, ****P < 0.0001. TG, trigeminal ganglion; CGRP, calcitonin gene-related peptide; Iba1, ionized calcium-binding adapter molecule 1.
Figure 3
Figure 3. Anatomical distribution of TMJ innervation and increased sensory innervation in CFA mice.
(A) Confocal imaging of the sagittal section (Z-stack of 100 μm) of TMJ from Nav1.8-Cre Ai14 mice. Scale bar: 200 μm. (A-1) Enlarged image represents the Ruffini-like encapsulated ending in the anterior synovial tissue region. Scale bar: 10 μm. (B) Enlarged imaging of the posterior region of TMJ section containing extensive innervation in subchondral bone, posterior part of the articular disc, retrodiscal tissue, and synovial tissues. (A-2 and C) Pacinian corpuscle-like structure found in the anterior part of the TMJ capsule. Scale bar: 20 μm. (D) Innervation of TMJ RDT enriched with fat pad (yellow arrowhead). Scale bar: 20 μm. (E) Nerve plexus containing free nerve endings is found in the posterior part of the TMJ capsule. Scale bar: 30 μm. (F) Immunofluorescence staining of the superior part of sagittal TMJ sections with antibodies against CGRP (green) and TUBB3 (red). DAPI stains nuclei (blue). Scale bar: 100 μm. (G) Quantification of CGRP+TUBB3+ area fraction surrounding TMJ. N = 5. (H) Schematic of nerve innervation surrounding TMJ showed an increased innervation in CFA mice, compared with control. All data are represented as mean ± SEM. Student’s t test. n = 5 mice, **P < 0.01. TUBB3, tubulin beta 3.
Figure 4
Figure 4. scRNA-Seq analysis of all cells in the TMJ of control and CFA mice.
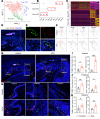
(A) Schematic diagram of TMJ inoculation and experimental procedure of single-cell analysis. (B) Uniform manifold approximation and projection (UMAP) visualization of major cell types highlighted with different colors in TMJ. (C) Dot plot depicting selected markers enriched for each cell population within the TMJ. (D) UMAP plot for both control (red) and CFA (blue) with the major cell types. Red arrow indicates the reduced osteocyte population in CFA group, while black arrowheads represent the increased monocyte, macrophage, and osteoclast subsets in CFA group compared with control. The red arrowhead indicates an increased endothelial cell population in the CFA group compared with the control. (E) Proportion of each cell cluster in CFA group versus control. Red arrow indicates the reduced osteocyte population, and black arrowheads represent the increased macrophages in CFA group compared with control. The red arrowhead indicates an increased endothelial cell population in the CFA group compared with the control. (F) Feature plots showing the expression of Ccr2 (monocytes), C1qa (macrophages), and Acp5 (osteoclasts), which are distributed closely but are separated from each other in UMAP plot and are increased in CFA group compared with control. Normalized expression levels for each cell are color-coded and overlaid onto the UMAP plot. Myh11, myosin heavy chain 11; Acta2, α–smooth muscle actin; ND, not determined.
Figure 5
Figure 5. Endothelial cell heterogeneity and neurovascular induction in control and CFA TMJ.
(A) UMAP plot of endothelial cell clusters in adult mouse TMJ. (B and C) Dot plot and heatmap of signature genes in different endothelial cell clusters, including Plasmalemma vesicle-associated protein capillary endothelial cell (Plvap cEC), macrovascular endothelial cell (MacroEC), and carbonic anhydrase 4 capillary endothelial cell (Car4 cEC). (D and E) Confocal imaging of TMJ sagittal sections stained with antibodies against Car4 (green) and Plvap (red). DAPI stains nuclei (blue). Images in E are enlargements of boxed TMJ RDT in D. Scale bar: 100 μm in D and 10 μm in E. (F) Feature plots showing the expression of indicated genes that are overlaid on the UMAP plot. Black arrowheads indicate the Plvap capillary endothelial cells expressing proliferation marker Mki67. (G and H) Confocal imaging of sagittal TMJ sections stained with antibodies against TUBB3 (red) and CD31 (green). DAPI stains nuclei (blue). Images in H (20× objective) are enlargements of boxed regions of TMJ in G (4× objective) at the anterior, posterior, and superior regions. Scale bars: 100 μm. (IK) Quantification of the area fraction of TUBB3+ neural and CD31+ vasculature area fraction in the TMJ area. N ≥ 4 mice. All data are represented as mean ± SEM. Student’s t test. n ≥ 4 mice, *P < 0.05, **P < 0.01, ***P < 0.001.
Figure 6
Figure 6. Synovial fibroblast heterogeneity and anatomical locations in control and CFA TMJ.
(A) UMAP plot of fibroblast cell clusters in adult mouse TMJ. (B and C) Dot plot and heatmap of signature genes in different fibroblast cell clusters including lining, perivascular, and sublining fibroblasts. (D and E) Confocal imaging of TMJ sagittal sections after RNAscope staining of Thy1 (green) and Prg4 (red). DAPI stains nuclei (blue). Images in E (20× objective) are enlargements of boxed TMJ regions in D (4× objective). Scale bars: 100 μm. (FH) Quantification of the area fraction of Thy1+ sublining fibroblast and Prg4+ lining fibroblast area fraction in the TMJ area. N ≥ 3 mice. (I) Feature plots showing the expression of indicated genes that are overlaid on the UMAP plot. (J) Schematic overview of expanded Thy1+ sublining fibroblasts and reduced Prg4+ expression in synovial lining fibroblasts in CFA-induced TMJOA with pain. All data are represented as mean ± SEM. Student’s t test, N ≥ 3 mice. *P < 0.05, **P < 0.01, ***P < 0.001. Prg4, proteoglycan 4.
Figure 7
Figure 7. Immune cell heterogeneity and increased inflammatory response in CFA TMJ.
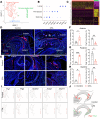
(A) UMAP plot of immune cell clusters in adult mouse CFA TMJ. (B and D) Dot plot and heatmap of signature genes in different immune cell clusters including monocyte, osteoclast, and macrophage. (C) Feature plots showing the expression of indicated cell type marker genes that are overlaid on the UMAP plot. (E) UMAP plot for both control and CFA with the major cell types. Black arrowheads indicate the most upregulated cell types, including neutrophils and macrophages, in CFA TMJ. (F) Confocal imaging of sagittal TMJ sections stained with antibodies against Iba1 (white). DAPI stains nuclei (blue). Scale bar: 100 μm. (G and H) Quantification of the area fraction of Iba1+ macrophages (surrounding TMJ) and Ly6b+ neutrophils (anterior part of surrounding TMJ). N = 3–4 mice. (I) Schematic diagram of expanded Iba1+ macrophages (black) and Ly6b+ neutrophils (red) in CFA TMJ compared with control. (J and K) RNAscope of IL-1β (red) and immunofluorescence staining of Ly6b (white) and Iba1 (green) in different regions surrounding TMJ. DAPI stains nuclei (blue). Images in K (20× objective) are enlargements of boxed regions in J (4× objective). Scale bars: 100 μm. (LN) Quantification of the area fraction of IL-1β+Ly6b+ and IL-1β+Iba1+ cells in the anterior, posterior, and superior regions of TMJ. N = 3–5 mice. All data are represented as mean ± SEM. Student’s t test. N = 3–5 mice, *P < 0.05, **P < 0.01, ***P < 0.001.
Figure 8
Figure 8. The functional importance of Igf1 signaling in barrier macrophages in TMJOA.
(A and B) The expression of Cx3cr1-YFP at the synovial membranes. Arrows indicate Cx3cr1+ macrophage lining cells (green). DAPI stains nuclei. Scale bar: 100 μm. (C) NetVisual_circle plot for the cell-cell interaction between major cell types in the TMJ. (D) Feature plots showing the expression of Cx3cr1 and Igf1 genes that are overlaid on the UMAP plot of CFA TMJ. (E and F) Confocal imaging of sagittal TMJ sections stained with Cx3cr1-YFP (green) in conjunction with RNAscope of Prg4 (red) and Thy1 (white). DAPI stains nuclei (blue). Images in F (63× objective) are enlargements of boxed regions in image E (4× objective). Scale bars: 100 μm. (G) Confocal imaging of sagittal TMJ sections stained with Cx3cr1-YFP in control and CFA mice. DAPI stains nuclei (blue). Scale bar: 100 μm. (H) Schematic of Cx3cr1 cells together with Iba1 macrophages and Ly6b neutrophils in control and CFA TMJ. (I and J) Confocal imaging of sagittal whole TMJ or anterior TMJ sections stained with antibodies against TUBB3 (red) and CGRP (green). DAPI stains nuclei (blue). Scale bars: 100 μm. (K) Quantification of the TUBB3+CGRP+ area fraction. (L) A schematic diagram of dynamic changes in cell type and anatomical position in the TMJ under healthy conditions and TMJOA with pain. All data are represented as mean ± SEM. Student’s t test. N = 3–5 mice, *P < 0.05.

References

    1. Scrivani SJ, et al. Temporomandibular disorders. N Engl J Med. 2008;359(25):2693–2705. doi: 10.1056/NEJMra0802472. - DOI - PubMed
    1. [no authors listed] International Classification of Orofacial Pain, 1st edition (ICOP) Cephalalgia. 2020;40(2):129–221. doi: 10.1177/0333102419893823. - DOI - PubMed
    1. Schiffman E, et al. Diagnostic criteria for temporomandibular disorders (DC/TMD) for clinical and research applications: recommendations of the international RDC/TMD consortium network and orofacial pain special interest group†. J Oral Facial Pain Headache. 2014;28(1):6–27. doi: 10.11607/jop.1151. - DOI - PMC - PubMed
    1. Wang X, et al. Current understanding of pathogenesis and treatment of TMJ osteoarthritis. J Dent Res. 2015;94(5):666–673. doi: 10.1177/0022034515574770. - DOI - PubMed
    1. Sperry M, et al. Experimental methods to inform diagnostic approaches for painful TMJ osteoarthritis. J Dent Res. 2019;98(4):388–397. doi: 10.1177/0022034519828731. - DOI - PMC - PubMed