. 2025 Feb 10;10(3):e165837.
doi: 10.1172/jci.insight.165837.

Regulation of lung progenitor plasticity and repair by fatty acid oxidation

Affiliations

Regulation of lung progenitor plasticity and repair by fatty acid oxidation

Quetzalli D Angeles-Lopez et al. JCI Insight. .

Abstract

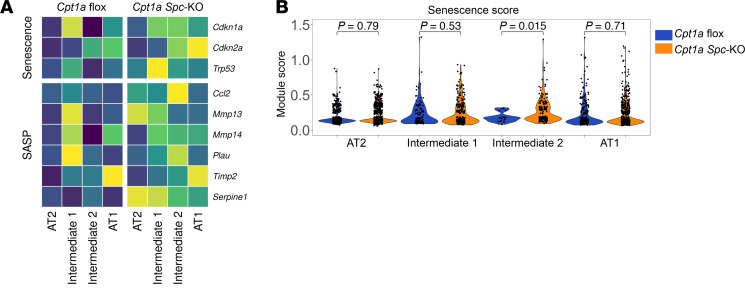
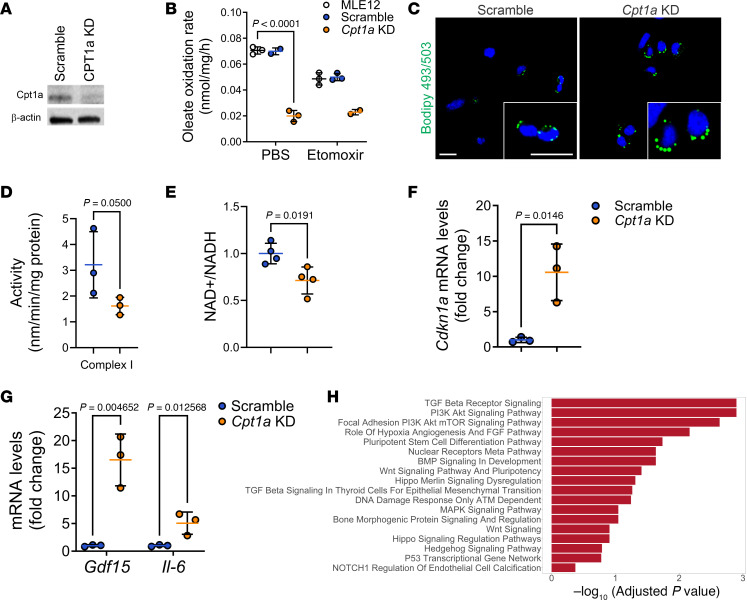
Idiopathic pulmonary fibrosis (IPF) is an age-related interstitial lung disease, characterized by inadequate alveolar regeneration and ectopic bronchiolization. While some molecular pathways regulating lung progenitor cells have been described, the role of metabolic pathways in alveolar regeneration is poorly understood. We report that expression of fatty acid oxidation (FAO) genes is significantly diminished in alveolar epithelial cells of IPF lungs by single-cell RNA sequencing and tissue staining. Genetic and pharmacological inhibition in AT2 cells of carnitine palmitoyltransferase 1a (CPT1a), the rate-limiting enzyme of FAO, promoted mitochondrial dysfunction and acquisition of aberrant intermediate states expressing basaloid, and airway secretory cell markers SCGB1A1 and SCGB3A2. Furthermore, mice with deficiency of CPT1a in AT2 cells show enhanced susceptibility to developing lung fibrosis with an accumulation of epithelial cells expressing markers of intermediate cells, airway secretory cells, and senescence. We found that deficiency of CPT1a causes a decrease in SMAD7 protein levels and TGF-β signaling pathway activation. These findings suggest that the mitochondrial FAO metabolic pathway contributes to the regulation of lung progenitor cell repair responses and deficiency of FAO contributes to aberrant lung repair and the development of lung fibrosis.

Keywords: Fatty acid oxidation; Fibrosis; Metabolism; Mitochondria; Pulmonology.


Conflict of interest statement

Conflict of interest: The authors have declared that no conflict of interest exists.

Figures

Figure 1
Figure 1. FAO gene expression decreases with age and IPF disease in lung epithelial cells.
(A) Fatty acid oxidation (FAO) pathway. (B) Up- (red) and downregulated (blue) pathways between healthy donor (n = 9) and IPF (n = 6) AT2 cells (adjusted P < 0.05). (C) FAO score of all the epithelial and airway subtypes from healthy old deceased donor (n = 9) and IPF lungs (n = 6). Violin plots display the distribution of data, and statistical significance was determined by Wilcoxon’s test. (D) Visualization and quantification of lung transcriptomic information obtained through Xenium-based spatial transcriptomics analysis. In the image, colors correspond to the legend. Each dot represents a sequencing spot. Scale bar: 50 μm. Left graph shows the decrease in SFTPC+ cells in IPF lung tissue and right graph shows the decrease in transcripts related to the FAO pathway in SFTPC+ cells in healthy old donors (n = 2) and IPF (n = 2). Data represent mean ± SD; each dot represents a field of view (FOV) from 2 tissues per condition. Statistical significance was determined by 2-tailed Student’s t test (left graph) and individual unpaired t test (right graph). (E) Immunofluorescent staining showing CPT1a expression (red) in AT2 cells (green) in human lungs from young and old deceased donor or IPF lungs (n = 3, per group) and quantification of number of HT2-280+ and CPT1a+ cells. Scale bars: 50 μm. Data represent mean ± SD; each dot represents a FOV. Statistical significance was determined by 1-way ANOVA followed by Tukey’s multiple-comparison test.
Figure 2
Figure 2. Inhibition of CPT1a in AT2 cells induces the emergence of RAS and basaloid cell phenotypes in human organoids.
(A) Top: Timeline of the experiment. Bottom: Immunofluorescence depicting expression of AGER and KRT17 in human HT2-derived organoids during the expansion and differentiation phases and mRNA levels of LAMP3 and AQP5 (n = 3). Data represent mean ± SD; each dot represents a technical replicate. Statistical significance was determined by 2-way ANOVA followed by Šidák’s multiple-comparison test. (B) mRNA levels of epithelial and secretory markers in organoids on day 10 of expansion treated with DMSO or etomoxir. Data represent mean ± SD; each dot represents a technical replicate. Statistical significance was determined by multiple unpaired t test. (C) Top: Scheme of the human alveolar organoid experimental design in the presence of CPT1a inhibitor etomoxir. Bottom: Representative immunofluorescence images (left) and mRNA levels (right) showing that SCGB1A1 expression increases when CPT1a is pharmacologically inhibited with etomoxir (n = 3, each group). Data represent mean ± SD; each dot represent a technical replicate. Statistical significance was determined by 1-way ANOVA followed by Tukey’s multiple-comparison test. (D) Expression of SCGB3A2 in organoids treated with etomoxir. SP-C (white) was used as an AT2 marker, SCGB3A2 (red) was used as a secretory cell marker, and HOPX (green) was used as an AT1 marker. (E) Scheme of the human alveolar organoid experimental setup with CPT1a inhibitor treatment. Representative immunofluorescence images and mRNA levels showing increased KRT17 expression upon CPT1a pharmacological inhibition with etomoxir (n = 3, per condition). SP-C (green) was used as an AT2 marker, HOPX (red) was used as an AT1 marker, and KRT17 (white) was used as a transitional cell marker. Data represent mean ± SD: each dot represents a technical replicate. Statistical significance was determined by 1-way ANOVA followed by Tukey’s multiple-comparison test. (F) Expression of SCGB3A2 in organoids from iAT2 cells treated with etomoxir. (G) UMAP showing the expression of SCGB3A2 and KRT17 in organoids from iAT2 cells culture in CK-DCI media. Color scale denotes the normalized expression. All scale bars: 50 μm.
Figure 3
Figure 3. Cpt1a deletion in AT2 cells reduces resistance to lung fibrosis.
(A and B) Oxygen consumption rate (OCR) in EpCAM+ cells from floxed and Cpt1a Spc-KO mice (n = 3, per genotype) showing BSA-palmitate–challenged (A) and baseline cells (B). RAU, relative absorbance units. Data represent mean ± SD; statistical significance was determined by 2-way repeated-measures ANOVA. *P < 0.05, **P < 0.01, ***P < 0.001. (C) Scheme of the experiment and Kaplan-Meier curve of Cpt1a-floxed and Cpt1a Spc-KO mice upon bleomycin injury (n = 6–10, starting mice). (D) Hydroxyproline (OH-proline) lung content was determined in Cpt1a-floxed and Cpt1a Spc-KO mice, showing an increase in collagen deposition in Cpt1a Spc-KO lungs after bleomycin injury (Cpt1a-floxed-PBS, n = 8; Cpt1a Spc-KO-PBS, n = 3; Cpt1a-floxed-Bleomycin, n = 8; Cpt1a Spc-KO-Bleomycin, n = 8). Data represent mean ± SD: statistical significance was determined by 2-way ANOVA followed by Tukey’s multiple-comparison test. (E) Representative Masson’s trichrome micrographs 12 days after bleomycin injury showing collagen deposition (blue) in lungs from Cpt1a Spc-KO and floxed mice. Scale bars: 50 μm. (F) Scheme of the experiment and Kaplan-Meier curve of MHV-68–infected floxed and Cpt1a Spc-KO mice (n = 3–6, starting mice). (G) Representative Masson’s trichrome micrographs of lungs from Cpt1a Spc-KO and floxed mice 14 days after MHV-68 infection showing collagen deposition (blue). Scale bars: 50 μm. (H) mRNA levels of senescence and fibrosis markers in EpCAM+ epithelial cells from floxed (n = 6) and Cpt1a Spc-KO (n = 7) naive mice and floxed (n = 3) and Cpt1a Spc-KO (n = 7) infected mice. Data represent mean ± SD. Statistical significance was determined by 2-way ANOVA followed by Tukey’s multiple-comparison test.
Figure 4
Figure 4. Cpt1a deficiency in AT2 cells induces the emergence of cells in an ADI phenotype in vivo and in vitro.
(A) UMAP shows the distribution of all cell types from MHV-68–infected Cpt1a Spc-KO (n = 6) and Cpt1a-floxed control (n = 4) mice. (B) Box-and-whisker plots showing cell proportions of subject-specific epithelial cell types in MHV-68–infected Cpt1a Spc-KO (n = 6) and Cpt1a-floxed (n = 4) mice. Statistical significance was determined by Wilcoxon’s test. Each box represents the interquartile range (IQR), with the line inside indicating the median frequency. Whiskers extend to the minimum and maximum values within 1.5 times the IQR. Outliers are not explicitly visualized in the plot. (C) Heatmap showing z values of the mean expression for canonical epithelial markers and differentially expressed genes in each epithelial cell population from MHV-68–infected Cpt1a-floxed (n = 4) and Cpt1a Spc-KO (n = 6) mice. (D) Violin plots depicting the expression of Krt8 in the different epithelial cell types in MHV-68–infected Cpt1a Spc-KO (n = 6) and Cpt1a-floxed (n = 4) mice. Statistical significance was determined by Wilcoxon’s test. (E) Representative immunofluorescence images of KRT8+ cells in naive or MHV-68–infected Cpt1a-floxed and Cpt1a Spc-KO mice (n = 4, each group). SP-C (white) was used as an AT2 marker, PDPN (green) was used as an AT2 marker, and KRT8 (red) was used as a transitional cell marker. (F) Top: Scheme of the experiment. Bottom: Representative immunofluorescence images of precision-cut lung slices (PCLSs) from ROSAmT/mG SPC-Cre-ER mice treated with vehicle or CPT1a inhibitor (n = 5, per condition), showing an increase in KRT8 (red) in GFP+ cells after etomoxir treatment. (G) Top: Scheme of the mouse organoid culture experimental setup. Bottom: Representative immunofluorescence images of organoids from Cpt1a-floxed and Cpt1a Spc-KO mice, showing an increase in KRT8 in Cpt1a Spc-KO mouse organoids (n = 3, each group). SP-C (white) was used as an AT2 marker, HOPX (green) was used as an AT1 marker, and KRT8 (red) was used as a transitional cell marker. All scale bars: 50 μm.
Figure 5
Figure 5. Cpt1a deficiency promotes a RAS intermediate phenotype.
(A) Upregulated genes in Cpt1a Spc-KO vs. Cpt1a-floxed mice by epithelial cell type. Red color denotes significantly upregulated genes. (B) UMAP shows the distribution of all cell types and expression of Scgb1a1 in lung epithelial cells from MHV-68–infected Cpt1a Spc-KO (n = 6) and Cpt1a-floxed (n = 4) mice. (C) Heatmap showing z values of the mean expression for canonical epithelial markers and differentially expressed genes in AT1, Intermediate 1, Intermediate 2, and AT1 cell types, alongside basal cell markers. (D) Enrichment pathway analysis of Intermediate 2 cell population in Cpt1a Spc-KO mice. (E) Representative immunofluorescence images of the lungs of MHV-68–infected Cpt1a-floxed (n = 4) and Cpt1a Spc-KO (n = 6) mice. SP-C (white) was used as an AT2 marker, SCGB1 (red) was used as a secretory cell marker, and PDPN (green) was used as an AT1 marker. (F) Top: Scheme of the experiment. Bottom: Immunofluorescent staining and quantification of PCLSs from lineage tracing ROSAmT/mG SPC-Cre-ER mice treated with PBS or etomoxir, depicting higher SCGB1A1 intensity under etomoxir treatment. Data represent mean ± SD, n = 4 per condition. (G) Scheme of the mouse organoid culture experimental design. Representative immunofluorescence images of organoids from Cpt1a-floxed and Cpt1a Spc-KO mice (n = 3, per genotype) showing an increase in Scgb1a1 in Cpt1a Spc-KO mouse organoids. All scale bars: 50 μm.
Figure 6
Figure 6. Loss of CPT1a promotes expression of senescence markers in lung epithelial cells.
(A) Heatmap shows gene expression of senescence markers and senescence-associated secretory phenotype (SASP) genes in each epithelial cell population from MHV-68–infected Cpt1a-floxed (n = 4) and Cpt1a Spc-KO (n = 6) mice. (B) Senescence score in each epithelial cell population from MHV-68–infected Cpt1a-floxed (n = 4) and Cpt1a Spc-KO (n = 6) mice. Violin plots display the distribution of data; statistical significance was determined by Wilcoxon’s test.
Figure 7
Figure 7. Cpt1a deficiency induces mitochondrial dysfunction.
(A) Representative immunoblot showing efficient knockdown (KD) of Cpt1a in MLE 12 epithelial cells. (B) Oleate oxidation rate in Cpt1a-KD, scramble control, and parental MLE 12 cells (n = 3) in the presence and absence of CPT1a inhibitor etomoxir (MLE 12-PBS, n = 3; Scramble-PBS, n = 2; Cpt1a KD-PBS, n = 3; MLE12-PBS, n = 3; Scramble-PBS, n = 3; Cpt1a KD-PBS, n = 2). Data represent mean ± SD; statistical significance was determined by 2-way ANOVA followed by Tukey’s multiple-comparison test. (C) Representative images of BODIPY (lipid) staining of MLE 12 cells. Scale bars: 20 µm (D) Assessment of mitochondrial complex I activity in Cpt1a-KD compared with scramble MLE 12 cells (n = 3, per condition). Data represent mean ± SD; statistical significance was determined by Mann-Whitney U test. (E) NAD+/NADH ratio in Cpt1a-KD and scramble MLE 12 cells (n = 4, per condition). Data represent mean ± SD; statistical significance was determined by 2-tailed, unpaired Student’s t test. (F) Gene expression of senescence marker Cdkn1a in Cpt1a-KD and scramble (n = 4, per condition). Data represent mean ± SD; statistical significance was determined by Mann-Whitney U test. (G) mRNA levels of SASP genes (Gdf15 and Il6) in scramble controls and Cpt1a-KD cells (n = 3, per condition). Data represent mean ± SD; statistical significance was determined by unpaired Student’s t test. (H) Enriched pathways analysis of differentially expressed genes in Cpt1a-KD versus scramble cells.
Figure 8
Figure 8. Cpt1a deficiency induces activation of the TGF-β pathway.
Heatmap (A) and scores (B), showing the gene expression and activation of the TGF-β pathway in each epithelial cell population from MHV-68–infected Cpt1a-floxed (n = 4) and Cpt1a Spc-KO (n = 6) mice. Violin plots display the distribution of data, statistical significance was determined by Wilcoxon’s test. (C) Dot plot depicting gene expression of the TGF-β pathway in the cell populations from iAT2 organoids. (D) Top: Scheme of the human alveolar organoid culture experimental design in the presence of TGF-β treatment. Bottom: Representative immunofluorescence images showing the increased presence of the secretory cell marker SCGB1A1 (red) in organoids treated with TGF-β on day 2 or 5 of differentiation (n = 4, each group). HOPX (green) was used as an AT1 marker and KRT17 (white) was used as a transitional cell marker. Scale bars: 50 μm. (E) Heatmap shows the increased expression of TGF-β target genes in Cpt1a-KD cells compared with scramble (n = 3, per condition). (F) Representative Western blot images depicting levels of total Smad 2/3, Smad7, and p-Smad 2/3 on the left, with quantification on the right (n = 2, each group). Data represent mean ± SD. (G) Representative Western blot images depicting levels of Smad7 in Cpt1a-KD cells after acetate treatment on the left, with quantification on the right (n = 2, each group). Data represent mean ± SD. Representative immunofluorescence (H) and quantification (I) showing a decrease in SCGB1A1 expression in human organoids treated with etomoxir and acetate. Data represent mean ± SD. Statistical significance was determined by 1-way ANOVA followed by Tukey’s multiple-comparison test. Scale bars: 50 μm.

References

    1. Basil MC, et al. Human distal airways contain a multipotent secretory cell that can regenerate alveoli. Nature. 2022;604(7904):120–126. doi: 10.1038/s41586-022-04552-0. - DOI - PMC - PubMed
    1. Kadur Lakshminarasimha Murthy P, et al. Human distal lung maps and lineage hierarchies reveal a bipotent progenitor. Nature. 2022;604(7904):111–119. doi: 10.1038/s41586-022-04541-3. - DOI - PMC - PubMed
    1. Hao Y, et al. Integrated analysis of multimodal single-cell data. Cell. 2021;184(13):3573–3587.e29. doi: 10.1016/j.cell.2021.04.048. - DOI - PMC - PubMed
    1. Ruaro B, et al. The history and mystery of alveolar epithelial Type II Cells: focus on their physiologic and pathologic role in lung. Int J Mol Sci. 2021;22(5):2566. doi: 10.3390/ijms22052566. - DOI - PMC - PubMed
    1. Choi J, et al. Inflammatory signals induce AT2 cell-derived damage-associated transient progenitors that mediate alveolar regeneration. Cell Stem Cell. 2020;27(3):366–382.e7. doi: 10.1016/j.stem.2020.06.020. - DOI - PMC - PubMed

MeSH terms

LinkOut - more resources