. 2025 Apr 1;46(13):1250-1262.
doi: 10.1093/eurheartj/ehaf024.

Atrial cardiomyocyte-restricted cleavage of gasdermin D promotes atrial arrhythmogenesis

Affiliations

Atrial cardiomyocyte-restricted cleavage of gasdermin D promotes atrial arrhythmogenesis

Yue Yuan et al. Eur Heart J. .

Abstract

Background and aims: Enhanced inflammatory signalling causally contributes to atrial fibrillation (AF) development. Gasdermin D (GSDMD) is an important downstream effector of several inflammasome pathways. However, the role of GSDMD, particularly the cleaved N-terminal (NT)-GSDMD, in non-immune cells remains elusive. This study aimed to elucidate the function of NT-GSDMD in atrial cardiomyocytes (ACMs) and determine its contribution to atrial arrhythmogenesis.

Methods: Human atrial appendages were used to assess the protein levels and localization. A modified adeno-associated virus 9 was employed to establish ACM-restricted overexpression of NT-GSDMD in mice.

Results: The cleavage of GSDMD was enhanced in ACMs of AF patients. Atrial cardiomyocyte-restricted overexpression of NT-GSDMD in mice increased susceptibility to pacing-induced AF. The NT-GSDMD pore formation facilitated interleukin-1β secretion from ACMs, promoting macrophage infiltration, while up-regulating 'endosomal sorting complexes required for transport'-mediated membrane-repair mechanisms, which prevented inflammatory cell death (pyroptosis) in ACMs. Up-regulated NT-GSDMD directly targeted mitochondria, increasing mitochondrial reactive oxygen species (ROS) generation, which triggered proarrhythmic calcium-release events. The NT-GSDMD-induced arrhythmogenesis was mitigated by the mitochondrial-specific antioxidant MitoTEMPO. A mutant NT-GSDMD lacking pore-formation capability failed to cause mitochondrial dysfunction or induce atrial arrhythmia. Genetic ablation of Gsdmd prevented spontaneous AF development in a mouse model.

Conclusions: These findings establish a unique pyroptosis-independent role of NT-GSDMD in ACMs and arrhythmogenesis, which involves ROS-driven mitochondrial dysfunction. Mitochondrial-targeted therapy, either by reducing ROS production or inhibition of GSDMD, prevents AF inducibility, positioning GSDMD as a novel therapeutic target for AF prevention.

Keywords: Atrial fibrillation; ESCRT; Gasdermin D; Mitochondria.


Figures

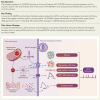
Structured Graphical Abstract
Working model illustrating how cleaved N-terminal gasdermin D may create a pro-arrhythmic substrate for atrial fibrillation development. Cleaved N-terminal gasdermin D forms pores in the plasma membrane, facilitating cytokine release and increasing macrophage infiltration to the atria. Due to the activation of endosomal sorting complexes required for transport-mediated membrane repair, inflammatory cell death (pyroptosis) does not occur. The up-regulation of N-terminal gasdermin D increases pore formation in mitochondria, impairing their integrity and promoting oxygen reactive species production. These changes synergistically cause Ca2+-handling abnormalities, electrical remodelling (action potential duration shortening), and structural remodelling (interstitial fibrosis and conduction slowing), thereby creating a substrate for atrial fibrillation induction and maintenance. AF, atrial fibrillation; APD, action potential duration; DAD, delayed after depolarization; ERP, effective refractory period; ESCRT, endosomal sorting complexes required for transport; Kv1.5, ultra-rapid delayed rectifier K+ channel; NLRP3, NACHT, LRR, and PYD domains containing protein 3; NT-GSDMD, N-terminal gasdermin D; ROS, reactive oxygen species. The figure was created with BioRender.com.
Figure 1
Figure 1
Atrial cardiomyocyte-specific overexpression of N-terminal gasdermin D enhances atrial fibrillation susceptibility. (A) Western blots of the full-length and N-terminal gasdermin D protein in atrial tissue of control and chronic atrial fibrillation patients. n = 11 per group. (B) Western blots of N-terminal gasdermin D protein in atrial cardiomyocytes from control and chronic atrial fibrillation patients. n = 8 per group. (C) Schematic representation of the development of aFlag and aGDNT mouse models using adeno-associated virus 9 viruses. (D) Western blots and quantification of N-terminal gasdermin D protein levels in the atria of aFlag and aGDNT mice. n = 5 per group. (E) Left: Representative simultaneous recordings of surface electrocardiogram (ECG) and intracardiac electrograms in mice and the incidence of pacing-induced atrial fibrillation. Right: Duration of inducible atrial fibrillation. (F) Quantification of atrial effective refractory period at 10 Hz pacing. n = 8 per group. (G) Left: representative activation maps. Right: Quantification of conduction velocity at 10Hz pacing in aFlag and aGDNT mice. n = 8 per group. (H) Immunostaining and quantification of Cx43, cell membrane wheat germ agglutinin (WGA), and nuclei 4′,6-diamidino-2-phenylindole (DAPI) in mouse atria. Scale bars, 50 or 25 μm. (I) Picrosirius red staining of whole hearts in aFlag and aGDNT mice and quantification of fibrotic area (pink colour) in left and right atria. Scale bars, 1 mm or 100 μm. n = 5 per group. The bar graph data are as mean ± SEM with individual values. P-values are determined with two-tailed Student’s t-test in A, B, D, G, H, and I, Fisher’s exact test in E (left), and Mann–Whitney test in E (right). AAV9, adeno-associated virus 9; ACM, atrial cardiomyocyte; AF, atrial fibrillation; cAF, chronic atrial fibrillation; Ctl, control; CV, conduction velocity; FL-GSDMD, full-length gasdermin D; NT-GSDMD, N-terminal gasdermin D; RA, right atrium
Figure 2
Figure 2
Activation of atrial inflammation in aGDNT mice. (A) Quantification of serum interleukin-1 beta and interleukin-6 levels in aFlag and aGDNT mice. n = 9 per group. (B) Representative flow cytometry and quantification of CD3+ T cells and CD11b+ myeloid cells in the atria of aFlag and aGDNT mice. n = 8 per group. (C) Representative flow cytometry and quantification of F4/80+ macrophages in the atria of aFlag and aGDNT mice. n = 8 per group. (D) Representative immunostaining and quantification of infiltrated macrophages (F4/80), Flag and nuclei DAPI in the atria of aFlag and aGDNT mice. Scale bars, 50 or 25 μm. All bar graph data are presented as mean ± SEM with individual values. P-values were determined with unpaired two-tailed Student’s t-test in AD. IL-1β, interleukin-1 beta; IL-6, interleukin-6
Figure 3
Figure 3
Enhanced endosomal sorting complexes required for transport membrane repair in aGDNT mice. (A) Left: Representative staining of propidium iodide, Flag, and nuclei DAPI. Right: Quantification of propidium iodide-positive nuclei in mouse atria. n = 4 per group. Scale bars, 50 or 25 μm. (B) Western blots and quantification of cytosol and membrane-bound full-length gasdermin D and N-terminal gasdermin D proteins in mouse atria. n = 4 per group. (C) Left: Representative staining of cell membrane (Cavolien3), Flag, and nuclei (4′,6-diamidino-2-phenylindole) in isolated atrial cardiomyocytes. Right: Pearson analysis of co-localization. n = 5–6 per group. (D) Western blots and quantification of CHMP3, CHMP4B, and VPS4A proteins in mouse atria. n = 4 or 5 per group. (E) Representative immunofluorescence staining and quantification of CHMP3 and cell membrane WGA co-localization in mouse atria. Scale bars, 50 or 25 μm. n = 5 per group. (F) Western blots and quantification of CHMP3, CHMP4B, and VPS4A proteins in the right atria of control and chronic AF patients. n = 15 or 16 per group. (G) Representative immunofluorescence staining and quantification of co-localization of cell membrane (wheat germ agglutinin) with CHMP3 or gasdermin D in human atria. Scale bars, 100 or 25 μm. n = 9 or 14 per group. All bar graph data are presented as mean ± SEM with individual values. P-values were determined with unpaired two-tailed Student’s t-test in AG. cAF, chronic atrial fibrillation; Ctl, control; Cyto, cytosol; FL-GSDMD, full-length gasdermin D; Mem, membrane; NT-GSDMD, N-terminal gasdermin D
Figure 4
Figure 4
Pore-forming deficient aGDAAA mice do not show increased susceptibility to atrial fibrillation. (A) Schematic representation of developing aGDAAA mice using adeno-associated virus 9 viruses. (B) Western blots and quantification of Flag and N-terminal gasdermin D proteins in mouse atria. n = 4 or 5 per group. (C) Left: Representative simultaneous recordings of surface ECG and intracardiac electrograms in mice and atrial fibrillation incidence. Right: Duration of inducible atrial fibrillation. (D) Quantification of atrial effective refractory period at 10 Hz pacing. n = 8 per group. (E) Left: Representative activation maps. Right: Quantification of CV at 10 Hz pacing in aGDNT and aGDAAA mice. n = 8 or 10 per group. (F) Representative immunofluorescence staining and quantification of Cx43, cell membrane WGA, and nuclei DAPI in mouse atria. Scale bars, 50 or 25 μm. (G) Representative Picrosirius red staining of whole hearts in aGDNT and aGDAAA mice and quantification of fibrotic area in the left and right atria. Scale bars, 1 mm. n = 5 per group. (H) Representative immunofluorescence staining and quantification of infiltrated macrophages (F4/80), Flag, and nuclei DAPI in the left atria from aGDNT and aGDAAA mice. Scale bars, 50 μm. n = 4 per group. All bar graph data are presented as mean ± SEM with individual values. P-values were determined with unpaired two-tailed Student’s t-test in B and DH, Fisher’s exact test in C (left), and Mann–Whitney test in C (right). AERP, atrial effective refractory period; AF, atrial fibrillation; AAV9, adeno-associated virus 9; NT-GSDMD, N-terminal gasdermin D
Figure 5
Figure 5
Up-regulated N-terminal gasdermin D localizes at mitochondria and causes mitochondrial dysfunction. (A) Western blots of full-length gasdermin D and N-terminal gasdermin D proteins in cytosol and mitochondrial fractions of atria from control and chronic atrial fibrillation patients. n = 7 per group. (B) Representative immunofluorescence staining and quantification of cytochrome c oxidase subunit IV, gasdermin D, cell membrane WGA, and nuclei DAPI in the atria of control and chronic atrial fibrillation patients. Scale bars, 100 or 25 μm. n = 9 per group. (C) Western blots and quantification of N-terminal gasdermin D protein in cytosol and mitochondrial fractions of mouse atria. n = 4 per group. (D) Representative immunofluorescence staining and quantification of co-localization of N-terminal gasdermin D (Flag) and mitochondrial marker (ATP5A1) in mouse atria. n = 4 per group. (E) Representative transmission electron microscopy images and quantification of injured mitochondria in mouse atria. n = 3 per group. (F) Western blots and quantification of mitochondrial complex protein in mouse atria. n = 4 per group. All bar graph data are presented as mean ± SEM with individual values. P-values were determined with unpaired two-tailed Student’s t-test in A and B, one-way analysis of variance multiple with Bonferroni correction for multiple comparisons in CF. cAF, chronic atrial fibrillation; Ctl, control; CV, conduction velocity; FL-GSDMD, full-length gasdermin D; NT-GSDMD, N-terminal gasdermin D
Figure 6
Figure 6
MitoTEMPO (TEMPO) reduced atrial fibrillation susceptibility in aGDNT mice. (A) Representative mtROS (MitoSOX) and nuclei DAPI staining in isolated atrial cardiomyocytes and quantification of MitoSOX signal in atrial cardiomyocytes from aFlag, aGDNT, and aGDAAA mice. n = 24 or 25 cells per group. (B) Representative traces of Ca2+ transients induced by 1 Hz pacing, followed by baseline recording and the application of 10 mmol/L caffeine. The incidence of spontaneous Ca2+ waves (indicated by red arrows) in atrial cardiomyocytes of aFlag, aGDNT, and aGDAAA mice. (C) Timeline of TEMPO injection in aGDNT mice. (D) Representative simultaneous recordings of surface ECG and intracardiac electrograms in aGDNT mice treated with saline or TEMPO, and the incidence of pacing-induced atrial fibrillation. (E) Duration of inducible atrial fibrillation. All bar graph data are presented as mean ± SEM with individual values. P-values were determined with one-way analysis of variance with Bonferroni correction for multiple comparisons in A, Fisher’s exact test in B and D, and two-tailed Mann–Whitney test in E. AAV9, adeno-associated virus 9; SCaWs, spontaneous Ca2+ waves
Figure 7
Figure 7
Genetic ablation of Gsdmd prevents spontaneous atrial fibrillation by improving mitochondrial integrity and function in mice. (A) Western blots and quantification of gasdermin D protein in the atria of Crem transgenic (Crem) mice with and without the Gsdmd knockout. n = 5 per group. (B) Representative immunofluorescence staining images and the Pearson score for co-localization of gasdermin D and mitochondria (ATP5A1) in mouse atria. Scale bars, 50 or 25 μm. n = 3 per group. (C) Left: Representative recordings of surface ECG in wild-type, Crem, Gsdmd−/−, and Crem:Gsdmd−/− mice. Right: Incidence of spontaneous atrial fibrillation in four groups of mice. (D) Quantification of spontaneous atrial fibrillation episodes. All bar graph data are presented as mean ± SEM with individual values. P-values were determined with one-way analysis of variance with Bonferroni correction for multiple comparisons in A and B, two-tailed Fisher’s exact test in C, and two-tailed Mann–Whitney test in D. FL-GSDMD, full-length gasdermin D; NT-GSDMD, N-terminal gasdermin D; WT, wild type

References

    1. Jackson SL, Tong X, Yin X, George MG, Ritchey MD. Emergency department, hospital inpatient, and mortality burden of atrial fibrillation in the United States, 2006 to 2014. Am J Cardiol 2017;120:1966–73. 10.1016/j.amjcard.2017.08.017 - DOI - PMC - PubMed
    1. Kornej J, Börschel CS, Benjamin EJ, Schnabel RB. Epidemiology of atrial fibrillation in the 21st century: novel methods and new insights. Circ Res 2020;127:4–20. 10.1161/CIRCRESAHA.120.316340 - DOI - PMC - PubMed
    1. Aviles RJ, Martin DO, Apperson-Hansen C, Houghtaling PL, Rautaharju P, Kronmal RA, et al. Inflammation as a risk factor for atrial fibrillation. Circulation 2003;108:3006–10. 10.1161/01.CIR.0000103131.70301.4F - DOI - PubMed
    1. Chung MK, Martin DO, Sprecher D, Wazni O, Kanderian A, Carnes CA, et al. C-reactive protein elevation in patients with atrial arrhythmias: inflammatory mechanisms and persistence of atrial fibrillation. Circulation 2001;104:2886–91. 10.1161/hc4901.101760 - DOI - PubMed
    1. Wazni O, Martin DO, Marrouche NF, Shaaraoui M, Chung MK, Almahameed S, et al. C reactive protein concentration and recurrence of atrial fibrillation after electrical cardioversion. Heart 2005;91:1303–5. 10.1136/hrt.2004.038661 - DOI - PMC - PubMed