. 2025 Feb 10;20(2):e0309880.
doi: 10.1371/journal.pone.0309880. eCollection 2025.

Bronchoalveolar lavage single-cell transcriptomics reveals immune dysregulations driving COVID-19 severity

Affiliations

Bronchoalveolar lavage single-cell transcriptomics reveals immune dysregulations driving COVID-19 severity

Clinton Njinju Asaba et al. PLoS One. .

Abstract

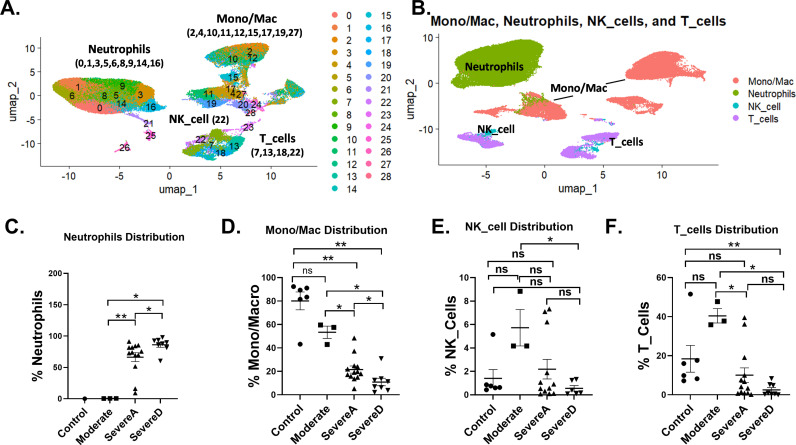
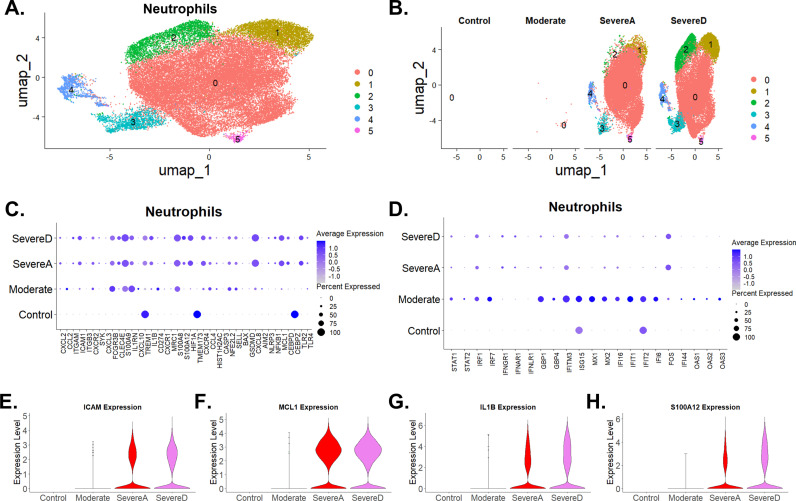
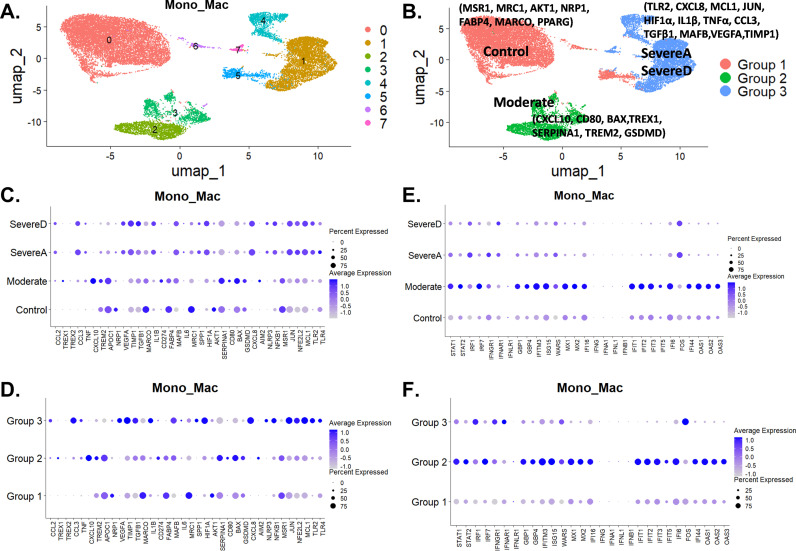
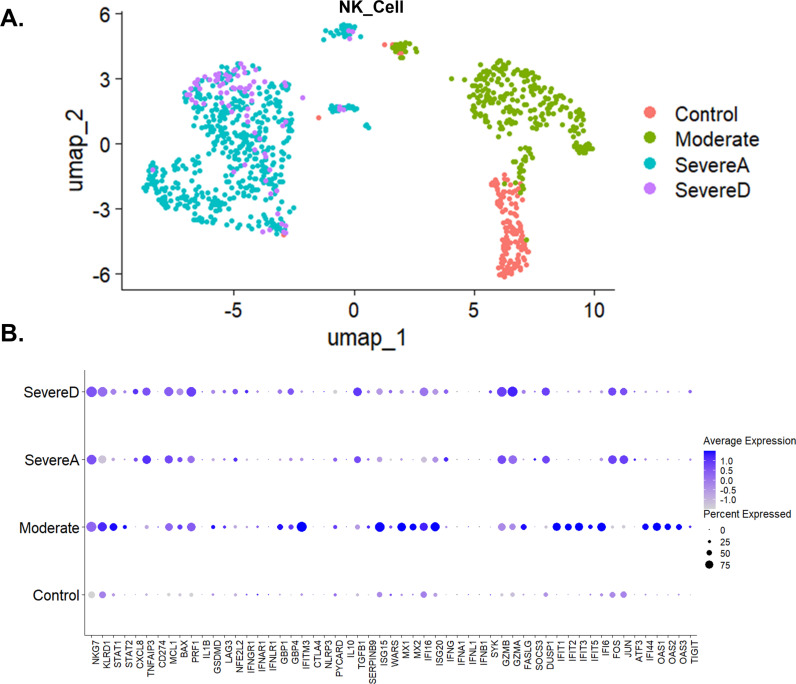
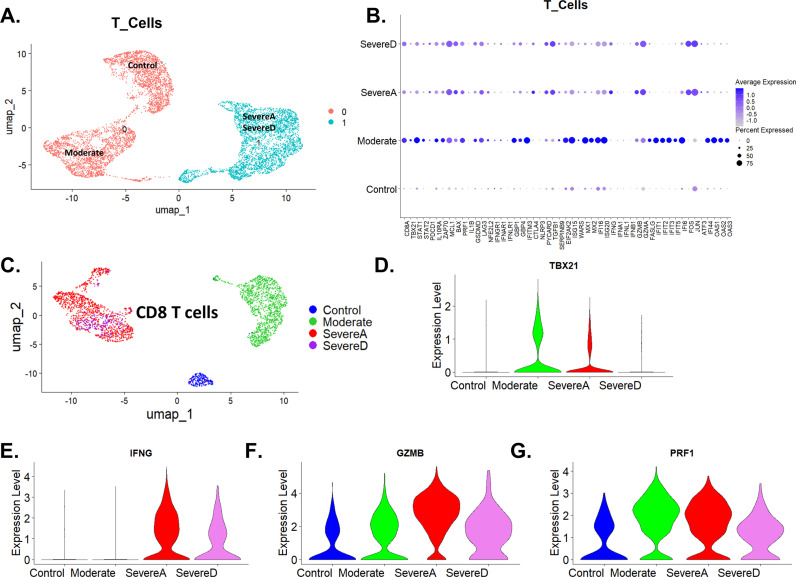
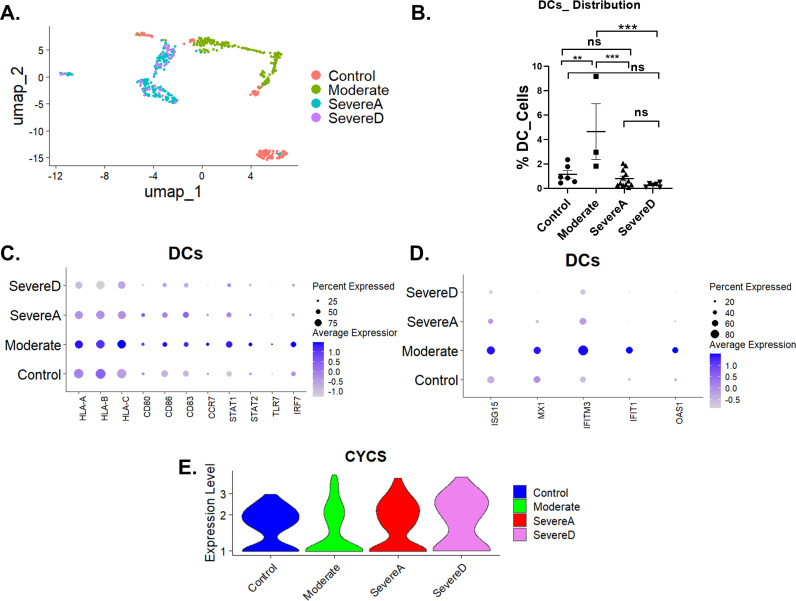
The continuous threats posed by Severe Acute Respiratory Syndrome Coronavirus 2 (SARS-CoV-2), the virus that causes COVID-19, including the emergence of potentially more infectious and deadly variants, necessitate ongoing studies to uncover novel and detailed mechanisms driving disease severity. Using single-cell transcriptomics, we conducted a secondary data analysis of bronchoalveolar lavage fluid (BALF) from COVID-19 patients of varying severities and healthy controls to comprehensively examine immune responses. We observed significant immune cell alterations correlating with disease severity. In severe cases, macrophages showed upregulation of pro-inflammatory genes TNFα and IL1β, contributing to severe inflammation and tissue damage. Neutrophils exhibited increased activation, marked by S100A8, CXCL8, and IL1β expression, with extended viability and reduced phagocytosis. Genes such as MCL1 and HIF1α supported extended viability, while MSR1 and MRC1 indicated reduced phagocytosis. Enhanced formation of neutrophil extracellular traps (NETs) and reduced clearance, indicated by NET-associated markers, were linked to thrombo-inflammation and organ damage. Both macrophages and neutrophils in severe cases showed impaired efferocytosis, indicated by decreased expression of MSR1 and TREM2 in macrophages and downregulation of FCGR3B in neutrophils, leading to the accumulation of apoptotic cells and exacerbating inflammation. Severe cases were characterized by M1 macrophages with high TNFα and IL1β, while milder cases had M2 macrophages with elevated PPARγ. Dendritic cells (DCs) in severe cases exhibited reduced proportions and attenuated expression of MHC class I genes (HLA-A, HLA-B, HLA-C) and co-stimulatory molecules (CD80, CD86), alongside increased cytochrome c expression, indicating impaired antigen presentation and enhanced apoptosis. NK and T cells in severe cases demonstrated altered receptor and gene expression, with increased activation markers IFNγ and ISG15, suggesting a paradoxical state of activation and exhaustion. This analysis highlights the critical role of dysregulated neutrophil, macrophage, dendritic cell, NK, and T cell responses in severe COVID-19, identifying potential therapeutic targets and providing novel insights into the disease.


Conflict of interest statement

None.

Figures

Fig 1
Fig 1. Single-cell atlas of immune subsets in Bronchoalveolar lavage fluid from healthy and COVID-19 patients.
(A) Two-dimensional UMAP represents the major immune cell types and associated clusters from bronchoalveolar lavage fluid among healthy donors and COVID-19 patients. (B) UMAP clustering distribution of four immune cell populations [Neutrophils, Monocytes-Macrophages (Mono/Mac), NK cells, and T cells]. The proportion of BALF immune cell types focusing on (C) Neutrophils, (D) Mono/Mac, (E) NK cells, and (F) T cells among Healthy Controls (n = 6), Moderate COVID-19 patients (n = 3), Severe Alive COVID-19 patients [SevereA] (n = 13), and Severe Dead COVID-19 patients [SevereD] (n = 8). Statistical analysis utilized the t-test with posttest Wilcox verification. Significance levels are indicated as follows: p <  0.001 (***), p <  0.01 (**), and p <  0.05 (*).
Fig 2
Fig 2. Comparative neutrophil cluster trajectories in Bronchoalveolar lavage from healthy and COVID-19 patients.
(A) UMAP plot shows six neutrophil subclusters from healthy individuals and COVID-19 patients. (B) Proportions and distribution of the various neutrophil clusters showing differential expressions across healthy donors and three patient groups (Moderate, SevereA, and SevereD). (C) Dot plot illustration of gene expression profiles of neutrophils focusing on top markers for chemokines, immune and antiviral regulatory genes, inflammatory, innate immune sensing, tissue homeostasis genes, and cell death/viability genes among healthy subjects and three COVID-19 patient groups (Moderate, SevereA, and SevereD). (D) Expression of top marker genes involved in antiviral immune protection and interferon response regulation among healthy control subjects and three COVID-19 patient groups (Moderate, SevereA, and SevereD). (E, F, G & H) Violin plot illustrations of neutrophil expression of (E) ICAM, (F) MCL1, (G) IL1β, and (H) S100A12 among healthy subjects and three COVID-19 patient groups (Moderate, SevereA, and SevereD).
Fig 3
Fig 3. Diverse single cell landscape of macrophage variations between healthy individuals and COVID-19 patients.
(A) Clustering of macrophages into 8 groups from healthy and COVID-19 infected patients. (B) Subgrouping revealing three major clusters with distinct gene profiles linking distributions to Healthy Controls (n = 6) -Group1, Moderate COVID-19 patients (n = 3) -Group 2, Severe Alive COVID-19 patients (SevereA) (n = 13) -Group 3, and Severe Dead COVID-19 patients (SevereD) (n = 8) -Group 3. (C & D) Expression of top marker genes involved in chemokines, immune and antiviral regulation, inflammation, innate immune sensing, tissue homeostasis, and cell death/viability among healthy individuals and the three COVID-19 patient groups (Moderate, SevereA, and SevereD) shown in dot plots. (E & F) Dot plot illustration of the expression profiles of top marker genes involved in antiviral immune protection and interferon response regulation among healthy individuals and three COVID-19 patient groups (Moderate, SevereA, and SevereD), with gene profile distributions to the three groupings in (B).
Fig 4
Fig 4. Gene expression profiling of NK cell in Bronchoalveolar lavage fluid from healthy individuals and COVID-19 patients.
(A) UMAP distribution of NK cells among healthy control individuals and the three COVID-19 patient groups (Moderate, SevereA, and SevereD). (B) Dot plot representation of top gene expression profiles of NK cells from healthy individuals and the three groups of COVID-19 patients (Moderate, SevereA, and SevereD).
Fig 5
Fig 5. Gene expression alterations in T cells from Bronchoalveolar lavage fluid of healthy and COVID-19 patients.
(A) UMAP plot showing T cell distribution among healthy individuals (Control) and COVID-19 patients (Moderate, SevereA, and SevereD). (B) Dot plot representation of top gene expression profiles of T cells from healthy individuals and the three groups of COVID-19 patients (Moderate, SevereA, and SevereD). (C) UMAP of CD8 T cells showing the distribution of cells in distinct groups among healthy subjects and COVID-19 patients (Moderate, SevereA, and SevereD). (D, E, F, & G) Violin plot illustrations of the four top genes associated with direct antiviral functions of CD8 cells, including (D) TBX21, (E) IFNγ, (F) Granzyme B (GZMB), and (G) Perforin (PRF1).
Fig 6
Fig 6. Impaired dendritic cell functions and viability correlate with disease severity in COVID-19.
(A) UMAP clustering of dendritic cells (DCs) showing transcriptional profiles across control, moderate, severe alive (severe A), and severe dead (severe D) patient groups. (B) Quantification of DC percentages in each patient group; data are presented as mean ±  SD with significance levels indicated (**p < 0.01, ***p < 0.001). (C) Dot plot showing expression levels of antigen presentation and co-stimulatory genes (HLA-A, HLA-B, HLA-C, CD80, CD86), maturation marker (CD83), and trafficking molecule (CCR7) in DCs across patient groups. The size of the dots represents the percentage of expressing cells, and the color intensity reflects the average expression level. (D) Dot plot displaying interferon-stimulated genes (ISG15, MX1, IFITM3, IFIT1, OAS1) and interferon signaling regulators (STAT1, STAT2, IRF7, TLR7) in DCs. (E) Violin plot showing cytochrome c (CYCS) expression levels in DCs, highlighting increased apoptosis in severe groups, particularly severe dead (severe D) cases.

References

    1. Ritchie HME, Rodés-Guirao L, Appel C, Giattino C, Ortiz-Ospina E, et al. Coronavirus pandemic (COVID-19). Our World in Data. 2024; Retrived July 14th 2024.
    1. Malireddi RKS, Sharma BR, Kanneganti T-D. Innate immunity in protection and pathogenesis during coronavirus infections and COVID-19. Annu Rev Immunol. 2024;42(1):615–45. doi: 10.1146/annurev-immunol-083122-043545 - DOI - PMC - PubMed
    1. Cheong J-G, Ravishankar A, Sharma S, Parkhurst CN, Grassmann SA, Wingert CK, et al. Epigenetic memory of coronavirus infection in innate immune cells and their progenitors. Cell. 2023;186(18):3882–3902.e24. doi: 10.1016/j.cell.2023.07.019 - DOI - PMC - PubMed
    1. Newton AH, Cardani A, Braciale TJ. The host immune response in respiratory virus infection: balancing virus clearance and immunopathology. Semin Immunopathol. 2016;38(4):471–82. doi: 10.1007/s00281-016-0558-0 - DOI - PMC - PubMed
    1. See H, Wark P. Innate immune response to viral infection of the lungs. Paediatr Respir Rev. 2008;9(4):243–50. doi: 10.1016/j.prrv.2008.04.001 - DOI - PMC - PubMed

MeSH terms