

Building a cancer risk and survival prediction model based on social determinants of health combined with machine learning: A NHANES 1999 to 2018 retrospective cohort study
- PMID: 39928823
- PMCID: PMC11813008
- DOI: 10.1097/MD.0000000000041370
Building a cancer risk and survival prediction model based on social determinants of health combined with machine learning: A NHANES 1999 to 2018 retrospective cohort study
Abstract
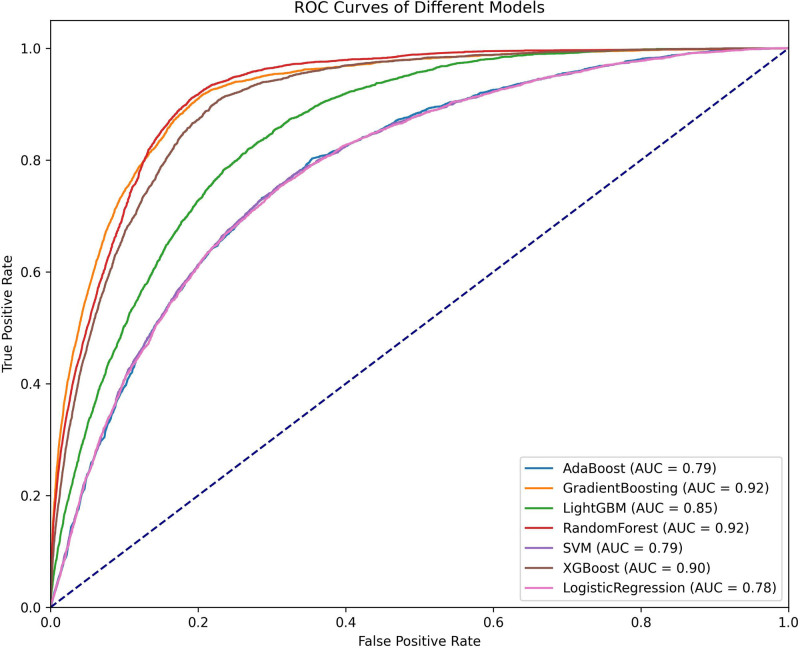
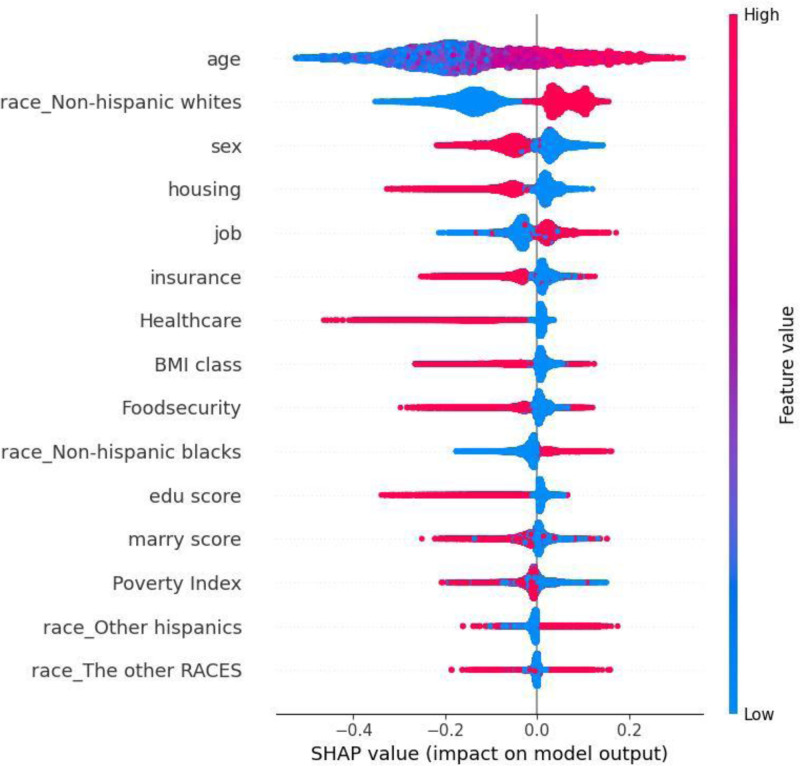
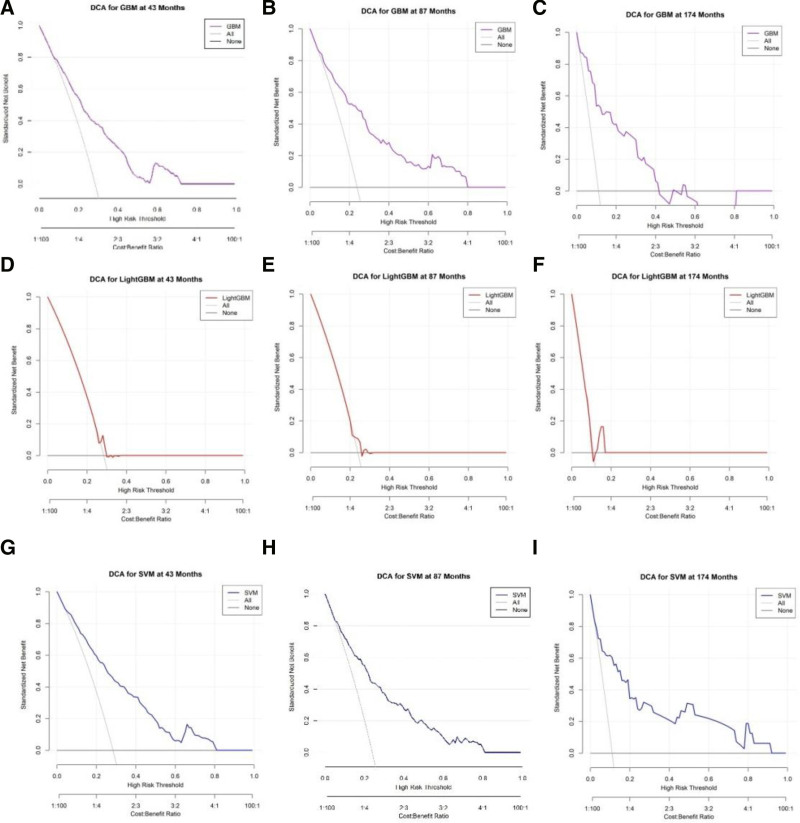
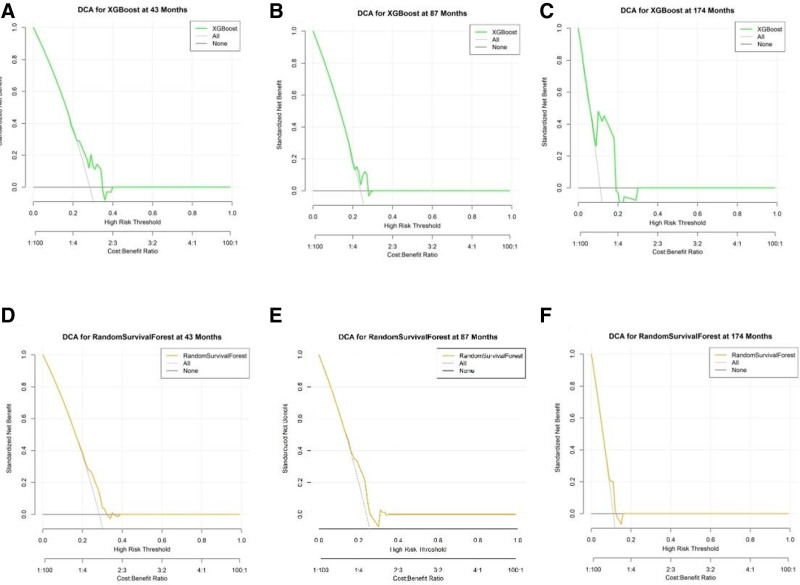
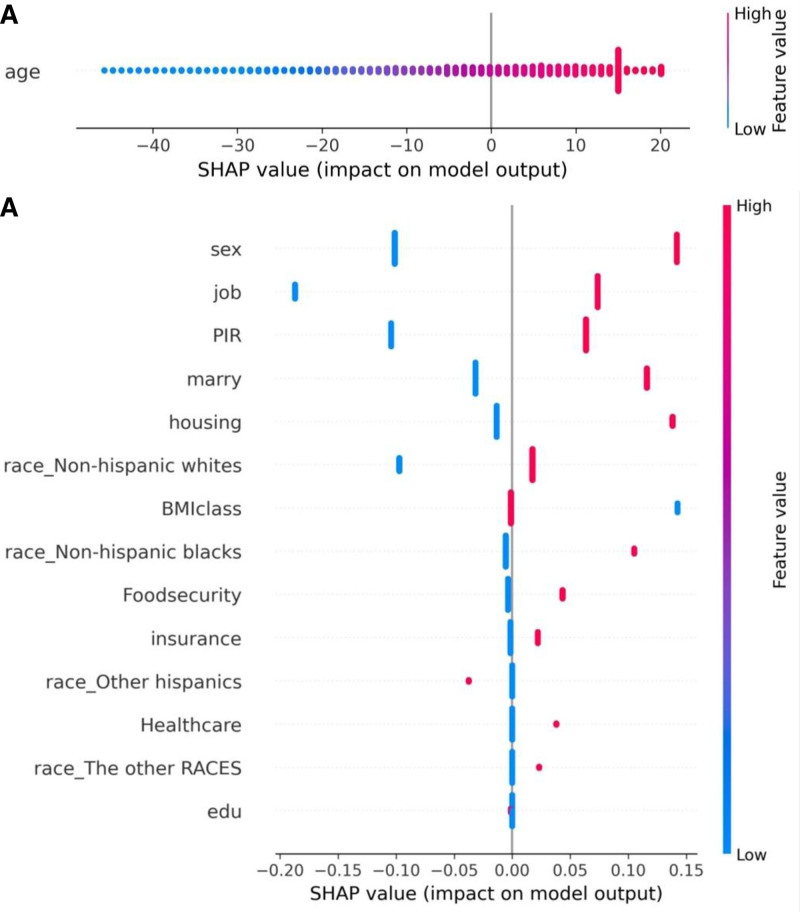
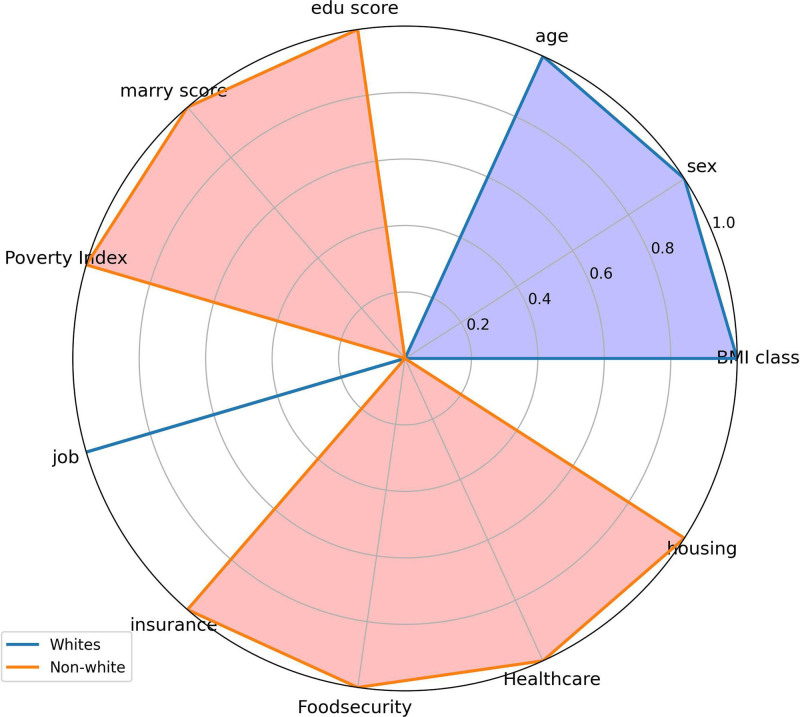
The occurrence and progression of cancer is a significant focus of research worldwide, often accompanied by a prolonged disease course. Concurrently, researchers have identified that social determinants of health (SDOH) (employment status, family income and poverty ratio, food security, education level, access to healthcare services, health insurance, housing conditions, and marital status) are associated with the progression of many chronic diseases. However, there is a paucity of research examining the influence of SDOH on cancer incidence risk and the survival of cancer survivors. The aim of this study was to utilize SDOH as a primary predictive factor, integrated with machine learning models, to forecast both cancer risk and prognostic survival. This research is grounded in the SDOH data derived from the National Health and Nutrition Examination Survey dataset spanning 1999 to 2018. It employs methodologies including adaptive boosting, gradient boosting machine (GradientBoosting), random forest (RF), extreme gradient boosting, light gradient boosting machine, support vector machine, and logistic regression to develop models for predicting cancer risk and prognostic survival. The hyperparameters of these models-specifically, the number of estimators (100-200), maximum tree depth (10), learning rate (0.01-0.2), and regularization parameters-were optimized through grid search and cross-validation, followed by performance evaluation. Shapley Additive exPlanations plots were generated to visualize the influence of each feature. RF was the best model for predicting cancer risk (area under the curve: 0.92, accuracy: 0.84). Age, non-Hispanic White, sex, and housing status were the 4 most important characteristics of the RF model. Age, gender, employment status, and household income/poverty ratio were the 4 most important features in the gradient boosting machine model. The predictive models developed in this study exhibited strong performance in estimating cancer incidence risk and survival time, identifying several factors that significantly influence both cancer incidence risk and survival, thereby providing new evidence for cancer management. Despite the promising findings, this study acknowledges certain limitations, including the omission of risk factors in the cancer survivor survival model and potential biases inherent in the National Health and Nutrition Examination Survey dataset. Future research is warranted to further validate the model using external datasets.
Copyright © 2025 the Author(s). Published by Wolters Kluwer Health, Inc.
Conflict of interest statement
The authors have no funding and conflicts of interest to disclose.
Figures
Similar articles
-
A Machine Learning Classification Model for Gastrointestinal Health in Cancer Survivors: Roles of Telomere Length and Social Determinants of Health.Int J Environ Res Public Health. 2024 Dec 19;21(12):1694. doi: 10.3390/ijerph21121694. Int J Environ Res Public Health. 2024. PMID: 39767532 Free PMC article.
-
Can Predictive Modeling Tools Identify Patients at High Risk of Prolonged Opioid Use After ACL Reconstruction?Clin Orthop Relat Res. 2020 Jul;478(7):0-1618. doi: 10.1097/CORR.0000000000001251. Clin Orthop Relat Res. 2020. PMID: 32282466 Free PMC article.
-
Identifying cardiovascular disease risk in the U.S. population using environmental volatile organic compounds exposure: A machine learning predictive model based on the SHAP methodology.Ecotoxicol Environ Saf. 2024 Nov 1;286:117210. doi: 10.1016/j.ecoenv.2024.117210. Epub 2024 Oct 23. Ecotoxicol Environ Saf. 2024. PMID: 39447292
-
Prediction of depressive disorder using machine learning approaches: findings from the NHANES.BMC Med Inform Decis Mak. 2025 Feb 17;25(1):83. doi: 10.1186/s12911-025-02903-1. BMC Med Inform Decis Mak. 2025. PMID: 39962516 Free PMC article.
-
Machine Learning Analysis of Nutrient Associations with Peripheral Arterial Disease: Insights from NHANES 1999-2004.Ann Vasc Surg. 2025 May;114:154-162. doi: 10.1016/j.avsg.2024.12.077. Epub 2025 Jan 30. Ann Vasc Surg. 2025. PMID: 39892831
Cited by
-
Artificial Intelligence Advancements in Oncology: A Review of Current Trends and Future Directions.Biomedicines. 2025 Apr 13;13(4):951. doi: 10.3390/biomedicines13040951. Biomedicines. 2025. PMID: 40299653 Free PMC article. Review.
References
-
- Bray F, Laversanne M, Sung H, et al. . Global cancer statistics 2022: GLOBOCAN estimates of incidence and mortality worldwide for 36 cancers in 185 countries. CA Cancer J Clin. 2024;74:229–63. - PubMed
-
- Siegel RL, Giaquinto AN, Jemal A. Cancer statistics, 2024. CA Cancer J Clin. 2024;74:12–49. - PubMed
-
- Sung H, Siegel RL, Rosenberg PS, Jemal A. Emerging cancer trends among young adults in the USA: analysis of a population-based cancer registry. Lancet Public Health. 2019;4:e137–47. - PubMed
-
- Syrnioti G, Eden CM, Johnson JA, Alston C, Syrnioti A, Newman LA. Social determinants of cancer disparities. Ann Surg Oncol. 2023;30:8094–104. - PubMed
MeSH terms
LinkOut - more resources
Full Text Sources
Medical
