. 2025 Feb 18;122(7):e2420324122.
doi: 10.1073/pnas.2420324122. Epub 2025 Feb 10.

Astrocytic EphA4 signaling is important for the elimination of excitatory synapses in Alzheimer's disease

Affiliations

Astrocytic EphA4 signaling is important for the elimination of excitatory synapses in Alzheimer's disease

Xin Yang et al. Proc Natl Acad Sci U S A. .

Abstract

Cell surface receptors, including erythropoietin-producing hepatocellular A4 (EphA4), are important in regulating hippocampal synapse loss, which is the key driver of memory decline in Alzheimer's disease (AD). However, the cell-specific roles and mechanisms of EphA4 are unclear. Here, we show that EphA4 expression is elevated in hippocampal CA1 astrocytes in AD conditions. Specific knockout of astrocytic EphA4 ameliorates excitatory synapse loss in the hippocampus in AD transgenic mouse models. Single-nucleus RNA sequencing analysis revealed that EphA4 inhibition specifically decreases a reactive astrocyte subpopulation with enriched complement signaling, which is associated with synapse elimination by astrocytes in AD. Importantly, astrocytic EphA4 knockout in an AD transgenic mouse model decreases complement tagging on excitatory synapses and excitatory synapses within astrocytes. These findings suggest an important role of EphA4 in the astrocyte-mediated elimination of excitatory synapses in AD and highlight the crucial role of astrocytes in hippocampal synapse maintenance in AD.

Keywords: Alzheimer’s disease; Eph receptors; complement signaling; reactive astrocytes; synapse loss.


Conflict of interest statement

Competing interests statement:The authors declare no competing interest.

Figures

Fig. 1.
Fig. 1.
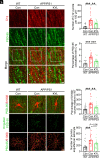
EphA4 expression is elevated in hippocampal CA1 pyramidal neurons and astrocytes in APP/PS1 mice. (A–F) Developmental expression of EphA4 in hippocampal CA1 pyramidal cells (A–C) and astrocytes (D–F) in 6-, 12-, and 18-mo-old APP/PS1 and WT mice. (A) Representative images of in situ hybridization (i.e., RNAscope) showing the expression of Epha4 in the hippocampal CA1 pyramidal layer in 12-mo-old APP/PS1 and WT mice. (Scale bar: 20 μm.) White dashed boxes outline areas of high magnification shown to the Right. (B) Representative zoomed-in images. (Scale bar: 10 μm.) White dashed circles indicate nuclei with average Epha4 puncta. (C) Quantitative analysis of Epha4 puncta per nucleus in the pyramidal cell layer (n = 3, 4, and 3 mice aged 6, 12, and 18 mo, respectively; *P < 0.05; unpaired two-tailed Student’s t test). (D) Representative RNAscope images showing Epha4 expression in hippocampal CA1 astrocytes in 12-mo-old APP/PS1 and WT mice. (Scale bar: 20 μm.) White dashed boxes outline areas of high magnification shown to the Right. (E) Representative zoomed-in images. (Scale bar: 10 μm.) White dashed outlines indicate astrocytes with average Epha4 puncta. (F) Quantitative analysis of the percentage of Epha4+ astrocytes (n = 3, 4, and 3 mice aged 6, 12, and 18 mo, respectively; **P < 0.01; unpaired two-tailed Student’s t test). Data are mean ± SEM.
Fig. 2.
Fig. 2.
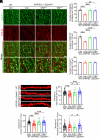
Deletion of CA1 astrocytic EphA4 restores the excitatory synapse loss in APP/PS1 mice. (A–D) Immunohistochemical analysis of PSD-95 and VGluT1 in the hippocampal CA1 region of 12-mo-old APP/PS1 × EphA4lx/lx mice after conditional knockout of neuronal or astrocytic EphA4 in the hippocampal CA1 region. (A) Representative images, including overlay images and higher-magnification segmented images, showing PSD-95 and VGluT1 clusters (Top and Bottom scale bars: 5 and 2 μm, respectively). White dashed boxes outline areas of high magnification shown on the Bottom. White arrows indicate VGluT1+ PSD-95 clusters. (B–D) Quantification of excitatory synapses (B), postsynaptic PSD-95+ puncta (C), and presynaptic VGluT1+ puncta (D) (wild-type [WT] × EphA4lx/lx AAV9-CaMKIIa [Con]: n = 7 mice, APP/PS1 × EphA4lx/lx Con: n = 5 mice, APP/PS1 × EphA4lx/lx AAV9-CaMKIIa-Cre [CKIICre]: n = 7 mice, APP/PS1 × EphA4lx/lx AAV9-GfaABC1D-Cre [GfaCre] virus injection: n = 7 mice; one-way ANOVA followed by post hoc Tukey’s test). (E–H) Structural modifications of dendrites after conditional knockout of neuronal or astrocytic EphA4 in the hippocampal CA1 region of 12-mo-old APP/PS1 × EphA4lx/lx mice. (E) Representative images showing dendritic spine morphology labeled with mCherry. (Scale bar: 2 μm.) (F–H) Quantification of total spine density (F), mature spine density (G), and immature spine density (H) (WT × EphA4lx/lx Con: n = 79 dendrites from 7 mice, APP/PS1 × EphA4lx/lx Con: n = 48 dendrites from 4 mice, APP/PS1 × EphA4lx/lx CKIICre: n = 40 dendrites from 4 mice, APP/PS1 × EphA4lx/lx GfaCre: n = 69 dendrites from 6 mice; *P < 0.05, **P < 0.01, ***P < 0.001, and #P < 0.05; one-way ANOVA followed by post hoc Tukey’s test). Data are mean ± SEM.
Fig. 3.
Fig. 3.
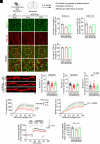
Blockade of EphA4 signaling rescues the loss of excitatory synapses and impairment of hippocampal synaptic transmission in APP/PS1 mice. (A) Schematic diagram of experimental design and analysis. (B–E) Immunohistochemical analysis of PSD-95 and VGluT1 in the hippocampal CA1 region of 12-mo-old APP/PS1 mice after KYL treatment. (B) Overlay and zoomed-in images showing PSD-95 and VGluT1 clusters (Top and Bottom scale bars: 5 and 2 μm, respectively). White dashed boxes outline areas of high magnification shown on the Bottom. White arrows indicate VGluT1+ PSD-95 clusters. (C–E) Quantification of excitatory synapses (C), postsynaptic PSD-95+ puncta (D), and presynaptic VGluT1+ puncta (E) (n = 6 mice per group; ***P < 0.001 and **P < 0.01; one-way ANOVA followed by post hoc Tukey’s test). (F–I) Structural modifications of dendrites in the hippocampal CA1 region of 12-mo-old APP/PS1 mice after KYL treatment. (F) Representative images showing dendritic spine morphology labeled with mCherry. (Scale bar: 2 μm.) (G–I) Quantification of total spine density (G), mature spine density (H), and immature spine density (I) (WT Con: n = 48 dendrites from 5 mice; APP/PS1 Con: n = 64 dendrites from 5 mice; APP/PS1 KYL: n = 59 dendrites from 5 mice; ***P < 0.001; one-way ANOVA followed by post hoc Tukey’s test). (J) Input–output curves showing the FV amplitude vs. stimulus amplitude (*P < 0.05, two-way repeated measure ANOVA). (K) Input–output curves showing the fEPSP slopes vs. stimulus amplitude (**P < 0.01, two-way repeated measure ANOVA). (L and M) Measurement of hippocampal LTP in 12-mo-old APP/PS1 mice after KYL treatment. (L) Points represent averaged fEPSP slopes normalized to baseline. Trace recordings 5 min before (1) and 50 min after (2) LTP induction (arrow) are shown. (M) Quantification of mean fEPSP slopes in the last 10 min of recording after the induction of LTP (WT Con: n = 24 slices from 9 mice, APP/PS1 Con: n = 16 slices from 7 mice, APP/PS1 KYL: n = 16 slices from 8 mice; *P < 0.05; one-way ANOVA followed by post hoc Tukey’s test). Data are mean ± SEM.
Fig. 4.
Fig. 4.
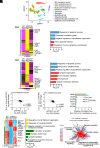
Blockade of EphA4 signaling strengthens synaptic connectivity between CA3 and CA1 excitatory neurons in APP/PS1 mice. (A) Unbiased identification of cell types in the mouse hippocampus. Uniform manifold approximation and projection (UMAP) plot showing 11 cell types identified in a total of 91,845 nuclei from all samples. (B) Heatmap showing the DEGs that exhibited modulation in KYL-treated APP/PS1 mice in CA3 excitatory neurons (APP/PS1 KYL vs. APP/PS1 Con and APP/PS1 Con vs. wild-type [WT] Con mice). (C) Bar chart showing results of GO analysis of the blue and red clusters of the heatmap in (B). (D) Heatmap showing the DEGs that exhibited modulation in KYL-treated APP/PS1 mice in CA1 excitatory neurons (APP/PS1 KYL vs. APP/PS1 Con mice and APP/PS1 Con vs. WT Con mice). (E) Bar chart showing the results of GO analysis of the red cluster of heatmap in (D). (F) Negative correlation of changes in the CA3 excitatory neuron transcriptome profile of APP/PS1 KYL vs. APP/PS1 Con mice and APP/PS1 Con vs. WT Con mice (r = −0.482, P < 0.0001). (G) Negative correlation of changes in the CA1 excitatory neuron transcriptome profile of APP/PS1 KYL vs. APP/PS1 Con mice and APP/PS1 Con vs. WT Con mice (r = −0.422, P < 0.0001). (H) Bar chart showing the communication strengths of the top pathways between CA3 and CA1 excitatory neurons identified by CellChat. (I) Heatmap showing the clustered differentially expressed proteins (DEPs) in the hippocampal synaptosome in APP/PS1 KYL vs. APP/PS1 Con mice. Right: Bar chart showing the results of GO analysis of the DEPs in yellow and green clusters in the heatmap on the Left, respectively. (J) Sunburst plot from SynGO showing the restored synaptic proteins in APP/PS1 mice after KYL treatment [green cluster in (I)]; proteins are classified according to their biological functional identities.
Fig. 5.
Fig. 5.
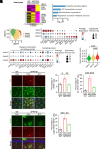
Astrocyte reactivity decreases upon KYL treatment. (A) Heatmap showing the DEGs that exhibited modulation in KYL-treated APP/PS1 mice in astrocytes (APP/PS1 KYL vs. APP/PS1 Con and APP/PS1 Con vs. WT Con mice). (B) Bar chart showing the GO analysis results of the blue cluster in (A). (C) UMAP plot showing 3 astrocyte subtypes from unbiased clustering of all astrocytes from the WT Con, APP/PS1 Con, and APP/PS1 KYL groups. (D) Dot plot showing the top unique markers of the three clusters ranked by P-value. (E) Dot plot showing the expression of candidate genes related to synapse elimination, phagocytosis, and synaptogenesis in astrocyte subclusters. (F) Violin plot showing the module scores of the 3 astrocyte subtypes expressing genes in (E) (Wilcoxon test). (G–I) Immunohistochemical analysis of C3 and GFAP in the hippocampal CA1 region of 12-mo-old APP/PS1 mice after KYL treatment. (G) Representative images of reactive astrocytes costained with C3 (red) and GFAP (green) in the hippocampal CA1 region. (Scale bar: 25 μm.) (H) Quantitative analysis of the percentage of the GFAP+ area in the hippocampal CA1 region. (I) Quantitative analysis of the percentage of C3+GFAP+ astrocytes among total GFAP+ astrocytes in the hippocampal CA1 region (n = 4, 3−4, and 4 mice for WT Con, APP/PS1 Con, and APP/PS1 KYL, respectively; **P < 0.01 and ***P < 0.001; one-way ANOVA followed by post hoc Tukey’s test). (J and K) Immunohistochemical analysis of CD44 in the hippocampal CA1 region of 12-mo-old APP/PS1 mice after KYL treatment. (J) Representative images of astrocytes costained with CD44 (green) and GFAP (red) in the hippocampal CA1 region. (Scale bar: 50 μm.) (K) Quantification of the percentage of CD44+GFAP+ astrocytes among total GFAP+ astrocytes in the hippocampal CA1 region (n = 3, 4, and 4 mice for WT Con, APP/PS1 Con, and APP/PS1 KYL, respectively; ***P < 0.001 and **P < 0.01; one-way ANOVA followed by post hoc Tukey’s test). Data are mean ± SEM.
Fig. 6.
Fig. 6.
Blockade of EphA4 signaling decreases C1q tagging on synapses and astrocytic engulfment of synaptic proteins in APP/PS1 mice. (A–C) Immunohistochemical analysis of C1q protein expression and tagging on PSD-95 in the hippocampal CA1 region of 12-mo-old APP/PS1 mice after KYL treatment. (A) Representative images showing C1q and PSD-95 (Top and Bottom scale bars: 5 and 2 μm, respectively). (B) Quantitative analysis of C1q+ puncta density and (C) percentage of PSD-95 colocalized with C1q in the hippocampal CA1 region (WT Con: n = 18 astrocytes from 5 mice, APP/PS1 Con: n = 27 astrocytes from 6 mice, APP/PS1 KYL: n = 24 astrocytes from 5 mice; ***P < 0.001 and **P < 0.01; one-way ANOVA followed by post hoc Tukey’s test). (D–F) Immunohistochemical analysis of the level of PSD-95 engulfed by astrocytes in the hippocampal CA1 region of 12-mo-old APP/PS1 mice after KYL treatment. (D) Representative images and 3D reconstruction including overlay of S100β and PSD-95 staining in the hippocampal CA1 region. (Scale bar: 5 μm.) (E) Quantification of S100β+ volume relative to the WT Con group. (F) Quantification of PSD-95 puncta inside astrocytes in the hippocampal CA1 region (WT Con: n = 29 astrocytes from 6 mice, APP/PS1 Con: n = 23 astrocytes from 5 mice, APP/PS1 KYL: n = 24 astrocytes from 5 mice; ***P < 0.001 and **P < 0.01; one-way ANOVA followed by post hoc Tukey’s test). Data are mean ± SEM.
Fig. 7.
Fig. 7.
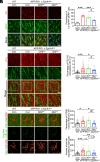
Deletion of astrocytic EphA4 decreases C1q tagging on PSD-95 and astrocytic engulfment of synaptic proteins. (A and B) Immunohistochemical analysis of C3 in the hippocampal CA1 region of 12-mo-old APP/PS1 × EphA4lx/lx mice after conditional knockout of neuronal or astrocytic EphA4 in the hippocampal CA1 region. (A) Representative images of reactive astrocytes labeled by costaining with C3 (red) and GFAP (green) in the hippocampal CA1 region of APP/PS1 × EphA4lx/lx mice. (Scale bar: 25 μm.) (B) Quantification of C3+GFAP+ astrocytes among total GFAP+ astrocytes in the hippocampal CA1 region (WT × EphA4lx/lx AAV9-CaMKIIa [Con]: n = 8 mice, APP/PS1 × EphA4lx/lx Con: n = 8 mice, APP/PS1 × EphA4lx/lx AAV9-CaMKIIa-Cre [CKIICre]: n = 5 mice, APP/PS1 × EphA4lx/lx AAV9-GfaABC1D-Cre [GfaCre]: n = 7 mice; one-way ANOVA followed by post hoc Tukey’s test). (C and D) Immunohistochemical analysis of C1q protein expression and tagging on PSD-95 in the hippocampal CA1 region. (C) Representative images, including overlay images showing C1q and PSD-95 (Top and Bottom scale bars: 5 and 2 μm, respectively). (D) Quantitative analysis of the percentage of PSD-95 colocalized with C1q in the hippocampal CA1 region (WT × EphA4lx/lx Con: n = 4 mice, APP/PS1 × EphA4lx/lx Con: n = 5 mice, APP/PS1 × EphA4lx/lx CKIICre: n = 4 mice, APP/PS1 × EphA4lx/lx GfaCre: n = 6 mice; *P < 0.05, ***P < 0.001, and #P < 0.05; one-way ANOVA followed by post hoc Tukey’s test). (E–G) Immunohistochemical analysis of the level of PSD-95 engulfed by astrocytes in the hippocampal CA1 region of APP/PS1 × EphA4lx/lx mice. (E) Representative images and 3D reconstruction including overlay of S100β and PSD-95 in the hippocampal CA1 region. (Scale bar: 5 μm.) (F) Quantification of S100β+ volume relative to that of WT mice. (G) Quantification of PSD-95 puncta inside astrocytes (WT × EphA4lx/lx Con: n = 30 astrocytes from 6 mice, APP/PS1 × EphA4lx/lx Con: n = 26 astrocytes from 5 mice, APP/PS1 × EphA4lx/lx CKIICre: n = 17 astrocytes from 4 mice, APP/PS1 × EphA4lx/lx GfaCre: n = 26 astrocytes from 6 mice; *P < 0.05, **P < 0.01, #P < 0.05, and ##P < 0.01; one-way ANOVA followed by post hoc Tukey’s test). Data are mean ± SEM.

References

    1. Penzes P., Cahill M. E., Jones K. A., VanLeeuwen J.-E., Woolfrey K. M., Dendritic spine pathology in neuropsychiatric disorders. Nat. Neurosci. 14, 285–293 (2011). - PMC - PubMed
    1. Kwon S. E., Chapman E. R., Synaptophysin regulates the kinetics of synaptic vesicle endocytosis in central neurons. Neuron 70, 847–854 (2011). - PMC - PubMed
    1. Querfurth H. W., LaFerla F. M., Alzheimer’s disease. N. Engl. J. Med. 362, 329–344 (2010). - PubMed
    1. Kobro-Flatmoen A., et al. , Re-emphasizing early Alzheimer’s disease pathology starting in select entorhinal neurons, with a special focus on mitophagy. Ageing Res. Rev. 67, 101307 (2021). - PubMed
    1. Hernández-Frausto M., Vivar C., Entorhinal cortex–hippocampal circuit connectivity in health and disease. Front. Hum. Neurosci. 18, 1448791 (2024). - PMC - PubMed

MeSH terms

LinkOut - more resources