

Clinicians' experience with infographic summaries from the BMJ Rapid Recommendations: a qualitative user-testing study among residents and interns at a large teaching hospital in Switzerland
- PMID: 39929503
- PMCID: PMC11815444
- DOI: 10.1136/bmjopen-2023-083032
Clinicians' experience with infographic summaries from the BMJ Rapid Recommendations: a qualitative user-testing study among residents and interns at a large teaching hospital in Switzerland
Abstract
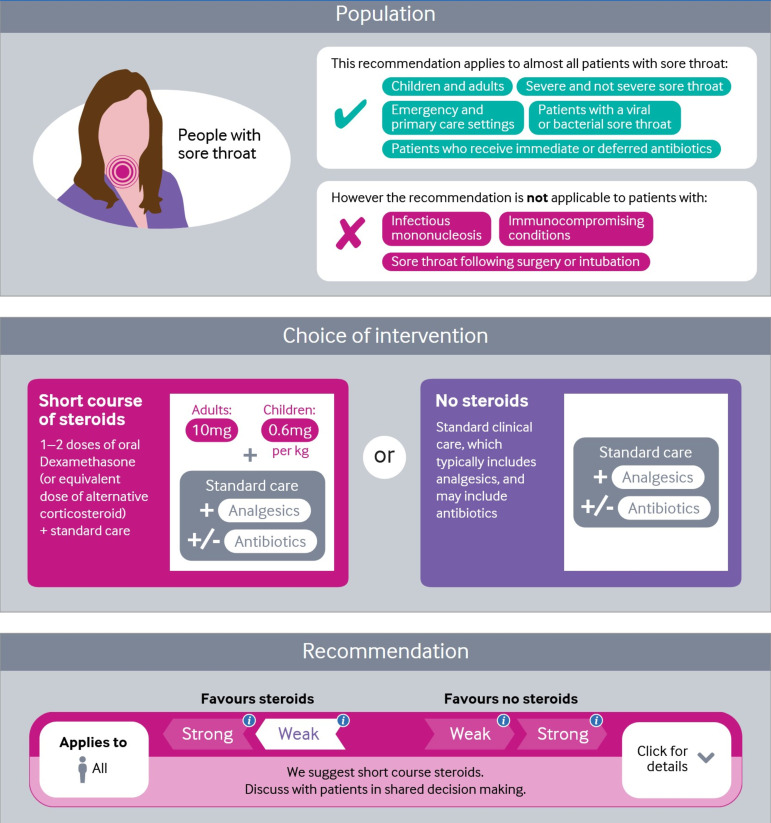
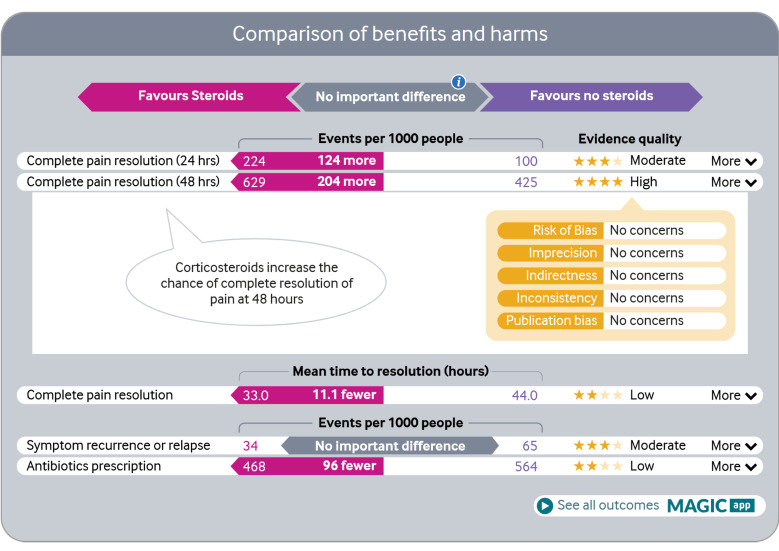
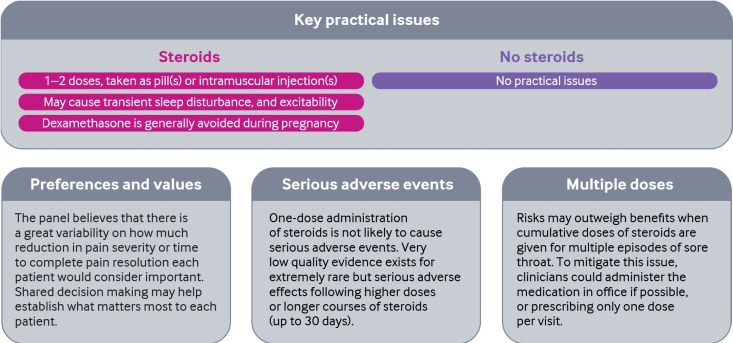
Objective: Clinicians need trustworthy clinical practice guidelines to succeed with evidence-based diagnosis and treatment at the bedside. The BMJ Rapid Recommendations explore innovative ways to enhance dissemination and uptake, including multilayered interactive infographics linked to a digitally structured authoring and publication platform (the MAGICapp). We aimed to assess user experiences of physicians in training in various specialties when they interact with these infographics.
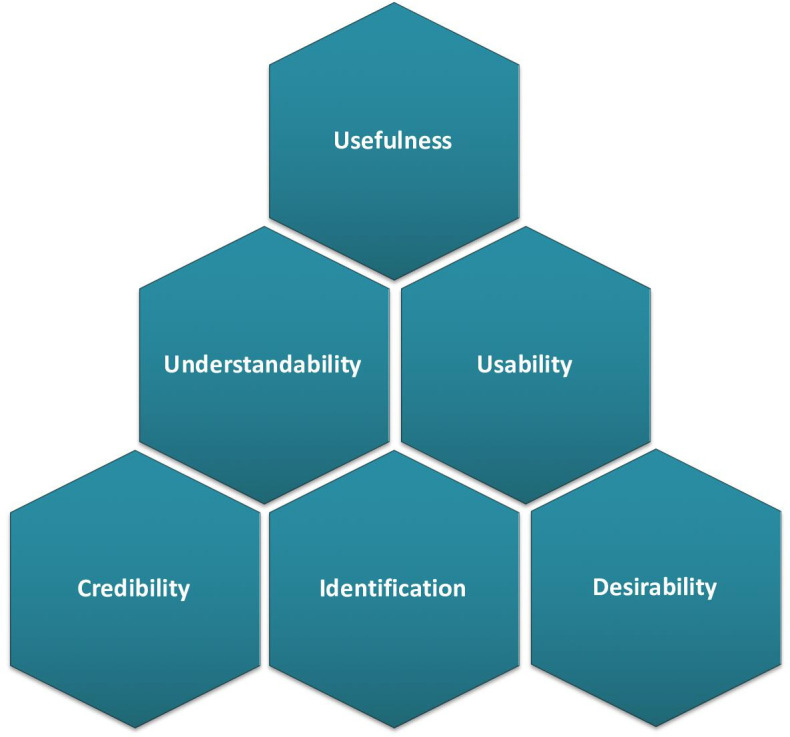
Design: We conducted a qualitative user-testing study to assess user experience of a convenience sample of physicians in training. User testing was carried out through guided think-aloud sessions. We assessed six facets of user experience using a revised version of Morville's framework: usefulness, understandability, usability, credibility, desirability and identification.
Setting: Setting include Geneva's University Hospital, a large teaching hospital in Switzerland.
Participants: Participants include a convenience sample of residents and interns without restriction regarding medical field or division of care.
Results: Most users reported a positive experience. The infographics were understandable and useful to rapidly grasp the key elements of the recommendation, its rationale and supporting evidence, in a credible way. Some users felt intimidated by numbers or the amount of information, although they perceived there could be a learning curve while using generic formats. Plain language summaries helped complement the visuals but could be further highlighted. Despite their generally positive experience, several users had limited understanding of key GRADE (Grading of Recommendations Assessment, Development and Evaluation) domains of the quality of evidence and remained uncertain by the implication of weak or conditional recommendations.
Conclusion: Our study allowed to identify several aspects of guideline formats that improve their understandability and usefulness. Guideline organisations can use our findings to adapt their presentation format to enhance their dissemination and uptake in clinical practice. Avenues for research include the interplay between infographics and the digital authoring platform, multiple comparisons and living guidelines.
Keywords: Information technology; MEDICAL EDUCATION & TRAINING; Protocols & guidelines.
© Author(s) (or their employer(s)) 2025. Re-use permitted under CC BY-NC. No commercial re-use. See rights and permissions. Published by BMJ Group.
Conflict of interest statement
Competing interests: TA is the Chair and PV the Chief Research and Innovation Officer of the MAGIC Evidence. Ecoystem Foundation, who coinitiated and is coordinating the BMJ Rapid Recommendations. TA has participated to the design of all infographics. The other authors declare no other competing interest. All authors have completed the ICMJE uniform disclosure form at (59) and declare no support from any organisation for the submitted work; no financial relationships with any organisations that might have an interest in the submitted work in the previous three years; no other relationships or activities that could appear to have influenced the submitted work.
Figures
Similar articles
-
Infographic summaries for clinical practice guidelines: results from user testing of the BMJ Rapid Recommendations in primary care.BMJ Open. 2023 Nov 9;13(11):e071847. doi: 10.1136/bmjopen-2023-071847. BMJ Open. 2023. PMID: 37945307 Free PMC article.
-
Decision aids linked to evidence summaries and clinical practice guidelines: results from user-testing in clinical encounters.BMC Med Inform Decis Mak. 2021 Jun 29;21(1):202. doi: 10.1186/s12911-021-01541-7. BMC Med Inform Decis Mak. 2021. PMID: 34187484 Free PMC article.
-
Digital encounter decision aids linked to clinical practice guidelines: results from user testing SHARE-IT decision aids in primary care.BMC Med Inform Decis Mak. 2023 May 22;23(1):97. doi: 10.1186/s12911-023-02186-4. BMC Med Inform Decis Mak. 2023. PMID: 37217915 Free PMC article.
-
UEG and EAES rapid guideline: Systematic review, meta-analysis, GRADE assessment and evidence-informed European recommendations on TaTME for rectal cancer.Surg Endosc. 2022 Apr;36(4):2221-2232. doi: 10.1007/s00464-022-09090-4. Epub 2022 Feb 25. Surg Endosc. 2022. PMID: 35212821 Free PMC article.
-
The effects of interactive training of healthcare providers on the management of life-threatening emergencies in hospital.Cochrane Database Syst Rev. 2019 Sep 24;9(9):CD012177. doi: 10.1002/14651858.CD012177.pub2. Cochrane Database Syst Rev. 2019. PMID: 31549741 Free PMC article.
References
MeSH terms
LinkOut - more resources
Full Text Sources