. 2025 Feb 10;16(1):1489.
doi: 10.1038/s41467-025-56024-4.

Trajectory analysis of hepatic stellate cell differentiation reveals metabolic regulation of cell commitment and fibrosis

Affiliations

Trajectory analysis of hepatic stellate cell differentiation reveals metabolic regulation of cell commitment and fibrosis

Raquel A Martínez García de la Torre et al. Nat Commun. .

Abstract

Defining the trajectory of cells during differentiation and disease is key for uncovering the mechanisms driving cell fate and identity. However, trajectories of human cells remain largely unexplored due to the challenges of studying them with human samples. In this study, we investigate the proteome trajectory of iPSCs differentiation to hepatic stellate cells (diHSCs) and identify RORA as a key transcription factor governing the metabolic reprogramming of HSCs necessary for diHSCs' commitment, identity, and activation. Using RORA deficient iPSCs and pharmacologic interventions, we show that RORA is required for early differentiation and prevents diHSCs activation by reducing the high energetic state of the cells. While RORA knockout mice have enhanced fibrosis, RORA agonists rescue multi-organ fibrosis in in vivo models. Notably, RORA expression correlates negatively with liver fibrosis and HSCs activation markers in patients with liver disease. This study reveals that RORA regulates cell metabolic plasticity, important for mesoderm differentiation, pericyte quiescence, and fibrosis, influencing cell commitment and disease.


Conflict of interest statement

Competing interests: M.C. and P.S-B. have a patent (EP2016/079464) regarding the hepatic stellate cell differentiation. The remaining authors declare no competing interests.

Figures

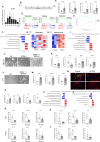
Fig. 1
Fig. 1. Time-resolved proteomic characterization of the iPSCs differentiation to diHSCs shows that the stellate cell phenotype is acquired gradually.
A Schematic representation of the experimental design used to characterize the differentiation process of iPSCs into diHSCs (differentiated hepatic stellate cells) at the proteome level, with a comparison to primary human HSCs. This characterization was performed in four independent differentiations and 4 primary HSCs. Created in https://BioRender.com. B Chord diagram illustrating the enriched Gene Ontologies (GOs) at day 0 and day 12 of the differentiation protocol, alongside a volcano plot showing differentially expressed proteins between these two timepoints. C Immunoflourescence images at day 0 and day 12, showing the expression of LUM and OCT4. Scale bars: 200 µm for day 0, and 100 µm for day 12. D Gene Set Enrichment Analysis (GSEA) of proteomic signatures from different human liver cell types, including LSEC (Liver Sinusoidal Endothelial Cells), KC (Kupffer Cells), HSC (Hepatic Stellate Cells), and HEP (Hepatocytes) obtained from Ölander, M. et al.. E–I Protein expression profiles of the five identified clusters during differentiation. The time points are labeled as D0 (day 0), D2 (day 2), D4 (day 4), D6 (day 6), D8 (day 8), D10 (day 10), and D12 (day 12). J Venn diagram showing the overlap in proteome profiles between primary HSCs and diHSCs, highlighting the most highly expressed proteins in each cell type including EHD2, TIMP3, THY1, TIMP1, MYL9 and FBLN2 for pHSCs; HDAC2, SET, NASP, FUBP1, MCM3 and MCM4 for diHSCs and as common proteins FSTL1, MMP14, SFRP2, PALLD, LOXL2 and RAB13. (K-M) diHSCs exhibit pathways related to both quiescent and activated phenotypes, as well as key stellate cell pathways identified from the literature (Zhang et al.).
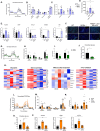
Fig. 2
Fig. 2. Proteome trajectory analysis of diHSCs differentiation discovers three stages of maturation and identifies RORA as a potential driver of stellate cell differentiation.
A Principal component analysis (PCA) of the proteome during differentiation reveals a time-dependent separation of data, indicating distinct stages of the differentiation process. B Pearson correlation analysis identifies three phases of differentiation towards diHSCs: Phase 1 from day 0 (D0) to day 4 (D4), Phase 2 from day 4 (D4) to day 8 (D8), and the final maturation phase (Phase 3) from day 8 (D8) to day 12 (D12). C Dot plot showing protein enrichment throughout the differentiation process. In Phase 1 (D0 to D4), pluripotency and mesoderm markers (POU5F1, RIF1, MFGE8, CALB1) are enriched. During Phase 2 (D4 to D8), mesenchymal and mesothelial proteins, along with fetal HSC markers (VIM, PEF1, KRT18, FN1, FBLN1, COL6A3, CGN, ANXA6, ALCAM), begin to dominate. Finally, in Phase 3 (D8 to D12), markers of mature HSCs are enriched (VCAN, PTN, NES, MMP2, MMP14, LAMA5, FLNC, FBLN2, DES, DCN, COL4A1, COL3A1, COL1A2, COL1A1, ACTA2). D Volcano plot comparing phases 1 and 2 highlights the enrichment of mesothelial markers (DESP, DSG2, PRDX4, WLS) and transcription factors (TFs) predicted in silico to regulate this transition. E Volcano Plot showing the comparison between phases 2 and 3 shows an increase in collagen and extracellular matrix (ECM) proteins (COL5A1, LUM, TNC, TGFBI, NID2), along with predicted TFs modulating this transition. F Volcano plot displaying the differentially expressed proteins between phase 3 (diHSCs) and primary HSCs, as well as the in silico predicted TFs involved in regulating the adult hepatic stellate cell phenotype. G Transcriptomic comparison of primary human activated and quiescent stellate cells with diHSCs, focusing on the predicted TFs modulating the adult stellate cell phenotype, using data from GSE90525 and GSE67664. Fold change (FC) between diHSCs vs. qHSCs = 3.20; FC diHSCs vs. aHSCs =1.60 for RORA expression.
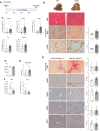
Fig. 3
Fig. 3. RAR-related orphan receptor A is a potential driver of the diHSCs phenotype by improving mesoderm commitment and modulating diHSCs activation state.
A RORA gene expression during diHSC differentiation compared to primary HSCs (pHSCs). Data represent three independent differentiations and three pHSC samples. Significant differences are indicated as *p < 0.05. B Schematic of the experimental design for SR1078 treatment during differentiation. Cells were treated with the RORA agonist SR1078 (0.1 mM) from day 2 onwards. C Gene expression analysis of key HSC markers (PCDH7, LRAT, LHX2, RELN) in three independent differentiations treated with SR1078 compared to the vehicle control. D GSEAs of reported gene signatures for quiescent, pan- and activated stellate cells. Obtained from Zhang et al.. E Principal Component Analysis (PCA) showing transcriptomic differences between cells treated with the RORA agonist SR1078 from day 2 compared to the untreated group, n = 3. F GOs upregulated (red) and downregulated (blue) in cells treated with the RORA agonist. G Heatmap of mesoderm markers in treated and untreated cells along differentiation with SR1078. H Heatmap of mesenchymal markers in treated and untreated cells along differentiation with SR1078. I Reactome pathways upregulated (red) and downregulated (blue) in cells treated with the RORA agonist. J Representative microscopy images of diHSCs from WT, iPSC- RORA+/- and treated iPSC- RORA+/- with the RORA agonist (SR1078) at day 12. Scale bars represent 100 μm. K Gene expression of stellate cell markers (LRAT, LHX2, RELN and ACTA2) of WT and treated iPSC- RORA+/- with the RORA agonist (SR1078) at day 12. n = 3 independent differentiations with two replicates. L Representative microscopy images of passaged (P1) diHSCs from WT and iPSC- RORA+/- SR1078 treated. Scale bar represents 100 μm. M Gene expression of activated stellate cell markers (ACTA2, COL1A1 and LOX). n = 3 independent differentiations with two replicates. N Immunoflourescence images for COLLAGEN and aSMA in WT passaged cells treated and untreated with RORA agonist SR1078 for 24 h. Scale bars represent 100 μm. O Gene expression of quiescent (LRAT and LHX2) and activated (ACTA2 and COL1A1) markers in cells treated with the RORA agonist at passage. n = 3 independent differentiations with two replicates. P GOs upregulated (red) and downregulated (blue) in treated cells with the RORA agonist at passage. Q Reactome pathways upregulated (red) and downregulated (blue) in cells treated with the RORA agonist at passage. R Gene expression of activated (markers in cells treated with the RORA agonist at passage, after TGFβ stimulation (10 ng/μL) during 24 h and 7 days. n = 3 independent passaged cells with two replicates. S Gene expression of activated markers (ACTA2, COL1A1 and LOX) in liver spheroids after SR1078 3 mM treatment during 24 h. n = 3; Significant differences are indicated as *p < 0.05. T Gene expression of activated markers (ACTA2, COL1A1 and LOX) in liver spheroids after TGFβ stimuli during 24 h and SR1078 3 mM treatment during 24 h more. n = 3 independent spheroids experiments with 10 biological pool replicates each; All data is presented as mean ± SEM, no significance or * p < 0.05, **p < 0.01 was determined by One sample t and Wilcoxon test.
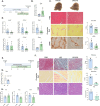
Fig. 4
Fig. 4. RORA regulates cell metabolism during mesodermal differentiation and diHSCs activation.
A Oxygen consumption rate (OCR) on day 4 WT control iPSC and iPSC RORA+/- treated and untreated from day 2. n = 3 independent. (B) OCR parameters of day 4 iPSC WT and iPSC RORA+/- treated and untreated from day 2. n = 3 independent differentiations. C Normalized adenosine triphosphate (ATP) production from OXPHOS and glycolysis of day 4 WT iPSCs and iPSC-RORA+/- treated and untreated from day 2. n = 3 independent differentiations. D Glucose consumption at day 4 of WT iPSC and iPSC RORA+/- differentiations treated and untreated from day 2. n = 3 independent differentiations. E Gene expression of key glycolytic and lipid synthesis markers (ALDOB, GS6P, ACACA) and mesoderm and mesenchymal markers (EOMES and VIM). n = 3 independent differentiations. F Immunofluorescence of mesoderm (EOMES) and mesenchymal (VIM) on day 4 of differentiated cells from WT, RORA+/- and RORA+/- treated with the RORA agonist from day 2. Scale bars represent 100 μm. G OCR passaged diHSCs treated with the RORA agonist for 24 h. n = 3 independent. H OCR parameters of passaged diHSCs treated with the RORA agonist for 24 h. n = 3 independent experiments. I Normalized ATP production from OXPHOS and glycolysis of passaged cells treated and untreated with RORA agonist for 24 h. n = 3 independent differentiations. J Glucose consumption at passaged cells treated and untreated with RORA agonist for 24 h. n = 3 independent experiments. K Heatmap of glycolytic, sterol synthesis, mitochondrial respiration and fatty acid beta-oxidation of passaged cells treated and untreated cells with RORA agonist for 24 h. n = 3 independent experiments. L OCR of passaged cells treated with TGFβ 10 ng/mL for 24 h and rescued with RORA agonist treatment for 24 h more. n = 3 independent passaged cells. M OCR parameters of passaged cells treated with TGFβ 10 ng/mL for 24 h and rescued with RORA agonist treatment for 24 h more. n = 3 independent experiments. N Normalized ATP production from OXPHOS and glycolysis of TGFβ activation model rescued with the RORA agonist for 24 h. n = 3 independent experiments. O Intracellular glucose levels of TGFβ activation model rescued with the RORA agonist for 24 h. n = 3 independent differentiations. P Gene expression of key glycolytic and lipid synthesis markers (ALDOB, GS6P and ACACA) of the TGFβ activation model rescued with the RORA agonist for 24 h. n = 3 independent differentiations; All data is presented as mean ± SEM, no significance or * p < 0.05, **p < 0.01 was determined by One sample t and Wilcoxon test in one two one comparisons and ANOVA 1-way test was performed in the comparison of three experimental groups.
Fig. 5
Fig. 5. RORA controls the activation of HSCs and contributes to the development of liver fibrosis.
A Schematic overview of a CCl4 fibrotic liver model in staggerer mice. (B) Representative images of the livers in 7 staggerer (sg/sg) and 7 WT mice after 4 weeks of CCl4 treatment, H&E staining and picrosirius staining for the staggerer and wildtype (WT) counterparts and immunohistochemistry of αSMA. Scale bars represent 100 μm. C Gene expression of fibrogenic and HSCs activation markers (Acta2, Col1a1, Timp1, Fn1 and Col1a2) in 7 sg/sg and 7 WT mice after CCl4 treatment. Significant differences are indicated as *p < 0.05. D Liver/body ratio of 5 Lrat-Cre-/Rora wt/fl (Cre-) mice vs 5 Lrat-Cre + /Rora wt/fl (Cre + ) after 4 weeks of CCl4 I.P. injections. E Hydroxyproline content of the livers of 5 Cre- and 5 Cre+ mice after 4 weeks of CCl4 I.P. injections. F Gene expression of Rora and Lhx2 in 5 Cre- and 5 Cre+ after 4 weeks of CCl4 I.P. injections. G Representative images of the livers of the five Cre- and five Cre+ mice after 4 weeks of CCl4 I.P. injections of picrosirius staining, immunohistochemistry of αSMA, MKi67, F4/80 and Mpo. Scale bars represent 200 μm. All data is presented as mean ± SEM, no significance or * p < 0.05, **p < 0.01 was determined by One sample t and Wilcoxon test.
Fig. 6
Fig. 6. diHSCs trajectory analysis is a reliable technique for finding anti-fibrogenic targets.
A Illustration of the experimental design of a CCl4 model treated with SR1078. B RORA gene expression of CCl4 model treated with SR1078; n = 14. C Representative images of the livers after 4 weeks of CCl4 I.P. injections and SR1078 for the last two, H&E staining and Picrosirius staining for the untreated (Vehicle) and treated (SR1078) group and immunohistochemistry of αSMA. Scale bars represent 100 μm. D Gene expression of fibrogenic and HSCs activation markers in 7 untreated (Vehicle) and 7 treated (SR1078) mice (Acta2, Col1a1, Col1a2, Timp1 and Fn1). E Illustration of the experimental design of Isoproterenol cardiac injury model performed in two groups of 5 mice each. F Representative images of the hearts of vehicle (5 mice), isoproterenol (ISO) (5 mice) and ISO and RORA agonist (5 mice) group of Masson’s trichrome, Picrosirius and H&E staining. Scale bars represent 100 μm. G Rora gene expression of 5 vehicle mice and 5 ISO mice group. H Gene expression of Rora and fibrogenic markers (Acta2 and Col3a1) and the hypertrophy marker Acta1 in 5 ISO mice and 5 ISO and RORA agonist mice group. All data is presented as mean ± SEM, no significance or * p < 0.05, **p < 0.01 was determined by One sample t and Wilcoxon test.
Fig. 7
Fig. 7. RORA is downregulated in a cohort of patients with liver disease and is negatively correlated with liver fibrosis.
A Immunoflourescence of RORA in healthy and cirrhotic patients and co-staining of RORA with VIM in healthy and with aSMA in cirrhotic patients. Scale bars represent 100 μm. B Gene expression of RORA in cirrhotic patients is reduced in comparison to healthy group. Six total healthy livers and six cirrhotic livers were. C Expression of RORA is reduced in primary activated HSCs in comparison to quiescent HSCs (GSE90525 & GSE67664). n = 4 samples per condition. D RORA expression correlates negatively with METAVIR fibrosis score in a cohort of liver disease patients; n = 42 (Graupera et al.). Significant differences are indicated as *p < 0.05. E RORA expression correlates negatively with FIB4 fibrosis score in a cohort of liver disease patients; n = 42 (Graupera et al.). F RORA correlates negatively with HSCs activation markers and fibrosis markers (ACTA2, COL1A1, LOXL1, COL1A1, TIMP1, VEGFC and TAGLN) in a cohort of liver disease patients (Graupera et al.). Gene expression data is presented as mean ± SEM, no significance or * p < 0.05, **p < 0.01 was determined by One sample t and Wilcoxon test. Correlation analysis data was performed using pearson correlation analysis.

References

    1. Weterings, S. D. C., van Oostrom, M. J. & Sonnen, K. F. Building bridges between fields: bringing together development and homeostasis. Development148, dev193268 (2021). - PMC - PubMed
    1. Asahina, K. et al. Mesenchymal origin of hepatic stellate cells, submesothelial cells, and perivascular mesenchymal cells during mouse liver development. Hepatology49, 998–1011 (2009). - PMC - PubMed
    1. Asahina, K., Zhou, B., Pu, W. T. & Tsukamoto, H. Septum transversum-derived mesothelium gives rise to hepatic stellate cells and perivascular mesenchymal cells in developing mouse liver. Hepatology53, 983–995 (2011). - PMC - PubMed
    1. Zhao, X., Kwan, J. Y., Yip, K., Liu, P. P. & Liu, F.-F. Targeting metabolic dysregulation for fibrosis therapy. Nat. Rev. Drug Discov.19, 57–75 (2019). - PubMed
    1. Taylor, R. S. et al. Association between fibrosis stage and outcomes of patients with nonalcoholic fatty liver disease: a systematic review and meta-analysis. Gastroenterology158, 1611–1625.e12 (2020). - PubMed

LinkOut - more resources