. 2025 Feb 10;16(1):1497.
doi: 10.1038/s41467-025-56670-8.

Breakage fusion bridge cycles drive high oncogene number with moderate intratumoural heterogeneity

Affiliations

Breakage fusion bridge cycles drive high oncogene number with moderate intratumoural heterogeneity

Siavash Raeisi Dehkordi et al. Nat Commun. .

Abstract

Oncogene amplification is a key driver of cancer pathogenesis. Both breakage fusion bridge (BFB) cycles and extrachromosomal DNA (ecDNA) can lead to high oncogene copy numbers, but the impact of BFB amplifications on intratumoral heterogeneity, treatment response, and patient survival remains poorly understood due to detection challenges with DNA sequencing. We introduce an algorithm, OM2BFB, designed to detect and reconstruct BFB amplifications using optical genome mapping (OGM). OM2BFB demonstrates high precision (>93%) and recall (92%) in identifying BFB amplifications across cancer cell lines, patient-derived xenograft models, and primary tumors. Comparisons using OGM reveal that BFB detection with our AmpliconSuite toolkit for short-read sequencing also achieves high precision, though with reduced sensitivity. We identify 371 BFB events through whole genome sequencing of 2557 primary tumors and cancer cell lines. BFB amplifications are prevalent in cervical, head and neck, lung, and esophageal cancers, but rare in brain cancers. Genes amplified through BFB exhibit lower expression variance, with limited potential for regulatory adaptation compared to ecDNA-amplified genes. Tumors with BFB amplifications (BFB(+)) show reduced structural heterogeneity in amplicons and delayed resistance onset relative to ecDNA(+) tumors. These findings highlight ecDNA and BFB amplifications as distinct oncogene amplification mechanisms with differing biological characteristics, suggesting distinct avenues for therapeutic intervention.


Conflict of interest statement

Competing interests: V.B. is a co-founder, consultant, SAB member and has equity interest in Boundless Bio and Abterra, and the terms of this arrangement have been reviewed and approved by the University of California, San Diego in accordance with its conflict of interest policies. P.S.M. is a co-founder, chairs the scientific advisory board (SAB) of and has equity interest in Boundless Bio. P.S.M. is also an advisor with equity for Asteroid Therapeutics and is an advisor to Sage Therapeutics. H.Y.C. is a co-founder of Accent Therapeutics, Boundless Bio, Cartography Bio, and Orbital Therapeutics, and is an advisor to 10X Genomics, Arsenal Biosciences, Chroma Medicine, and Spring Discovery. J.J.Z. is co-founder and director of Crimson Biopharm Inc. and Geode Therapeutics Inc. LBA is a co-founder, CSO, scientific advisory member, and consultant for io9, has equity and receives income. The terms of this arrangement have been reviewed and approved by the University of California, San Diego in accordance with its conflict of interest policies. LBA is a compensated member of the scientific advisory board of Inocras. LBA’s spouse is an employee of Hologic, Inc. LBA declares U.S. provisional applications with serial numbers: 63/289,601; 63/269,033; 63/366,392; 63/412,835 as well as international patent application PCT/US2023/010679. LBA is also an inventor of a US Patent 10,776,718 for source identification by non-negative matrix factorization. K.H. is a former employee of Boundless Bio, Inc. The remaining authors declare no competing interests.

Figures
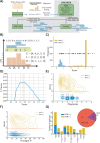
Fig. 1
Fig. 1. Detecting and reconstructing BFB amplicons using Optical Genome Maps.
A Workflow of OM2BFB pipeline depicting the sequential steps involved in the analysis (Methods). B Schematic representation of OM2BFB output. The axes display genomic coordinates (x-axis) and copy-number (CN) (y-axis), with a separate track showing foldbacks. Orange bars represent segments with their respective copy numbers, navy arrows on the yellow background indicate foldback reads, and the blue rectangle on top represents the BFB structure described by an ordering of segment labels. The proposed BFB structure can be read by marking the segments traversed by the blue line, starting from the centromeric end. The vectors, C, L, and R refer to the copy number, left-, and right-foldback SVs that support the BFB. C Distribution of OM2BFB scores for 1198 simulated BFB negative (BFB(-)) cases and 595 simulated positive (BFB(+)) cases. Notably, 809 negative cases did not meet the filtering threshold and were reported with a high score (4) by OM2BFB. Black dots (placed at an arbitrary position on the y-axis for ease of visualization) represent the OM2BFB scores of 84 amplicons obtained from 31 cell lines. The red line at 1.8 marks the threshold from (D) for defining BFB(+) from BFB(-) cases. Source data are provided as a Source Data file. D The F1 scores of OM2BFB, measured for different score cut-offs. The highest F1 score was achieved at a threshold of 1.8, and that score was selected as the threshold for separating BFB (+) from BFB(-) cases. Source data are provided as a Source Data file. E Distribution of OM2BFB scores across the number of segments in the simulated cases. The BFB(+) sample scores are independent of the number of segments, while BFB(-) samples reveal a slight bias of decreasing scores with higher number of segments. Source data are provided as a Source Data file. F Distribution of OM2BFB scores across the average segments’ copy numbers in the simulated cases shows independence between the score and average copy number. Source data are provided as a Source Data file. G (Right) Distribution of OGM data types from 31 samples that include cancer cell lines, PDX models, and primary tumours (PT). (Left) Distribution of BFB(+) and BFB(-) cases across different cancer subtypes. Source data are provided as a Source Data file.
Fig. 2
Fig. 2. Cytogenetic evidence for BFB and validation.
A Metaphase FISH image for the cancer cell line THP1, showcasing amplification on a native chromosome (chr1) with a score below 1.8 (N = 11). CEN1 is a probe for the centromere on chr1. B Metaphase FISH image for the cancer cell line HARA, displaying amplification on a native chromosome arm (chr11p) and also co-occurrence of HARA and CCND1 on the q-arm, suggesting a duplicated translocation of the BFB site from the p arm to the q arm (N = 24). C Metaphase FISH image for the cancer cell line H460, demonstrating amplification on both native (chr 8) and non-native (chr 11) chromosomes with scores exceeding 1.8 (N = 32). D Visualization of HSR (homogeneously staining region) amplification on chr 8 (MYC) integrated in chr 11 in the H460 cell line. Blue arrows represent foldback reads within the structure. E Metaphase and Interphase FISH images for the cancer cell line HCC827, exhibiting amplification on a native chromosome with a score below 1.8. F Distribution of FISH Foci Count among cases with Interphase FISH images, highlighting lower number of foci and also lower variance in the number of foci in BFB and HSR cases compared to ecDNA cases. Center lines indicate the median, boxes represent the interquartile range (IQR) from the 25th to the 75th percentile, whiskers extend to the minimum and maximum values within 1.5 times the IQR. Source data are provided as a Source Data file. G Visualization of EGFR foci in interphase cells from HN137Pri and HN137Met lines. The top panel shows the original FISH image, while the bottom panel shows the computationally detected foci. H Summary of cytogenetic validation of OM2BFB calls. The number in parentheses refers to the number of interphase samples. This table includes n = 22 samples with available FISH data.
Fig. 3
Fig. 3. The landscape of BFB amplifications in tumor samples.
A Summary of the number of BFB(+) samples among 2113 whole genome samples tested for BFB amplification using AmpliconSuite. The data was collected from three data sets: TCGA, BE and CCLE. B Locations of the first (most telomeric) break of the 371 BFBs in the human genome (hg38). Chromosomes with fewer than 12 BFBs are not shown. Source data are provided as a Source Data file. C The distribution of BFB occurrences (most telomeric break) in 5 Mbp windows compared against the Poisson distribution to test for randomness (two-tailed KS test, p-value = 3.7e-19, test statistic = 0.17). Source data are provided as a Source Data file. D The randomness of the first break in a 10 Mb region, telomeric to an amplified oncogene. Left panel: 29 BFBs on chr11 containing CCND1; Right panel: 30 BFBs on chr17 (ERBB2). P-values from BFB distributions calculated with one-tailed permutation-like test. Source data are provided as a Source Data file. E Distribution and cumulative distribution of the distance (d) between foldback reads. Source data are provided as a Source Data file. F Frequencies of the mode of amplification (BFB versus ecDNA) in oncogenes that are amplified at least 8 times in all datasets combined. Source data are provided as a Source Data file. G Violin plot showing the distributions of the maximum oncogene copy number between BFB (n = 350) and ecDNA (n = 677) amplicons (two-tailed Rank-Sum test, p-value = 0.176, test statistic = −0.93). Box plots within each violin indicate the median (center line), interquartile range (IQR) from the 25th to the 75th percentile (bounds of the box), and whiskers extending to the minimum and maximum values within 1.5 times the IQR. Source data are provided as a Source Data file. H Violin plot showing the distributions of amplicon length (SPAN) between BFB (n = 391) and ecDNA (n = 900) amplicons (two-tailed Rank-Sum test, p-value = 3.00e-24, test statistic = −10.09). Box plots within each violin indicate the median (center line), interquartile range (IQR) from the 25th to the 75th percentile (bounds of the box), and whiskers extending to the minimum and maximum values within 1.5 times the IQR. Source data are provided as a Source Data file. I Co-occurrence patterns of amplified oncogenes. Color-coded entry for (i, j) measures the fraction of times genes (i, j) were both amplified when either gene was amplified. The lower triangle shows ecDNA co-occurrence patterns and the upper triangle shows BFB co-occurrence patterns. Source data are provided as a Source Data file. J Distribution of BFB amplicons over different cancer subtypes. BFB amplicons were not found in brain and CNS related cancers, but were most abundant in lung and head and neck cancers. Source data are provided as a Source Data file.
Fig. 4
Fig. 4. Structural and functional properties of BFB amplifications.
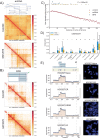
A Top: The structure of the MYC-amplified ecDNA from the COLO320DM cell line. Blue arrows indicate genomic segments from chr 8 amplified on the ecDNA; black dashed lines indicate SV breakpoints directly connecting two remote genomic segments; gray dashed lines indicate templated insertions of segments involving other chromosomes. Middle: Normalized HiChIP contact map of COLO320DM at the ecDNA locus. Colors indicate normalized contact frequencies from the most intensive (red) to the least intensive (yellow). Blue spots indicate significant chromatin interactions identified by NeoLoopFinder; while black spots indicate “neoloops” proximal to SV breakpoints and likely to be formed due to the genomic segments coming together in the cell line. Bottom: Normalized HiChIP contact map of GM12878 at the identical chr8 locus. Blue spots indicate significant chromatin interactions. Source data are provided as a Source Data file. B Top: The inferred structure of the BFB-like focal amplification from the COLO320DM cell line. Middle: Normalized HiChIP contact map of COLO320DM at the BFB locus. Colors indicate normalized contact frequencies from the most intensive (red) to the least intensive (yellow). Blue spots indicate significant chromatin interactions identified by NeoLoopFinder. Bottom: Normalized HiChIP contact map of GM12878 at the identical chr1 locus. Blue spots indicate significant chromatin interactions. Source data are provided as a Source Data file. C Distribution of HiChIP interaction frequencies in ecDNA and BFB-driven amplifications. For a specific genomic distance d (x-axis), the dot represents the fraction, among all pairs of genomic windows separated by d, of pairs with significant HiChIP interactions (2D Two-Sample Kolmogorov-Smirnov Test, p-value = 5.95e-05, test statistic = 0.728). Source data are provided as a Source Data file. D Differences in immune cell subtype compositions in BFB(+) cancers (n = 76) versus ecDNA(+) cancers (n = 297). (*p < 0.05; **p < 0.01; ***p < 0.001). Center lines indicate the median, boxes represent the interquartile range (IQR) from the 25th to the 75th percentile, whiskers extend to the minimum and maximum values within 1.5 times the IQR. P-values were calculated using a two-tailed rank-sum test. Exact p-values and statistics are provided in Supplementary Data 8. Source data are provided as a Source Data file. E Targeted Therapy Resistance of the HCC827 Cell Line continuing EGFR amplified within a BFB event. The top panel shows the BFB architecture in the HCC827 naive cell line along with metaphase FISH images (N = 17). Resistance formation to Erlotinib (ER) maintains the BFB amplicon structure, but the bulk copy number is highly reduced (N = 30). The copy number and the proportion of cells carrying the BFB signal are restored after drug removal (ERDR) (N = 6). No changes were observed in the BFB amplification in Lapatinib drug resistant (LR) line (N = 15). Scale bars in the fluorescent images represent 10 micrometers (µm).
Fig. 5
Fig. 5. Genome instability in BFB amplified genomes.
A Survival outcomes in the first 1000 days (d) for patients with BFB(+) but no ecDNA amplifications (n = 50) in their tumours compared to outcomes for ecDNA(+) patients (n = 171) show significant difference (two-tailed Log-rank test, p-value = 0.02, test statistic = 5.05). For comparisons, the survival outcome for patients (n = 600) with no amplification is also plotted. Error bands represent 95% confidence intervals for the survival probabilities. Patients with survival times exceeding 1000 days were excluded from this analysis. Source data are provided as a Source Data file. B Maximum copy number and amplicon complexity scores for BFB amplicons sampled from Barrett’s esophagus (non-EAC) compared to esophageal adenocarcinoma (EAC) patients. Center lines indicate the median, boxes represent the interquartile range (IQR) from the 25th to the 75th percentile, whiskers extend to the minimum and maximum values within 1.5 times the IQR. Source data are provided as a Source Data file.

Update of

References

    1. Davoli, T., Uno, H., Wooten, E. C. & Elledge, S. J. Tumor aneuploidy correlates with markers of immune evasion and with reduced response to immunotherapy. Science355, eaaf8399 (2017). - PMC - PubMed
    1. Krijgsman, O., Carvalho, B., Meijer, G. A., Steenbergen, R. D. M. & Ylstra, B. Focal chromosomal copy number aberrations in cancer—needles in a genome haystack. Biochim. Biophys. Acta BBA Mol. Cell Res.1843, 2698–2704 (2014). - PubMed
    1. Zhao, X.-K. et al. Focal amplifications are associated with chromothripsis events and diverse prognoses in gastric cardia adenocarcinoma. Nat. Commun.12, 6489 (2021). - PMC - PubMed
    1. Turner, K. M. et al. Extrachromosomal oncogene amplification drives tumour evolution and genetic heterogeneity. Nature543, 122–125 (2017). - PMC - PubMed
    1. Kim, H. et al. Extrachromosomal DNA is associated with oncogene amplification and poor outcome across multiple cancers. Nat. Genet.52, 891–897 (2020). - PMC - PubMed