. 2025 Feb 10;16(1):1488.
doi: 10.1038/s41467-025-56742-9.

Intercellular bridges are essential for transposon repression and meiosis in the male germline

Affiliations

Intercellular bridges are essential for transposon repression and meiosis in the male germline

Julia Sorkin et al. Nat Commun. .

Abstract

Germ cell connectivity via intercellular bridges is a widely conserved feature across metazoans. However, its functional significance is poorly understood. Intercellular bridges are essential for fertility in male mice as genetic ablation of a critical bridge component, TEX14, causes spermatogenic failure, but the underlying reasons are unknown. Here we utilized a Tex14 hypomorph with reduced intercellular bridges along with Tex14-null mice that completely lack bridges to examine the roles of germ cell connectivity during spermatogenesis. We report that in males deficient for TEX14 and intercellular bridges, germ cells fail to complete meiotic DNA replication, synapsis and meiotic double-strand break repair. They also derepress retrotransposons and accumulate retrotransposon-encoded proteins during meiosis. Single-cell RNA-sequencing confirms sharing of transcripts between wild-type spermatids and demonstrates its partial attenuation in Tex14 hypomorphs, indicating that intercellular bridges enable cytoplasmic exchange between connected germ cells in testes. Our findings suggest that regulation of meiosis is non-cell-intrinsic and inform a model in which intercellular bridges influence critical meiotic events and protect germline genome integrity during spermatogenesis.


Conflict of interest statement

Competing interests: The authors declare no competing interests.

Figures
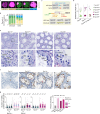
Fig. 1
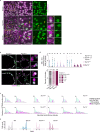
Fig. 1. Males from the ENU-induced mutant line Tex14m display abnormal meiosis.
a Representative images of squashed spermatocyte preparations immunostained for SYCP3 and γH2AX. Cells were staged based on SYCP3-staining patterns: short stretches of SYCP3-positive axes develop during leptotene, elaborate into contiguous structures throughout zygotene, contiguous SYCP3-positive structures appear thicker as autosomes fully synapse during pachytene, and subsequently thinner as they desynapse during diplotene. An example of a cell with abnormal staining (nucleus-wide γH2AX along with late prophase-like tracks of SYCP3) is also shown. b Distribution of meiotic prophase stages in three tama mutants and their phenotypically wild-type littermates. c The tama and knockout alleles of Tex14. d The ratios of testes weight to body weight for 6.5- to 29.5-week-old mice. e PAS-stained sections of Bouin’s-fixed testes from 7.5- to 21-week-old Tex14m/m, Tex14-/- and Tex14m/- males along with a wild-type littermate. Zoomed-in views of the regions indicated with boxes are shown below and Sertoli cells (Sertoli), spermatogonia (Spg), spermatocytes (Spc), round spermatids (rSt) and elongated spermatids (eSt) are indicated. Two or more mice were examined for each genotype. f Representative images of TUNEL assay on adult testis sections. Red arrowheads point to TUNEL-positive cells (stained dark brown). g Quantitation of TUNEL assay. The numbers of TUNEL-positive cells counted in individual tubule sections are shown on the left. Blue horizontal lines indicate means; bars indicate standard deviations. Proportions of tubules containing varying ranges of TUNEL-positive cells are shown on the right. Mean values across mice are plotted; red bars indicate standard deviations. Source data are provided as a Source Data file.
Fig. 2
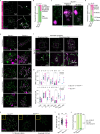
Fig. 2. Tex14m is a hypomorphic allele of Tex14.
a Western blot analysis of TEX14 and VINCULIN (loading control) in testis extracts from 10-dpp animals. Relative TEX14 signal intensities normalized to VINCULIN are indicated below. Two mice were examined for each genotype. b TEX14 immunofluorescence on whole-mounted seminiferous tubules rendered in 3D. Higher magnification views of the regions indicated with white boxes are shown on the right. Two Tex14+/+ and three Tex14m/m mice were examined. c Immunofluorescence of TEX14 and MKLP1 on adult testis sections. Spermatocytes (Sc), elongating spermatids (eSt), and round spermatids (rSt) are indicated. TEX14 and MKLP1 staining is highlighted with yellow, dashed circles. Higher magnification views of TEX14 and MKLP1 colocalization are shown in insets. One Tex14m/m and two Tex14-/- mice along with control littermates were examined. d Electron micrograph of intercellular bridges in testis sections. Cell boundaries are depicted with red, dashed lines, intercellular bridges are indicated with yellow, dashed boxes. A higher magnification view of intercellular bridges is shown on the right and yellow arrows point to the electron-dense lining of intercellular bridges. Two mice were examined for each genotype. Source data are provided as a Source Data file.
Fig. 3
Fig. 3. Tex14 mutants have a defect during meiotic prophase entry.
a Representative images of PLZF-stained testis sections along with quantitation of the number of positive-staining cells. b cKIT-stained testis sections along with quantitation of cKIT-positive and SYCP3-negative cells. c STRA8-stained testis sections along with quantitation of STRA8-positive cells. d SYCP3- and γH2AX-stained testis sections along with quantitation of early prophase (leptotene and zygotene) cells. Early prophase cells were identified based on SYCP3- and γH2AX-staining patterns. The numbers of positive-staining cells counted in individual tubule sections are shown in dot plots. Blue horizontal lines indicate means; bars indicate standard deviations. Proportions of tubules counted that contain varying ranges of positive-staining cells are shown in stacked bar plots. Mean values across mice are plotted; red bars indicate standard deviations. Source data are provided as a Source Data file.
Fig. 4
Fig. 4. Tex14 is required for meiotic DNA replication.
a STRA8 and EdU immunostaining on whole-mounted seminiferous tubules. Zoomed-in views of the regions indicated with yellow boxes are shown on the right and STRA8-positive EdU-negative cells are annotated (yellow arrows) and depicted on the far right. Two mice were examined for each genotype. b Immunofluorescence of STRA8 and EdU on testis sections. Higher magnification views of the regions indicated with white boxes are shown on the right. Three Tex14m/m and three Tex14-/- mice along with control littermates were examined. c Quantitation of the numbers of STRA8-positive EdU-negative (pink) and STRA8- EdU-double-positive (aqua) cells within tubule sections. Graphs represent individual mice and vertical bars represent individual tubules in a testis section. d Quantitation of STRA8- EdU-double-positive cells. The numbers of STRA8- EdU-double-positive cells counted in individual tubule sections that contain at least one STRA8-positive cell are shown in the dot plot above. Blue horizontal lines indicate means; bars indicate standard deviations. Proportions of tubules counted that contain varying ranges of double-positive cells are shown in the bar plot below. Mean values across mice are plotted; red bars indicate standard deviations. e Histograms of nuclei count as a function of the intensity of DAPI in STRA8-positive DMRT1-negative spermatocytes. Two mice were examined for each genotype. Source data are provided as a Source Data file.
Fig. 5
Fig. 5. Tex14 deficiency leads to defects in synapsis and meiotic recombination.
a Chromosome spreads of pachytene-stage cells from Tex14m/m immunostained for SYCP3 and SYCP1 depicting illegitimate synapsis or asynapsis. Higher-magnification views of the boxed regions are shown on the right and chromosomes displaying asynapsis (above) and illegitimate synapsis (below) are annotated (white arrowheads). b Quantitation of synapsis in autosomes. Cells containing chromosome tangles with a mix of synapsed and asynapsed axes with partner switches indicative of nonhomologous synapsis are categorized as illegitimate synapsis. Three mice were examined for each genotype. c Chromosome spreads of pachytene-stage cells from Tex14m/m immunostained for SYCP3 and γH2AX depicting normal staining (left), large patches of γH2AX (middle), and γH2AX flares on autosomes (right). d Quantitation of γH2AX staining patterns. Three mice were examined for each genotype. e Chromosome spreads immunostained for SYCP3 and DMC1. Time course of meiotic prophase stages is shown. Four Tex14m/m along with control littermates were examined. f Representative images of SYCP3- and DMC1-stained cells with aberrant synapsis. Aberrant cells include zygotene-like and pachytene-like cells with chromosome tangles and pachytene-like cells with autosomal asynapsis. Higher-magnification views of the boxed regions marking abnormal synapsis are depicted at the bottom and synapsis abnormalities are annotated (white arrowheads). g Quantitation of DMC1 (n = 4 mutants and control littermates) and RAD51 (n = 3 mutants and control littermates) foci during meiotic progression. Foci overlapping with SYCP3-positive axes were scored and cells were staged based on SYCP3-staining patterns: leptotene (Lept.), early zygotene (E. zyg.), mid zygotene (M. zyg.), late zygotene (L. zyg.), pachytene (Pach.), aberrant zygotene-like (Zyg.-like), aberrant pachytene-like (Pach.-like). h SYCP3- and MLH1-stained pachytene-stage cells showing chromosomes with wild-type-like foci counts (1-2 foci) and abnormal MLH1 foci counts (0 foci). Higher magnification views of single chromosomes are shown in insets. Four Tex14m/m along with control littermates were examined. i Quantification of MLH1 foci (n = 4 mutants and control littermates) on autosomes and sex chromosomes in pachytene cells. j Proportions of autosomes with 0, 1-2, or ≥3 MLH1 foci (n = 4 mutants and control littermates). Blue horizontal lines indicate means; bars indicate standard deviations. Quadruple-asterisk represents p < 0.0001, triple-asterisk represents p < 0.001, double-asterisk represents p < 0.01, and a single-asterisk represents p < 0.05 in two-sided Mann-Whitney U-tests. Exact p values: g DMC1 Lept. p = 0.132, E. zyg. p = 0.191, M. zyg. p = 0.003, L. zyg. p = 0.094, Pach. p = 4.52E-7; RAD51 Lept. p = 0.073, E. zyg. p = 0.159, M. zyg. p = 5E-4, L. zyg. p = 0.368, Pach. p = 8.47E-6. (i) MLH1 p = 0.004. Source data are provided as a Source Data file.
Fig. 6
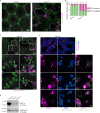
Fig. 6. Tex14m/m mutants exhibit transposon derepression in the male germline.
a SYCP3 and ORF1p immunofluorescence on testis sections. Tubules with numerous bright ORF1p-positive cells are indicated with white arrows. Three mice were examined for each genotype. b Distribution of ORF1p-positive tubules. c Tubules indicated in a with higher magnification views of boxed regions at the bottom. Cells were staged based on SYCP3-staining patterns: leptotene (L), zygotene (Z), pachytene (P), diplotene (D). d. Three Tex14m/m mice were examined. d ORF1p and VINCULIN (loading control) immunoblot in testis extracts from 13-week-old mice. Two Tex14m/m and three control littermates were examined. e L1Mda_l_5end RNA FISH with ORF1p immunostaining on testis sections. Higher magnification views of regions indicated with white arrowheads are shown below. Examples of colocalization of L1Mda_l_5end RNA and ORF1p are highlighted using white arrowheads. Two Tex14m/m mice were examined. Source data are provided as a Source Data file.
Fig. 7
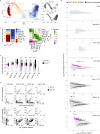
Fig. 7. RNA expression landscape of Tex14m/m mutants.
a All Tex14+/+ and Tex14m/m germ cells were positioned by batch-corrected principal component (PC) 1 and PC3. Cells are colored by their cell identity and follow the expected developmental trajectory from right to left. Spg, spermatogonia; Spg/Pre-L, spermatogonia and preleptotene cells; Early Spc, early spermatocytes; Late Spc, late spermatocytes; Early R. Sp, early round spermatids; Mid R. Sp, mid-trajectory round spermatids; Late R. Sp, late round spermatids; E. Sp, elongating spermatids. Inset panels on the right show the positions of Tex14+/+ (top) and Tex14m/m (bottom) cells. b Distribution of germ cell identities in Tex14+/+ and Tex14m/m. The height of blocks within each vertical bar corresponds to the proportion of each colored cell identity among germ cells of each genotype. c Heatmap depicting Pearson correlation of normalized pseudo-bulk expression among Tex14+/+ and Tex14m/m germ cell categories. d MA plots showing a comparison of expression of individual genes (black) and TEs (pink/green/orange) between Tex14+/+ and Tex14m/m using pseudo-bulk datasets created for each germ cell category. Pink, long interspersed nuclear element (LINE); green, long terminal repeat (LTR) retrotransposon; orange, short interspersed nuclear element (SINE). Points with high fill color intensity correspond to differentially expressed genes or TEs (FDR ≤ 0.05) and points with low color intensity correspond to non-differentially expressed genes or TEs. Black squares correspond to outlier genes whose expression ratio falls outside the bounds of the plot. e Violin plots showing the distribution of log2 transformed total LINE expression summed across all LINE families within each cell of an assigned germ cell category. Pink points correspond to the mean value for each category. Quadruple-asterisk represents p < 0.0001, triple-asterisk represents p < 0.001, double-asterisk represents p < 0.01, and a single-asterisk represents p < 0.05 in two-sided Wilcoxon tests. Exact p values: Spg p = 0.025, Spg/Pre-L p = 0.311, Early Spc p = 0.114, Late Spc p = 7.15E-26, Early R. Sp P = 8.85E-09, Mid R. Sp p = 1.23E-35, Late R. Sp p = 1.96E-12. f Scatterplots showing the number of X chromosome (Chr X) genes detected in each cell (x-axis) versus Y chromosome (Chr Y; y-axis, top rows) and versus chromosome 9 (Chr 9; y-axis, bottom rows) genes detected for late spermatocytes through late round spermatids (left to right, columns). Source data and results of statistical analyses are provided as a Source Data file.
Fig. 8
Fig. 8. Schematic of meiotic progression upon perturbation of intercellular bridges.
In wild type, meiosis occurs in a syncytium comprised of germ cells interconnected by TEX14-dependent intercellular bridges. Chromosomes are replicated during the preleptotene stage, meiotic breaks are formed and synapsis is initiated during early prophase, breaks are predominantly repaired and synapsis is complete during late meiotic prophase. In Tex14 mutants, intercellular bridges are depleted and germ cells are individualized. Many cells fail to undergo meiotic DNA replication. Cells that replicate form meiotic breaks and initiate synapsis. However, mutant cells fail to complete synapsis and fully repair breaks. Additionally, Tex14 mutants derepress transposons during late prophase, culminating in cell death and infertility.

References

    1. Zickler, D. & Kleckner, N. Meiosis: dances between homologs. Annual review genetics57, 1–63 (2023). - PubMed
    1. Hunter, N. Meiotic Recombination: The Essence of Heredity. Cold Spring Harb Perspect Biol7, 10.1101/cshperspect.a016618 (2015). - PMC - PubMed
    1. Sasaki, M., Lange, J. & Keeney, S. Genome destabilization by homologous recombination in the germ line. Nature reviews. Molecular cell biology11, 182–195 (2010). - PMC - PubMed
    1. Hassold, T. J. & Hunt, P. A. Missed connections: recombination and human aneuploidy. Prenat Diagn41, 584–590 (2021). - PubMed
    1. Garcia-Perez, J. L., Widmann, T. J. & Adams, I. R. The impact of transposable elements on mammalian development. Development143, 4101–4114 (2016). - PMC - PubMed

LinkOut - more resources