. 2025 Mar;10(3):795-807.
doi: 10.1038/s41564-025-01930-y. Epub 2025 Feb 10.

Gut microbiota-derived hexa-acylated lipopolysaccharides enhance cancer immunotherapy responses

Affiliations

Gut microbiota-derived hexa-acylated lipopolysaccharides enhance cancer immunotherapy responses

Puspendu Sardar et al. Nat Microbiol. 2025 Mar.

Abstract

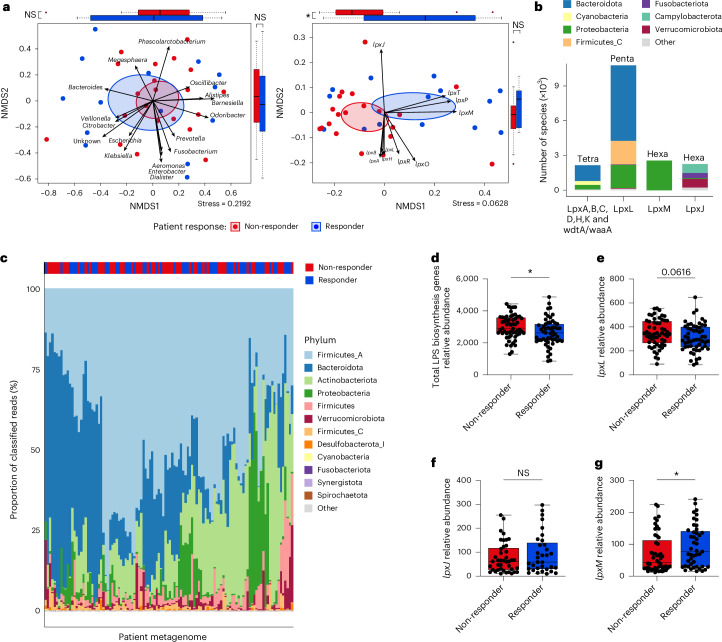
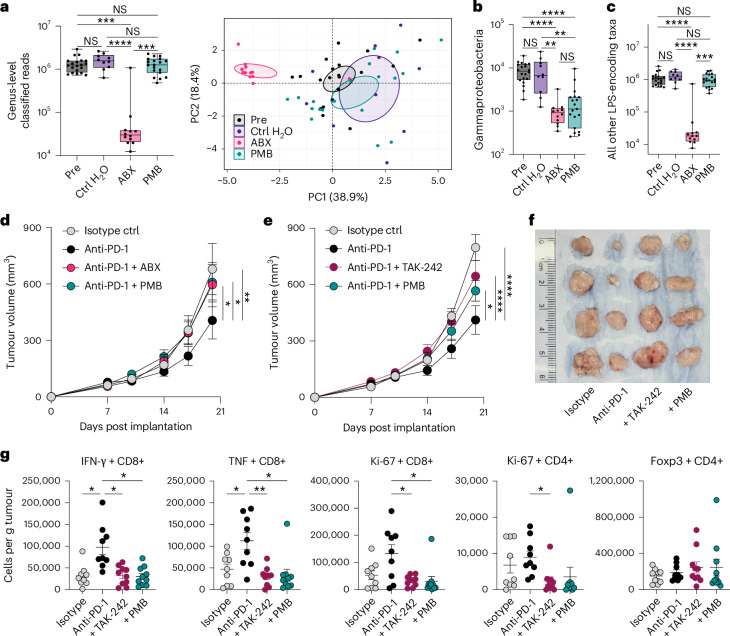
The gut microbiome modulates immunotherapy treatment responses, and this may explain why immune checkpoint inhibitors, such as anti-PD-1, are only effective in some patients. Previous studies correlated lipopolysaccharide (LPS)-producing gut microbes with poorer prognosis; however, LPS from diverse bacterial species can range from immunostimulatory to inhibitory. Here, by functionally analysing faecal metagenomes from 112 patients with melanoma, we found that a subset of LPS-producing bacteria encoding immunostimulatory hexa-acylated LPS was enriched in microbiomes of clinical responders. In an implanted tumour mouse model of anti-PD-1 treatment, microbiota-derived hexa-acylated LPS was required for effective anti-tumour immune responses, and LPS-binding antibiotics and a small-molecule TLR4 antagonist abolished anti-PD-1 efficacy. Conversely, oral administration of hexa-acylated LPS to mice significantly augmented anti-PD-1-mediated anti-tumour immunity. Penta-acylated LPS did not improve anti-PD-1 efficacy in vivo and inhibited hexa-acylated LPS-induced immune activation in vitro. Microbiome hexa-acylated LPS therefore represents an accessible predictor and potential enhancer of immunotherapy responses.


Conflict of interest statement

Competing interests: The authors declare the following competing interests: R.R. holds or has held paid consultancies with Lyell Immunopharma, Achilles Therapeutics and Enhanc3D Genomics and is a principal investigator of research projects funded by AstraZeneca and F-star Therapeutics on unrelated topics that do not constitute competing interests. The other authors declare no competing interests.

Figures

Fig. 1
Fig. 1. Patient responsiveness to anti-PD-1 therapy is associated with microbiome immunostimulatory hexa-acylated LPS.
a, NMDS ordination of patient metagenomes with arrows indicating projected bacterial genera (left) and lpx encoding genes (right; NMDS axis 1 (NMDS1), *P = 0.01447) from patients with melanoma before anti-PD-1 therapy. n = 35. NMDS stress scores were calculated after 1,000 iterations or the best value achieved. Ellipses were drawn with a 95% confidence interval. Boxplots show the distribution of data points (coordinates) within NMDS1 and NMDS axis 2 (NMDS2). b, Taxonomic breakdown of lpx encoding bacteria stacked according to the encoded enzymes for the lipid A tetra-acylated backbone (left) and each level of lipid A acylation as indicated above each stacked bar. c, Phylum-level taxonomic composition of pre-treatment faecal metagenomes from 112 patients with melanoma. The relative abundance of each phylum is given as a proportion of total classified reads, and each phylum is indicated by the fill colour of the stacked bars. dg, Relative abundance as CPM of total LPS biosynthesis genes (*P = 0.0218) (d) and of lpxL (penta-acylation) (e), lpxJ (hexa-acylation) (f) and lpxM (hexa-acylation) (g) genes (*P = 0.0453) within faecal metagenomes of responder (n = 55) and non-responder (n = 57) patients with metastatic melanoma before treatment with anti-PD-1. Two-tailed t-test with data presented as boxes extending from the 25th to 75th percentiles, bars at medians and whiskers from minimum to maximum in a. Two-tailed Mann–Whitney test with data presented as boxes from the 25th to 75th percentiles, bars at median and whiskers from minimum to maximum in dg. NS, not significant. Source data
Fig. 2
Fig. 2. Functional metagenomic analyses indicate elevated hexa-acylated LPS ratios are favourable for patient responses to anti-PD-1 therapy.
a, Functional enterotypes of gut microbiomes of patients with metastatic melanoma illustrated using JSD with PAM clustering and principal coordinate analysis (PCoA). b, Percentage of non-responding (NR) and responding (R) patients within each enterotype (*P = 0.03424). c,d, Relative abundances of total lpx encoding genes as CPM (2 versus 3, *P = 0.03) (c) and lpxM encoding genes within each patient enterotype (1 versus 2, ****P = 4.11 × 10−15; 1 versus 3, *P = 0.02; 2 versus 3, ****P = 1.70 × 10−7) (d). e,f, Total LPS-encoding taxa (*P = 0.0419) (e) and penta-acylated LPS-encoding taxa (**P = 0.0086) (f) as a percentage of classified reads. g, Centre-log ratio normalized relative abundance of lpxJ- and lpxM-encoding genera in patient faecal metagenomes clustered by rows (genera). h,i, Taxa predicted to produce lpxM-mediated (h) or lpxJ- and lpxM-mediated (i) total hexa-acylated LPS as ratios to lpxL-encoding penta-acylated LPS taxa. j, Ratio of lpxM to lpxL genes (*P = 0.0292) based on CPM within faecal metagenomes of patients with metastatic melanoma. k, Relative abundance as GCPM of (from left to right) lpxM, lpxJ (*P = 0.0356), total hexa-acylation (lpxM and lpxJ) (**P = 0.0086) encoding genes and indicated ratios of lpxM and total hexa-acylation encoding taxa (*P = 0.0240) to penta-acylation encoding taxa within faecal metagenomes of patients with RCC before treatment with anti-PD-1. The legend at the top of g also applies to j and k. Patients with metastatic melanoma, n = 112 in aj. Patients with RCC, n = 51 in k. One-tailed two-proportions Z-tests without continuity correction in b. Kruskal–Wallis with post hoc Dunn test and Bonferroni false discovery rate correction with data presented as boxes from the 25th to 75th percentiles, bars at median and whiskers from minimum to maximum in c and d. Two-tailed Mann–Whitney test with data presented as boxes from the 25th to 75th percentiles, bars at median and whiskers from minimum to maximum in e, f and hk. Source data
Fig. 3
Fig. 3. Microbiota-derived hexa-acylated LPS and host TLR4 are required for anti-PD-1-mediated anti-tumour immunity.
Mice were treated with PMB, broad-spectrum antibiotics (ABX) or control drinking water (control (Ctrl) H2O) for 2 weeks. a, Abundance of bacterial taxa measured in mouse faecal metagenomes as the number of classified reads at genus level normalized to faecal weight (left) (Pre versus ABX, ***P = 0.0001; Ctrl H2O versus ABX, ****P < 0.0001; ABX versus PMB, ***P = 0.0002) and principal component analysis of the treatment groups at the phylum level showing the differential effects on the mouse gut microbiota (right). Ellipses were drawn with a 99% confidence interval. b,c, Relative abundance of Gammaproteobacteria (Pre versus ABX, ****P < 0.0001; Pre versus PMB, ****P < 0.0001; Ctrl H2O versus ABX, **P = 0.0010; Ctrl H2O versus PMB, **P = 0.0029) (b) and LPS-encoding non-Gammaproteobacteria (Pre versus ABX, ****P < 0.0001; Ctrl H2O versus ABX, ****P < 0.0001; ABX versus PMB, ***P = 0.0003) (c) in the faecal metagenomes of treated mice shown as the mean of classified reads normalized to faecal weight. Pre, n = 20; Ctrl H2O, n = 10; ABX, n = 12; and PMB, n = 19 mice per group pooled from 2 experimental repeats in ac. d, Indicated mice were pre-treated for 2 weeks with ABX or PMB in their drinking water. MC38 colorectal adenocarcinoma cells were subcutaneously implanted, and tumour growth was measured at serial time points following tumour implantation. Indicated animals were treated with anti-PD-1 i.p. starting at day 10 after tumour implantation (anti-PD-1 versus Isotype ctrl, **P = 0.0054; anti-PD-1 versus Abx mix + anti-PD-1, *P = 0.0478; anti-PD-1 versus PMB + anti-PD-1, *P = 0.0318). Data shown were pooled from 2 experimental repeats with n = 10 mice per group. e, MC38 colorectal adenocarcinoma cells were subcutaneously implanted into PMB pre-treated or untreated mice. Measurements were taken at indicated time points post implantation. Anti-PD-1 was administered i.p. starting at day 10 after tumour implantation, and the TLR4 inhibitor TAK-242 was administered i.p. during anti-PD-1 therapy (anti-PD-1 versus Isotype ctrl, ****P < 0.0001; anti-PD-1 versus PMB + anti-PD-1, *P = 0.0162; anti-PD-1 versus anti-PD-1 + TAK242, ****P < 0.0001). Data shown were pooled from 2 experimental repeats with n = 10 mice per group. f, Representative tumour pictures. g, Representative flow cytometry measurements of indicated T-cell phenotypes from tumours in f (exact P values provided in Source Data Fig. 3). Kruskal–Wallis test comparing all to all with data presented as box from the 25th to 75th percentiles, bars at median and whiskers from minimum to maximum in ac. Two-way ANOVA comparing all to anti-PD-1 in d and e, and Brown–Forsythe with post hoc Dunnett’s test comparing all to anti-PD-1 in g, with bars and error representing mean and s.e.m. Source data
Fig. 4
Fig. 4. Oral administration of hexa-acylated LPS enhances the efficacy of anti-PD-1 therapy.
ad, Wild-type, TLR2−/− or TLR4−/− NF-kB reporter THP-1 (human monocyte/macrophage) cells were incubated with the indicated doses of hexa- or penta-acylated LPS for 24 h. Data are from two biological replicates per concentration of LPS and are representative of at least three experimental replicates. a, NF-kB activation in response to 1 ng ml−1 hexa-acylated LPS or 1 µg ml−1 of penta-acylated LPS (Hexa LPS WT versus TLR4−/−, *P = 0.0274). b, NF-kB activation dose–response with the indicated doses of hexa- or penta-acylated LPS. c, IL-1β (left) and IL-6 (right) secretion by THP-1 cells after 24 h treatment with the indicated doses of LPS, shown as fold increase over media controls. d, NF-kB activation with the indicated combined doses of hexa- and penta-acylated LPS (1 ng Hexa versus +10, +100 and +1,000 ng Penta, ****P < 0.0001). e, MC38 colorectal adenocarcinoma cells were subcutaneously implanted into wild-type mice, and measurements were taken at indicated time points post implantation. Indicated animals were treated with anti-PD-1 i.p. and/or oral hexa- or penta-acylated LPS or control drinking water starting at day 10 after tumour implantation (anti-PD-1 versus Isotype ctrl, ***P = 0.0002; anti-PD-1 versus anti-PD-1 + Hexa, *P = 0.0318). Data shown were pooled from 2 experimental repeats with n = 10 mice per group. f, Flow cytometry measurements of IFNγ (anti-PD-1 versus Isotype ctrl, *P = 0.0325; anti-PD-1 versus anti-PD-1 + Hexa, *P = 0.0423) and TNF (anti-PD-1 versus anti-PD-1 + Hexa, *P = 0.0352) producing CD8+ T cells infiltrating tumours of mice in e with n = 5 mice per group. Brown–Forsythe and Welch ANOVA comparing all to WT in a. One-way ANOVA with a Dunnett’s multiple comparisons test in d. Two-way ANOVA comparing all to anti-PD-1 in e and Brown–Forsythe with post hoc Dunnett’s test comparing all to anti-PD-1 in f, with bars and error representing mean and s.e.m. Source data
Extended Data Fig. 1
Extended Data Fig. 1. Batch corrections reduce variance from study and geographic location to reveal microbiome associations with anti-PD-1 response.
Principal component analysis of the functional profile (KEGG OGs) of the pooled melanoma cohort before and after batch correction. Individual studies are shown in different colors. Density plots with different colors on the axes represent the sample distribution per study. Before batch correction samples were mostly clustered by study (left) while batch correction removed that effect (right). Permutational multivariate analysis of variance (PERMANOVA) results from the functional and taxonomic annotation before and after batch correction are shown in Supplementary Table 2.
Extended Data Fig. 2
Extended Data Fig. 2. Relative abundances without batch correction of LPS-encoding genes in melanoma patient metagenomes prior to anti-PD-1 treatment.
a, Relative abundance as gene count per million (GCPM) of total LPS biosynthesis genes (*P = 0.0413), lpxL (**P = 0.0072), lpxJ, and lpxM (*P = 0.0343), respectively (from left to right) in responder (n = 55) and non-responder (n = 57) metastatic melanoma patients. b, Ratio of lpxM encoding taxa to all other gram-negative taxa (*P = 0.0338) in indicated patient metagenomes. c, Relative abundance as GCPM of lpxM (upper row, Study B ***P = 0.0009) and total LPS biosynthesis genes (lower row) within metagenomes of responder and non-responder metastatic melanoma patients in individual studies. Two-tailed Mann-Whitney test with data presented as box from the 25th to 75th percentile, bar at median and whiskers from minimum to maximum (a-c). *P < 0.05, **P < 0.01, ***P < 0.001. Source data
Extended Data Fig. 3
Extended Data Fig. 3. Genomically encoded lpxM accurately predicts lipid A hexa-acylation capacity of gut microbes.
Two commensal isolates from our culture collection that encode lpxM were grown anaerobically, and a, lipid A was isolated from resulting cell pellets and analyzed using a customized LC-MS lipidomics method for characterization of lipid A acylation. b, MS/MS spectra of one characteristic hexa-acyl-1P ion (m/z 1716) of a purchased standard lipid A-1P from Escherichia coli. The characteristic acyl chain losses are annotated in the spectra as described by Sándor et al., 2016. c, Overlaid extracted ion chromatogram (EIC) of lipid A from mouse E. coli isolate LPS (left) and relative composition in terms of acylation and phosphorylation (right). d, Overlaid EIC of lipid A from mouse Klebsiella pneumoniae isolate LPS (left) and relative composition in terms of acylation and phosphorylation (right). Source data
Extended Data Fig. 4
Extended Data Fig. 4. Selective depletion of hexa-acylated LPS and TLR4 signalling by polymyxin B and TAK-242.
Mice were treated with polymyxin B (PMB), broad-spectrum antibiotics (ABX) or control drinking water for two weeks. a, Abundance of lpxJ-encoding bacterial taxa (Pre vs ABX, ****P < 0.0001; Pre vs PMB, **P = 0.0087; Ctrl H2O vs ABX, ****P < 0.0001; Ctrl H2O vs PMB, ***P = 0.0009) measured in mouse fecal metagenomes, shown as average number of classified reads at species level normalized to fecal weight, before and after treatment. n = 20 (Pre), 10 (Ctrl H2O), 12 (ABX) and 19 (PMB) mice per group pooled from 2 experimental repeats. b and c, Schematics for in vivo ABX, PMB and TAK-242 (TLR4 inhibitor) treatment regimens in the context of anti-PD-1 immunotherapy. Kruskal-Wallis test (a). **P < 0.01, ***P < 0.001, ****P < 0.0001. Source data
Extended Data Fig. 5
Extended Data Fig. 5. Flow cytometry phenotyping of immune cells from treated tumor-bearing mice.
Representative T cell a, and myeloid cell b, gating strategies for data in Figs. 3 and 4 and Extended Data Figs. 6 and 8.
Extended Data Fig. 6
Extended Data Fig. 6. Effects of TLR4 inhibitor TAK-242 on tumor-infiltrating immune cells.
MC38 colorectal adenocarcinoma cells were subcutaneously implanted into PMB pre-treated or untreated mice. Measurements were taken at indicated time points post implantation. Anti-PD-1 was administered i.p. starting at day 10 after tumor implantation, and the TLR4 inhibitor TAK-242 was administered i.p. during anti-PD-1 therapy. Flow cytometry measurements of indicated immune cells isolated from tumors of treated mice are shown. Data shown were pooled from 2 experimental repeats with n = 10 mice per group (exact p-values provided in Source Data Extended Data Figures). No differences were statistically significant by Kruskal-Wallis test. Source data
Extended Data Fig. 7
Extended Data Fig. 7. Contributions of host receptors and LPS acylation states to immune activation.
a, NF-kB reporter human THP-1 cells that do not (WT) or do over-express CD14 and TLR4 (CD14/TLR4-OE) were incubated with the indicated doses of hexa- or penta-acylated LPS for 24 h. Representative data from n = 3 biological replicates are shown from one of two experimental repeats. No significant differences between WT and CD14/TLR4-OE were calculated by two-tailed Mann-Whitney tests comparing equivalent doses and types of LPS. b, WT NF-kB reporter THP-1 cells were incubated with the indicated doses of hexa-acylated LPS and polymyxin B (PMB) for 24 h. NF-kB activation is expressed as a percentage of maximum. The means of n = 2 biological replicates are plotted in representative plots from one of three experimental repeats. Mouse RAW 264.7 macrophages were incubated with the indicated doses of hexa- or penta-acylated LPS without (c) or with (d) indicated concentrations of polymyxin B (PMB) for 24 h. Cytokine secretion was measured by cytometric bead arrays from culture supernatants. c, IL-6 (top) and TNF-α (bottom) secretion after 24 h of the indicated doses of hexa- or penta-acylated LPS. d, IL-6 (top) and TNF- α (bottom) secretion after 24 h of the indicated doses of hexa-acylated LPS and PMB. The means of n = 2 biological replicates are plotted in representative plots from one of three experimental repeats. For all plots, data are presented as mean ± SD. Source data
Extended Data Fig. 8
Extended Data Fig. 8. Effects of hexa- and penta-acylated LPS on tumor-infiltrating and peripheral immune cells.
MC38 cells were subcutaneously implanted into C57BL/6 mice. Indicated animals were treated with anti-PD-1 i.p. with or without oral hexa- or penta-acylated LPS in drinking water starting at day 10 after implantation. a-c, Flow cytometry measurements of immune cells isolated from indicated tissues of treated mice at day 21 after tumor implantation (exact p-values provided in Source Data Extended Data Figures). Data shown were pooled from 2 experimental repeats with n = 6-10 mice per group, depending on tissue, with each data point representing one mouse. Kruskal-Wallis test comparing all to anti-PD-1. d, Tumor measurements from mice treated with anti-PD-1 i.p. or oral hexa- or penta-acylated LPS starting at day 10 after implantation (anti-PD-1 vs Isotype Ctrl, *P = 0.0271). Data shown are from 1 experiment with n = 10 mice per group. Two-way ANOVA comparing all to isotype control. For all plots, data are presented as mean ± SEM. *P < 0.05, **P < 0.01, ***P < 0.001. Source data

References

    1. Matson, V. et al. The commensal microbiome is associated with anti-PD-1 efficacy in metastatic melanoma patients. Science359, 104–108 (2018). - PMC - PubMed
    1. Routy, B. et al. Gut microbiome influences efficacy of PD-1-based immunotherapy against epithelial tumors. Science359, 91–97 (2018). - PubMed
    1. Lee, K. A. et al. Cross-cohort gut microbiome associations with immune checkpoint inhibitor response in advanced melanoma. Nat. Med.28, 535–544 (2022). - PMC - PubMed
    1. McCulloch, J. A. et al. Intestinal microbiota signatures of clinical response and immune-related adverse events in melanoma patients treated with anti-PD-1. Nat. Med.28, 545–556 (2022). - PMC - PubMed
    1. d'Hennezel, E., Abubucker, S., Murphy, L. O. & Cullen, T. W. Total lipopolysaccharide from the human gut microbiome silences toll-like receptor signaling. mSystems10.1128/mSystems.00046-17 (2017). - PMC - PubMed

MeSH terms

Substances

LinkOut - more resources