. 2025 Feb;57(2):402-412.
doi: 10.1038/s41588-024-02058-1. Epub 2025 Feb 10.

Oncofetal reprogramming drives phenotypic plasticity in WNT-dependent colorectal cancer

Affiliations

Oncofetal reprogramming drives phenotypic plasticity in WNT-dependent colorectal cancer

Slim Mzoughi et al. Nat Genet. 2025 Feb.

Abstract

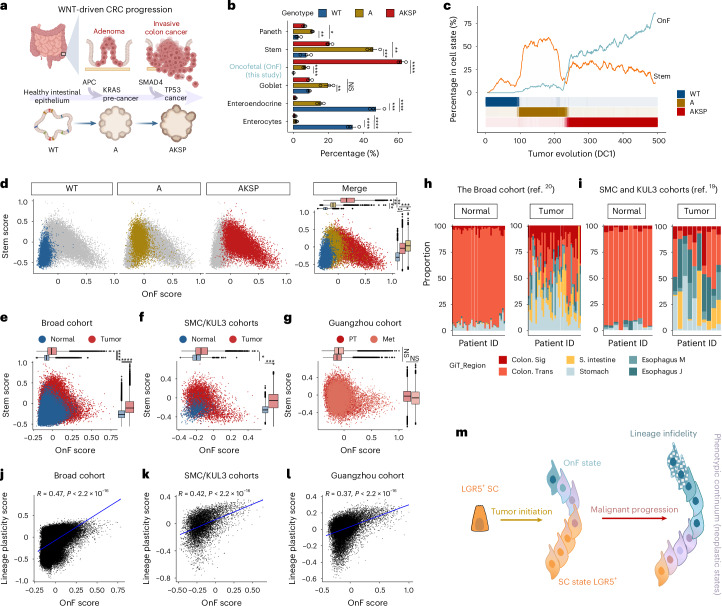
Targeting cancer stem cells (CSCs) is crucial for effective cancer treatment, yet resistance mechanisms to LGR5+ CSC depletion in WNT-driven colorectal cancer (CRC) remain elusive. In the present study, we revealed that mutant intestinal stem cells (SCs) depart from their canonical identity, traversing a dynamic phenotypic spectrum. This enhanced plasticity is initiated by oncofetal (OnF) reprogramming, driven by YAP and AP-1, with subsequent AP-1 hyperactivation promoting lineage infidelity. The retinoid X receptor serves as a gatekeeper of OnF reprogramming and its deregulation after adenomatous polyposis coli (APC) loss of function establishes an OnF 'memory' sustained by YAP and AP-1. Notably, the clinical significance of OnF and LGR5+ states in isolation is constrained by their functional redundancy. Although the canonical LGR5+ state is sensitive to the FOLFIRI regimen, an active OnF program correlates with resistance, supporting its role in driving drug-tolerant states. Targeting this program in combination with the current standard of care is pivotal for achieving effective and durable CRC treatment.


Conflict of interest statement

Competing interests: E.G.’s laboratory received research funds from AZ and Prelude Therapeutics (for unrelated projects). E.G. is a cofounder and shareholder of Immunoa Pte. Ltd and cofounder shareholder, consultant and advisory board member of Prometeo Therapeutics. G.G. is inventor on the patent application no. EP18192715 by the MDC for the design and use of sLCRs. R.S. is cofounder and CEO of Panacent Bio, Inc. and equity holder in GeneDx, neither of which has contributed to or been involved in the research in this publication. The other authors declare no competing interests.

Figures

Fig. 1
Fig. 1. Evolution of neoplastic cell states during CRC progression.
a, Schematics of the organoid models used to recapitulate the malignancy continuum of CRC. b, The percentage of various cell types and states in the indicated models (n = 3 independent organoid cultures per group). Cell numbers per group are given in Supplementary Table 1a. The bar plots are mean ± s.e.m. Linear regression tested for significant differences in log(transformed cell-type proportions) between genotypes, with P values adjusted using the Benjamini–Hochberg method. c, Percentage of cells in stem and OnF states along diffusion component 1 (DC1), grouped into 500 bins by increasing DC1 values. The bottom color bars show the percentage of cells from each genotype per bin. d, Scatter plot showing cell state distribution along the SC–OnF phenotypic spectrum across the CRC malignancy continuum. Horizontal and vertical box plots indicate OnF and LGR5+ SC module score enrichment, respectively (n = 3 independent organoid cultures per group). eg, Scatter plot depicting cell state distribution along the SC–OnF phenotypic spectrum in the Broad (n = 36 patients) (e), SMC/KUL3 (n = 10 patients) (f) and Guangzhou (n = 5 patients) (g) cohorts. The horizontal and vertical box plots indicate OnF and SC module score enrichment, respectively. PT, primary tumor; Met, metastasis. In dg, box plots show the center line as the median, box limits as the interquartile range (IQR: 25th to 75th percentiles), the whiskers the ±1.5× the IQR and individual points the outliers. The P values were calculated using two-sided, paired Student’s t-test comparing sample means. h,i, Proportions of cells expressing lineage-specific signatures of the indicated gastrointestinal tract tissues, in individual patients from the Broad (h) and SMC/KUL3 (i) cohorts: J, junction; M, mucosa; S, small; Sig, sigmoid; Trans, transverse. jl, Correlation between the OnF and lineage plasticity scores (Methods) in the Broad (j; n = 36 patients), SMC/KUL3 (k; n = 10 patients) and Guangzhou (l; n = 5 patients) normal CRC-matched cohorts, respectively. Two-sided Pearson’s correlation for significance is used. m, Schematic model depicting the evolution of the phenotypic spectrum of neoplastic SCs throughout CRC progression. In bd, WT = 4,058 cells, A = 5,890 cells and AKSP = 10,946 cells. *P < 0.05, **P < 0.01; ***P < 0.001; ****P < 0.0001; exact P values are given in Supplementary Table 7. Illustrations in a created using BioRender.com.
Fig. 2
Fig. 2. Distinct roles of YAP and AP-1 in OnF reprograming during CRC evolution.
a, Heatmap of ATAC–seq signal in WT, A and AKSP organoids at genomic DARs (top). Average ATAC–seq signal profile ±2 kb is around the peak center in clusters c1 and c2 (bottom). RPKM, reads per kilobase million. be, Elbow plots showing TF activity in A versus WT (b and d) and AKSP versus WT (c and e) using DARs from clusters c1 (b and c) and c2 (d and e). For ae, n = 2 independent organoid cultures per group. CEBP, CCAAT-enhancer-binding protein; NRs, nuclear receptors; BATF, basic leucine zipper transcription factor, ATF-like; JUND, JunD proto-oncogene, AP-1 transcription factor subunit. f,g, Relative OnF signature enrichment during tumor initiation following knockdown (kd) of YAP or FOS (f) or the ectopic expression of a dominant-negative (DN) FOS (g). Each data point is a gene in the OnF signature (n = 4 independent experiments; ***P < 0.001, two-sided Wilcoxon’s rank-sum test). h, Line plot of differential TF activity (combined score), from d and e, during CRC evolution. Two-sided, paired Student’s t-tests were used for significance. JUN, Jun proto-oncogene, AP-1 transcription factor subunit; MAFK, v-maf avian musculoaponeurotic fibrosarcoma oncogene homolog K. ik, Motif activity of ASCL2 (i), FOS/AP-1 (j) and TEAD1 (k) in AKSP single cells across the SC–OnF phenotypic spectrum determined by chromVAR z-scores for the indicated TFs. The correlation coefficients between TF activity and the LGR5+ SC or OnF score are indicated in orange and green, respectively. Multiome data are from two independent organoid cultures (n = 11,030 cells). ln, Relative enrichment of the OnF (l), esophagus (m) and small intestine (n) signatures in WT organoids following ectopic expression of YAP or YAP then FOS, sequentially. Each data point is a gene (n = 4 independent experiments; NS, not significant, ***P < 0.001, two-sided Wilcoxon’s rank-sum test). EV, empty vector. oq, GSEA of OnF (o), esophagus (p) and small intestine (q) gene signatures in YAP overexpression (OE) versus YAP + FOS sequential OE organoids, relative to ln. Two-sided, permutation-based test was used for significance; P values were adjusted via the Benjamini–Hochberg method. r, Model of phenotypic spectrum evolution in neoplastic cells during CRC progression highlighting key TFs at play. Various gradients of ASCL2, YAP and FOS activity are pivotal to establishing a phenotypic continuum in neoplastic cells. In the box plots in f, g and ln, the center line is the median, the box limits the IQR (25th to 75th percentiles) and the whiskers the highest and lowest values within ±1.5× the IQR. *P < 0.05; ***P < 0.001; exact P values are given in Supplementary Table 8. NES, normalized enrichment score; TPM, transcripts per million. Source data
Fig. 3
Fig. 3. Deregulation of an APC–RXR regulatory axis during tumor initiation establishes an OnF memory.
a, RXRa expression in matched human normal colon and tumors from TCGA/COAD (n = 41 patients). P values were calculated using two-sided, paired Wilcoxon’s test. b, Rxra expression during tumorigenesis (WT and A, n = 6 independent organoid cultures; AKSP, n = 3). The P values were calculated using two-sided, unpaired Wilcoxon’s test. In the box plots, the center line is the median, the box limits the IQR (25th to 75th percentiles) and the whiskers the highest and lowest values within ±1.5× the IQR. c, Experimental approach for the comparative analyses of Anull and RXRi (+HX531) versus WT organoids. d,e, Spearman’s correlation of the top 2,000 (d) or 1,000 (e) highly variable genes. READ, rectum adenocarcinoma. f,g, Elbow plots depicting TF activity in RXRi (f) versus WT organoids (g). TF combined binding score = −log10(P value) × log2(fold-change). Significantly more accessible or less accessible regions were used in f and g, respectively (WT, n = 2; RXR, n = 3 independent ATAC–seq experiments). h, Experimental design summary for Fig. 2i. i, GSEA of OnF genes following the APC–RXR axis perturbation during tumor initiation (n = 4 independent experiments). j,k, GSEA of OnF genes in CRC tumoroids (AKSP), following RXR-OE (j) or inhibition (RXRi) (k) (n = 4 and 3 independent experiments, respectively). l, Experimental design summary for Fig. 2m–o. m, GSEA of OnF genes >5 weeks post-RXRi washout (n = 3 independent cultures). In im, a two-sided permutation-based test for significance was used; P values were adjusted via the Benjamini–Hochberg method. n, ATAC–seq signal intensity in RXRi, woRXRi (>5 weeks post-HX531 withdrawal), A and AKSP versus WT organoids. o, Elbow plot of more accessible regions in RXR versus WT organoids ranked by their log2(fold-change) in woRXRi versus WT. Resolved peaks were subset to obtain the 1,342 regions (mean of number of suppressed and persistent regions) with log2(fold-change) closest to 0. The HOMER motif enrichment analysis indicates the top enriched TFBSs of the persistent ‘memory’ regions (>5 weeks post-RXRi washout (right)). n,o, RXR and woRXRi (n = 3 independent cultures; WT, A, AKSP, n = 2). FC, fold change. Illustrations in c, h and l created using BioRender.com. Source data
Fig. 4
Fig. 4. Visualization and targeting of the OnF program in CRC.
a, Schematic of the OnF phenotypic reporter structure. PGK, phosphoglycerate kinase promoter; NEO, neomycin resistance gene. b, Experimental flow diagram (top) and gene-set enrichment in GFPhigh versus GFP cells sorted from VAKSPOnF (Villin-Cre AKSP) tumoroids expressing the OnF reporter (bottom) (n = 3 independent sorts). c, Representative pseudocolor plots from flow cytometry of VAKSP tumoroids co-expressing OnF–GFP (y axis) and stem/STAR–mCherry (x axis) phenotypic reporters. VAKSPOnF/STAR tumoroids were treated with dimethyl sulfoxide or FOLFIRI for 3 days before analysis. d, Quantitative representation of flow cytometry data from c. In c and d, n = 3 independent experiments; error bars = s.d.; P values are by paired, two-sided Student’s t-tests. e, Heatmap reporting log2(fold-change) in WNT (left) and YAP or AP-1 (right) target gene expression (n = 3 independent experiments). f, Summary of the VAKSP tumoroid models used for functional studies. g,i, Schematic of the experimental strategy to genetically target the OnF state, stem state or both, either transiently (g) or persistently (i), relevant to hj. hj, Growth rate of subcutaneous VAKSP tumors with indicated reporter combinations, in response to DT treatment. Mean tumor volume ± s.e.m. The dotted lines indicate saline treatment (all models, n = 6 tumors). h, Dashed lines indicate transient DT treatment (5 d; 3 doses on alternate days): OnFDTR (n = 11), STARDTR (n = 9), OnFDTR/STARDTR (n = 10). j, The solid lines indicate persistent DT treatment, on alternate days, throughout the experiment: OnFDTR (n = 12), STARDTR (n = 11), OnFDTR/STARDTR (n = 9). Bottom, DT dosing schedule; the dashed red line indicates treatment duration. k, Schematic of the experimental strategy used in l. l, Dotted line, vehicle (n = 8 tumors); solid lines, DT (n = 6), FOLFIRI (n = 7) and DT + FOLFIRI (n = 8). Mice received three doses per week on alternate days. Values are mean tumor volume ± s.e.m. In h, j and l, the P values were calculated using a mixed-effects linear model with Tukey’s adjustment for multiple comparisons (two sided). mp, Heatmaps showing percentage viability of VAKSP tumoroids with the indicated drug combinations. A single dose of MRTX1133 and IAG933 was used in n and p, respectively. The effects of these single doses of each drug are highlighted in m (MRTX1133) and o (IAG933), respectively. IC, inhibitory concentration. q, Dot plot indicating the combination index from drug combinations in mp. The P values were calculated using two-sided, paired Student’s t-tests. In mq, n = 3 independent experiments. Illustrations in b, g, i and k created using BioRender.com. Source data
Extended Data Fig. 1
Extended Data Fig. 1. Oncofetal reprogramming during intestinal tumorigenesis.
a, Schematics of the genetic approach used to generate isogenic mouse organoid models mimicking the adenoma-to-adenocarcinoma sequence. b, UMAP of scRNA-seq of the indicated models. c, Cells from the neoplastic metacluster are indicated in green on the UMAP. d, Volcano plot of differentially expressed genes (DEGs) in the neoplastic metacluster vs. all other clusters. p-values calculated using DESeq2, Wald test (two-sided, unpaired); Benjamini-Hochberg adjustments. e, Venn diagram depicting the strategy used to define the mouse oncofetal (OnF) signature. f-h, UMAPs showing enrichment scores of enterocytes (f), stem cell (g) and OnF (h) signatures throughout CRC progression. i, Heatmap of SC and OnF module scores across cell clusters and genotypes. In panels b-c and f-h WT = 4058 cells; A = 5890 cells; AKSP 10946 cells. j, Relative Lgr5 expression along the SC-OnF continuum. k, Enrichment of the OnF and SC module scores across genotypes (n = 3 independent organoid cultures per group). boxplots: center line, median; box limits, interquartile range (IQR: 25th to 75th percentile); whiskers, ±1.5x IQR; individual points, outliers. p-values calculated using two-sided unpaired t-test. Illustrations in a created using BioRender.com. Source data
Extended Data Fig. 2
Extended Data Fig. 2. Enhanced oncofetal reprogramming triggers lineage plasticity in advanced human CRC.
a, Human OnF score enrichment in matched normal and tumors tissues (TCGA/COAD; n = 41 patients). Two-sided paired t-tests for significance. b-d, Scatter plots depicting cell state distribution along the SC-OnF spectrum in matched healthy colons and tumors stratified by APC mutation and MMR status, respectively. b; SMC/KUL3 cohort, n = 7 patients; c-d; Broad cohort, n = 15 MMRp patients (c) and n = 21 MMRd patients (d). Two-sided paired t-tests for significance. e, Principal Component Analysis (PCA) of integrated bulk RNA-seq data from human gut developmental stages, definitive endoderm (Def. end), embryonic stem cells (ESC) (Finkbeiner et al., 2015) normal colon and CRC (TCGA/COAD). f, Gene Set Enrichment Analysis (GSEA) of lineage-specific signatures in tumor (n = 455) vs. normal (n = 41) specimens (TCGA/COAD). NES: normalized enrichment score. g-j, Scatter plots (left) and boxplots (right) of lineage specific signature enrichment across the SC-OnF continuum in matched tumors and normal colons from the SMC/KUL3 (g and h, n = 10) and Broad (i and j, n = 36) cohorts. Two-sided paired t-tests for significance. In panels a, b-d and g-j, boxplots: center line, median; box limits, interquartile range (IQR: 25th to 75th percentile); whiskers, ±1.5x IQR; individual points, outliers. Source data
Extended Data Fig. 3
Extended Data Fig. 3. A multi-omics approach elucidates the molecular determinants of cell state dynamics during CRC evolution.
a, Schematic of the experimental strategy, integrating multiomics with functional validation, and the genetic models used. b, Differentially accessible regions (DARs) in A vs. WT and AKSP vs. WT; shared DARs shown in faded colors (data from 2 independent organoid cultures per group). c, HOMER motif analysis for CDX2 and HNF4a, using DARs from cluster c1 in Fig. 2a. d-e, TF occupancy strength for CDX2 (d) and HNF4a (e) shown as aggregated footprinting plot matrix centered around binding motifs. f, HOMER motif analysis using DARs from cluster c1 in Fig. 2a. g-i, TF occupancy strength for RXR (g), PPAR (h) and VDR (i) shown as aggregated footprinting plot matrix centered around binding motifs. j, HOMER motif enrichment analysis in promoter regions of OnF genes or random promoters (TSS + /- 1 kb). Illustrations in panel a created using BioRender.com.
Extended Data Fig. 4
Extended Data Fig. 4. Functional validation of YAP and AP-1 as drivers of OnF reprogramming.
a, Schematic summary of the experimental design related to Fig. 2f, g. b-e, GSEA of OnF genes following YAP (b-c) depletion and FOS depletion (d) or inhibition (e) during tumor initiation, related to Fig. 2f, g. Two-sided permutation-based test for significance; p-values adjusted via the Benjamini-Hochberg method. f-g, Scatter plots showing enrichment of the SC (left) and small intestine (right) (f) and the OnF (left) and esophagus mucosa (right) module scores (g) along the SC-OnF continuum in scRNA-seq cells from the AKSP Multiome. h-i, Scatter plots showing the correlation between FOS (h) or TEAD (i) activity and lineage infidelity score. Two-sided Pearson correlation for significance. j, Schematic summary of the experimental design related to Fig. 2l-n and o-q. k, Log2 median-of-ratios (DESeq2) normalized counts of AP-1 genes following YAP (S6A) overexpression in WT organoids (n = 4 independent experiments). Boxplots: center line, median; box limits, interquartile range (IQR: 25th to 75th percentile); whiskers, highest and lowest values within ±1.5x IQR. P-values calculated via two-sided Student’s t-test with multiple comparison adjustments. l-n, GSEA of OnF (l), esophagus (m) and small intestines (n) genes following YAP (S6A) overexpression in WT organoids, related to Fig. 2l-n. Two-sided permutation-based test for significance; p-values adjusted via the Benjamini-Hochberg method. Illustrations in a and j created using BioRender.com.
Extended Data Fig. 5
Extended Data Fig. 5. Comparative analyses of RXR inhibition versus APC depletion.
a-c, Representative images of WT organoids treated with DMSO (a) or RXR antagonist HX531 (RXRi) (b), and A tumoroids (c). Scale bars, 1 mm. Lower panels show close-ups of dashed line areas, highlighting morphological changes. d, GSEA of OnF genes in RXRi vs. WT organoids (n = 3 independent cultures). e, Heatmap of differentially expressed marker genes of the indicated markers in RXRi vs. WT and A vs. WT (n = 3 independent cultures per group). f, g, Venn diagrams showing overlaps of the more (f) and less (g) accessible regions in RXRi and A organoids. Punctuated areas represent changes in the same direction but not meeting the log2 fold change cutoff ≥1.5. h, ATAC-seq signal heatmap in WT, A and RXRi organoids at differentially accessible regions (upper panel). Average ATAC-seq signal within a ±2Kb region around the peak center (lower panel). i-n, TF occupancy strength (aggregated footprinting plot matrix) for the RXRa (i), CDX2 (j), HNF4a (k), FOS (l), TEAD3 (m) and TCF7 (n) in WT, A and RXRi organoids. Plots are centered around binding motifs. o, HOMER motif enrichment analysis of the indicated TFs in A and RXRi models vs. WT. In f-o, RXRi, n = 3; WT, n = 2 and A, n = 2 independent cultures.
Extended Data Fig. 6
Extended Data Fig. 6. RXR inhibition phenocopies APC depletion excluding WNT activation.
a-b, Venn diagrams showing overlap of up-regulated (a) and down-regulated (b) genes following RXR inhibition and APC depletion in WT organoids. Punctuated areas represent changes not meeting the log2 fold change ≥1 cutoff. KEGG pathway analysis reveals common regulation in both models, except for WNT. c, GSEA of KEGG pathway enrichment in RNA-seq data from RXRi vs. WT and A vs. WT. NES, normalized enrichment score. In a-c n = 3 independent cultures per group. d-e, Differentially expressed genes (DEGs) (d) and regions (DARs) (e) in RXRi vs. WT and woRXRi vs. WT organoids. Faded colors indicate persistent DEGs and DARs. Log2 fold change (f.c) and p-values thresholds for DEGs and DARs are indicated in the figure. p-values calculated using DESeq2, Wald test (two-sided, unpaired); Benjamini-Hochberg adjustments. f-h, GSEA of OnF genes following YAP (f-g) or FOS (h) depletion in CRC tumoroids (AKSP) (n = 3-4 independent experiments). Two-sided permutation-based test for significance; p-values adjusted via the Benjamini-Hochberg method.
Extended Data Fig. 7
Extended Data Fig. 7. Design and functional validation of the oncofetal phenotypic reporter.
a, Design method the oncofetal (OnF) synthetic locus control regions (sLCR). b, Genome Browser view of cis-regulatory elements used in the OnF sLCR. c, Normalized distribution of OnF-GFP+ cells and eGFP fluorescence intensity measured by flow cytometry. d, eGFP geometric mean fluorescence insensitivity (MFI) quantification. Error bars, s.d; n = 3 independent cultures, p-values calculated using Fisher/s LSD post-hoc test after one-sided ANOVA (p < 0.05). e, Scaled OnF gene expression in GFPhigh and GFPNeg cells sorted from VAKSPOnF tumoroids, n = 3 independent sorts. f, Schematic of the OnF sLCR substitution with the STAR minigene. g, Representative fluorescence microscopy images of VAKSP tumoroids co-expressing both reporters (VAKSPOnF/STAR). Scale bars, 200μm. h, Volcano plot of differentially expressed genes (DEGs) in VAKSP tumoroids post-3-day FOLFIRI treatment (n = 3 independent experiments). Significant DEGs are on both sides of dashed lines (log2FC > 1; p-value < 0.01); p-values, DESeq2, Wald test (two-sided, unpaired); Benjamini-Hochberg adjustments. i, The GFP/mCherry gating strategy to sort clones used in (j-l). j-l, Quantification of predominantly cell states in response to FOLFIRI in 3 independent clones sorted from GFPhigh (j), mCherryhigh (k) or GFP/mCherryhigh (hybrid) (l) populations. p-values calculated using paired two-sided t-tests. m-r, Representative pseudocolor plots of flow-cytometry analysis of GFPhigh (m-n) mCherryhigh (o-p) and hybrid clones (q-r) before (m, o and q) and after FOLFIRI tretament for 3 days (n, p and r), related to (j-l). Source data
Extended Data Fig. 8
Extended Data Fig. 8. A dual phenotypic reporter system to trace and target the OnF and Stem Cell states.
a, Heatmap of day 5 FOLFIRI dose-response in patient-derived organoids (PDOs); n = 3 independent experiments. b-d, DEGs in response to FOLFIRI. b, OnF genes; c, stem cell and WNT-related genes; d, YAP and AP-1 target genes. PDOs treated with their respective IC70 for 5 days. Data are log2 fold change in FOLFIRI vs. DMSO; n = 3 independent experiments. e, Fluorescence microscopy images of the indicated models treated with demi-water or DT for 3 days. Scale bars, 400 µm. f, Quantification of the predominantly stem, OnF and hybrid states post-DT treatment (day3); n = 4-7 independent experiments per group. p-values calculated using paired two-sided t-tests, adjusted for multiple comparisons using Benjamini-Hochberg method. Center, median; boxes, lower and upper quartiles; whiskers min and max values. g, Representative immunohistochemistry staining of GFP and mCherry in tumors from mice treated with saline or DT (n = 2 tumors for the saline; n = 3 tumors for DT), relative to Fig. 4l. Scale bars, 2 mm. Source data

Update of

References

    1. Sinicrope, F. A. Increasing incidence of early-onset colorectal cancer. N. Engl. J. Med.386, 1547–1558 (2022). - PubMed
    1. Merlos-Suarez, A. et al. The intestinal stem cell signature identifies colorectal cancer stem cells and predicts disease relapse. Cell Stem Cell8, 511–524 (2011). - PubMed
    1. Vermeulen, L. et al. Single-cell cloning of colon cancer stem cells reveals a multi-lineage differentiation capacity. Proc. Natl Acad. Sci. USA105, 13427–13432 (2008). - PMC - PubMed
    1. Zhou, Y. et al. Cancer stem cells in progression of colorectal cancer. Oncotarget9, 33403–33415 (2018). - PMC - PubMed
    1. Ohta, Y. et al. Cell–matrix interface regulates dormancy in human colon cancer stem cells. Nature608, 784–794 (2022). - PubMed

MeSH terms

LinkOut - more resources