Meta-Analysis
. 2025 Feb;57(2):334-344.
doi: 10.1038/s41588-024-02068-z. Epub 2025 Feb 10.

Genome-wide association study of prostate-specific antigen levels in 392,522 men identifies new loci and improves prediction across ancestry groups

Affiliations
Meta-Analysis

Genome-wide association study of prostate-specific antigen levels in 392,522 men identifies new loci and improves prediction across ancestry groups

Thomas J Hoffmann et al. Nat Genet. 2025 Feb.

Abstract

We conducted a multiancestry genome-wide association study of prostate-specific antigen (PSA) levels in 296,754 men (211,342 European ancestry, 58,236 African ancestry, 23,546 Hispanic/Latino and 3,630 Asian ancestry; 96.5% of participants were from the Million Veteran Program). We identified 318 independent genome-wide significant (P ≤ 5 × 10⁻⁸) variants, 184 of which were novel. Most demonstrated evidence of replication in an independent cohort (n = 95,768). Meta-analyzing discovery and replication (n = 392,522) identified 447 variants, of which a further 111 were novel. Out-of-sample variance in PSA explained by our genome-wide polygenic risk scores ranged from 11.6% to 16.6% for European ancestry, 5.5% to 9.5% for African ancestry, 13.5% to 18.2% for Hispanic/Latino and 8.6% to 15.3% for Asian ancestry and decreased with increasing age. Midlife genetically adjusted PSA levels were more strongly associated with overall and aggressive prostate cancer than unadjusted PSA levels. Our study highlights how including proportionally more participants from underrepresented populations improves genetic prediction of PSA levels, offering potential to personalize prostate cancer screening.


Conflict of interest statement

Competing interests: J.S.W. and C.L.C. are nonemployee co-founders of Avail Bio. H.L. is named on a patent for intact PSA assays and a patent for a statistical method to detect prostate cancer that is licensed to and commercialized by OPKO Health. H.L. receives royalties from sales of the test and has stock in OPKO Health. J.S.W. consults for DLA Piper on subject matter unrelated to this study. R.E.G. consults for Hunton Andrews Kurth on subject matter unrelated to this study. The other authors declare no competing interests.

Figures

Fig. 1
Fig. 1. Precision PSA project workflow and composition.
The discovery GWAS analysis revealed 318 genome-wide significant (P < 5 × 10⁻⁸, two-sided test) variants associated with PSA, of which 184 were novel. The joint analysis (consisting of the discovery and replication cohorts) revealed 447 genome-wide significant variants associated with PSA, of which an additional 111 were novel. Both discovery and joint GWAS results were used to develop PRSs for PSA, which were then evaluated in GERA (when out of sample), PCPT and SELECT. Sig, significant; SNP, single-nucleotide polymorphism.
Fig. 2
Fig. 2. Genome-wide significant variants from the discovery GWAS.
Concentric tracks are colored based on results from individual ancestries, with gray indicating results from the overall discovery meta-analysis (n = 296,754). The 100,000 variants with the smallest P values per ancestry are shown as points; larger circled points indicate the 318 genome-wide significant variants (P < 5 × 10⁻⁸; 184 of which were novel) from the overall discovery analysis across ancestries. Variant density in 10 Mbp bins from the overall analysis is shown as a heatmap above the overall track. The outermost ring displays genes associated with novel discovery PSA variants. Results are from a fixed effects meta-analysis of linear regression analysis with two-sided tests.
Fig. 3
Fig. 3. Joint multiancestry meta-analysis of the discovery and replication cohorts.
Only genome-wide significant associations (P < 5 × 10⁻⁸) are plotted. The joint analysis (n = 296,754 discovery, plus n = 95,768 replication) detected 447 independent genome-wide significant PSA-associated variants. These included 111 novel variants that were conditionally independent from previous findings and the discovery-only analyses (indicated by the circles). Gene labels are given for variants with CADD > 15 and/or variants that are prostate tissue eQTLs. Results are from a fixed effects meta-analysis of GWAS performed using linear regression. All P values are two-sided.
Fig. 4
Fig. 4. Relationship between MAF and effect sizes.
Each point represents one of the 447 independent genome-wide significant variants identified in our mJAM multiancestry GWAS joint meta-analysis (n = 392,522). The estimated variant effect sizes are expressed in ln(PSA) per minor allele. The curves indicate the hypothetical detectable variant effect sizes for a given MAF, assuming statistical power of 80% and α = 5 × 10⁻⁸ (genome-wide significant), and assuming that the sample size of each of our populations is as follows: 297,166 EUR, 61,745 AFR, 6,967 ASN and 26,644 HIS/LAT. Effects are from a meta-analysis of GWAS performed using linear regression.
Fig. 5
Fig. 5. Variance in PSA explained by PRSs.
PRSs for PSA trained on the discovery GWAS meta-analysis was evaluated in GERA, in addition to the three main validation cohorts (PCPT, SELECT and AOU). Joint PRSs were trained on summary statistics from the meta-analysis of the discovery GWAS and replication GWAS. A PRS was first constructed based on independent variants identified using mJAM that reached genome-wide significance. Then a multiancestry genome-wide score was developed using PRS-CSx. a,b, The variance explained by genome-wide PRSs was up to 16.9% in EUR, 18.6% in HIS/LAT, 9.5% in AFR and 15.3% in ASN (a) and decreased as age increased (b). Estimates and full details are found in Supplementary Table 9. Error bars indicate 95% CIs. Variance explained was estimated from partial r2 estimates from linear regression models adjusted for age and genetic ancestry PCs. Sample sizes of each population are specified in a. EUR, European; LAT, Hispanic/Latino; AFR, African; EAS, East Asian; ASN, Asian; OTH, other; AMR, Admixed American; Disc., discovery.
Fig. 6
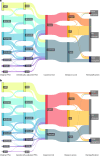
Fig. 6. Biopsy reclassification with genetically adjusted PSA.
a,b, PSA values were adjusted (Methods) using the PRS-CSx estimate from the out-of-sample discovery cohort and assessed in GERA using age-specific cutoffs in European (n = 4,736; a) and African (n = 420; b). GERA Hispanic/Latino and Asian are shown in Extended Data Fig. 3. The Sankey diagram is based on percentages of each of the flows from/into nodes. N/A, not applicable.
Extended Data Fig. 1
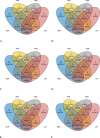
Extended Data Fig. 1. Overlap of SNPs in groups.
a, Discovery (n = 296,754), genome-wide significant. b, Discovery, Bonferroni significant. c, Meta-analysis (n = 95,768), genome-wide significant. d, Meta-analysis, Bonferroni significant. e, Previously reported variants, genome-wide significant. f, Previously reported variants, Bonferroni significant. SNPs were identified from fixed-effects meta-analysis of linear regression tests, two-sided. EUR, European ancestry; AFR, African ancestry; ASN, Asian ancestry; LAT, Hispanic/Latino.
Extended Data Fig. 2
Extended Data Fig. 2. Medication sensitivity analysis.
Comparison of effect estimates from the main UK Biobank European ancestry PSA analyses to those from the sensitivity analyses excluding individuals taking testosterone or 5-alpha reductase inhibitors, which are medications that could affect PSA levels. We also adjusted for alpha-blockers in this analysis. Results are from linear regression tests (n = 26,669, nsensitivity = 20,742), two-sided, no multiple comparison adjustment. PSA, prostate-specific antigen.
Extended Data Fig. 3
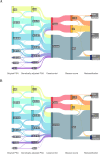
Extended Data Fig. 3. Biopsy reclassification with genetically adjusted PSA in additional groups.
a, b, PSA levels were adjusted (see Methods) using the PRS-CSx estimate from the out-of-sample discovery cohort, assessed in GERA using age-specific cutoffs in (a) Hispanic/Latino (n = 403) and (b) East Asian ancestry (n = 406). The sankey diagram is based on percentages of each of the flows from/into nodes.
Extended Data Fig. 4
Extended Data Fig. 4. Measured PSA vs. genetically adjusted PSA (PSA’).
Comparison given using the Kaiser Permanente GERA cohort (n = 43,945). The variability is consistent across ln PSA levels; solid black line identifies the median, and the dashed line the interquartile range (adjustment described in Methods). GERA, Genetic Epidemiology Resource on Adult health and aging.
Extended Data Fig. 5
Extended Data Fig. 5. Comparison of genetic effects on absolute and relative quantification of PSA.
Comparison done in UKB using Olink. a, b, Correlation between multiancestry GWAS effect sizes (from fixed effects meta-analysis of linear regressions) for 409 out of 447 lead variants and KLK3 pQTL effect sizes was estimated in (a) European (n = 46,214) and (b) African (n = 1,065) ancestry populations. Error bars are ± standard errors. UKB, UK Biobank.
Extended Data Fig. 6
Extended Data Fig. 6. Prostate cell expression.
Expression of eQTL genes (eGenes) associated with discovered SNPs is shown for prostate cell types (scRNA-seq Chan-Zuckerberg BioHub, n = 36 cell types with >1,000 cells; 78,613 cells with eGenes total). Circle size indicates the fraction of cells with expression, and expression levels are colored. Expression across all eQTL genes except LIME1 is observed in luminal cells of the prostate.
Extended Data Fig. 7
Extended Data Fig. 7. Luminal epithelium vs. all other prostate cells expression.
Expression of eQTL-associated genes (eGenes) is represented as a percentile of total expression in luminal epithelium (n = 14,380 cells) vs. all other prostate tissue cells (n = 68,240 cells). eQTL-associated genes are expressed at significantly higher percentile levels in luminal epithelial cells than other prostate cell types (P = 0.0006).

Update of

References

    1. Lilja, H. A kallikrein-like serine protease in prostatic fluid cleaves the predominant seminal vesicle protein. J. Clin. Invest.76, 1899–1903 (1985). - PMC - PubMed
    1. Lilja, H., Ulmert, D. & Vickers, A. J. Prostate-specific antigen and prostate cancer: prediction, detection and monitoring. Nat. Rev. Cancer8, 268–278 (2008). - PubMed
    1. Balk, S. P., Ko, Y.-J. & Bubley, G. J. Biology of prostate-specific antigen. J. Clin. Oncol.21, 383–391 (2003). - PubMed
    1. Pinsky, P. F. et al. Prostate volume and prostate-specific antigen levels in men enrolled in a large screening trial. Urology68, 352–356 (2006). - PubMed
    1. Lee, S. E. et al. Relationship of prostate-specific antigen and prostate volume in Korean men with biopsy-proven benign prostatic hyperplasia. Urology71, 395–398 (2008). - PubMed

Publication types

Substances