. 2025 Mar;26(3):511-523.
doi: 10.1038/s41590-025-02088-9. Epub 2025 Feb 10.

Mechanisms of NLRP3 activation and inhibition elucidated by functional analysis of disease-associated variants

Affiliations

Mechanisms of NLRP3 activation and inhibition elucidated by functional analysis of disease-associated variants

Shouya Feng et al. Nat Immunol. 2025 Mar.

Abstract

The NLRP3 inflammasome is a multiprotein complex that mediates caspase-1 activation and the release of proinflammatory cytokines, including interleukin (IL)-1β and IL-18. Gain-of-function variants in the gene encoding NLRP3 (also called cryopyrin) lead to constitutive inflammasome activation and excessive IL-1β production in cryopyrin-associated periodic syndromes (CAPS). Here we present functional screening and automated analysis of 534 NLRP3 variants from the international INFEVERS registry and the ClinVar database. This resource captures the effect of NLRP3 variants on ASC speck formation spontaneously, at low temperature, after inflammasome stimulation and with the specific NLRP3 inhibitor MCC950. Most notably, our analysis facilitated the updated classification of NLRP3 variants in INFEVERS. Structural analysis suggested multiple mechanisms by which CAPS variants activate NLRP3, including enhanced ATP binding, stabilizing the active NLRP3 conformation, destabilizing the inactive NLRP3 complex and promoting oligomerization of the pyrin domain. Furthermore, we identified pathogenic variants that can hypersensitize the activation of NLRP3 in response to nigericin and cold temperature exposure. We also found that most CAPS-related NLRP3 variants can be inhibited by MCC950; however, NLRP3 variants with changes to proline affecting helices near the inhibitor binding site are resistant to MCC950, as are variants in the pyrin domain, which likely trigger activation directly with the pyrin domain of ASC. Our findings could help stratify the CAPS population for NLRP3 inhibitor clinical trials and our automated methodologies can be implemented for molecules with a different mechanism of activation and in laboratories worldwide that are interested in adding new functionally validated NLRP3 variants to the resource. Overall, our study provides improved diagnosis for patients with CAPS, mechanistic insight into the activation of NLRP3 and stratification of patients for the future application of targeted therapeutics.


Conflict of interest statement

Competing interests: S.L.M. is the Vice President of Discovery Biology of NRG Therapeutics and scientific advisor for Odyssey Therapeutics. M.G. is a scientific advisor to BioAge Labs. The other authors declare no competing interests.

Figures
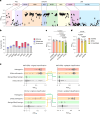
Fig. 1
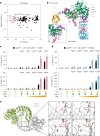
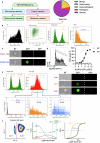
Fig. 1. ASC50 of NLRP3 variants is positively correlated with pathogenicity.
a, NLRP3 variants with ASC50 between 0 and 1. ASC-BFP HEK392T cells were analyzed using flow cytometry 12 h post-transfection (bottom). The location of each variant is color-coded as in the schematic diagram of NLRP3 domain organization (above). PYD, pyrin domain; FISNA, fish-specific NACHT-associated domain; NBD, nucleotide-binding domain; HD, helical domain; WHD, winged helix domain; trLRR, transition leucine-rich repeat domain; cnLRR, canonical LRR domain. b, Number of strongly active, moderately active or unknown significance variants relative to the length of each domain or subdomain. c, ASC50 of INEFVERS variants identified in patients with NOMID, MWS or FCAS or patients with overlapping symptoms. d, ASC50 of variants at R262 found in NOMID, MWS or patients with FCAS/MWS. e, ASC50 of 206 NLRP3 variants from INFEVERS (top) and 307 variants from ClinVar (bottom) grouped on classification before (left) and after (right) update. Each dot represents a single variant (a,c,e) or one independent repeat (d). Data were pooled from 3–12 independent repeats (n value for each variant is listed in Supplementary Table 1,a,c–e, mean and s.e.m. in a,ce). One-way analysis of variance (ANOVA) with Dunnett’s multiple-comparisons test in c,d).
Fig. 2
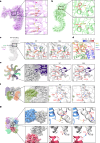
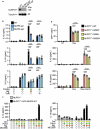
Fig. 2. Structural analysis of NLRP3 variants.
a,b. Distance between Cys261 and Phe304 or Cys261 in the inactive (a) or active (b) NLRP3 structure (PDB: 7PZC and 8EJ4). c, Molecular interactions of ATPγS with WT or mutant (Mut) NLRP3 (PDB: 8EJ4). d, Mapping of variants within contact range with ATPγS in active NLRP3 structure (PDB: 8EJ4). Residues are highlighted as sticks and in color scale based on the mean value of ASC50 of variants that occurred at the designated sites (n value for each variant is listed in Supplementary Table 1). e, Variants at the interface of active NLRP3 oligomers (PDB: 8EJ4). f, Variants at the interface of inactive NLRP3 decamer (PDB: 7PZC). g, Variants at the interface of PYD filament (PDB: 7PZD).
Fig. 3
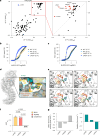
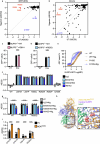
Fig. 3. The response of NLRP3 variants to nigericin.
a, Biplot for ASC50 of untreated (UT) and nigericin (2 μM) treated NLRP3 variants from the INFEVERS database with ASC50 between −1 and 1. Variants with significant increase in response to nigericin treatment are colored in red. b, Structural analysis of the location of nigericin-sensitive variants in the inactive NLRP3 conformation (PDB: 7PZC). c,d, Release of IL-1β and IL-18 from NLRP3–/–THP-1 cells reconstituted with WT, Y861H (c) or R920Q (d) with or without Pam3CSK4 (Pam3; 100 ng ml−1) for 14 h, followed by doxycycline (Dox; 100 ng ml−1) for 6 h and increasing amounts of nigericin (Nig.; 0.5 μM, 1 μM, 5 μM and 10 μM) for 1 h. e, Variants in the LRR domain of NLRP3 from the inactive decamer (PDB: 7PZC). Residues where variants can occur are highlighted as spheres (b) or sticks in red (e). Each dot represents a single variant (a) or an independent repeat (c,d). Data were pooled from 3–12 independent repeats (a, n value for each variant is listed in Supplementary Table 1) or 3 independent repeats (c,d, mean in a, mean and s.e.m. in c,d). Two-tailed t-test in c,d.
Fig. 4
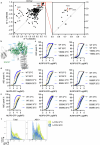
Fig. 4. The response of NLRP3 variants to cold temperature exposure.
a, Biplot for ASC50 of NLRP3 variants (INFEVERS database) incubated under 37 °C or 32 °C for 12 h. Left: undefined CAPS-associated NLRP3 variants, in blue. Right: FCAS-associated NLRP3 variants, in red. b,c, ASC speck percentage in the cell population with an increasing amount of NLRP3 expression for WT, L413V (b) or L413F (c) NLRP3 variants incubated under 37 °C or 32 °C. The same WT control data are used in b and c, as both were generated from the same experiment. d, Structural overview of the ATP-binding pocket in the active NLRP3 structure (PDB: 8EJ4). e, Amino acid annotation for WT, L413F, L413M and L413V in relation to ATPγS in the active NLRP3 structure (PDB: 8EJ4). The surface of the side chain is colored based on hydrophobicity (dark cyan for most hydrophilic, and dark goldenrod for most hydrophobic). f, ASC50 of untreated L413F, L413M and L413V variants colored based on associated clinical phenotype. g, Vibrational entropy and stability of L413F, L413M and L413V variants analyzed with DynaMut. Data were pooled from 3–12 independent repeats (a, n value for each variant is listed in Supplementary Table 1), or 3 independent repeats (b,c,f), each dot represents the mean value (ac) or an independent repeat (f) (mean and s.e.m. in b,c,f). One-way ANOVA with Dunnett’s multiple-comparisons test in f. MFI, mean fluorescence intensity.
Fig. 5
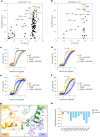
Fig. 5. The response of NLRP3 variants to MCC950.
a,b, Biplot for ASC50 of NLRP3 variants (INFEVERS database) incubated with or without MCC950 (10 μM) for 4 h (a) or 12 h (b). cf, ASC speck percentage in the cell population with an increasing amount of NLRP3 expression for WT or T428P or T438A NLRP3 variant with or without MCC950 (10 μM) treatment for 4 h (c,d) or 12 h (e,f). g, Structural annotation of variants that can disrupt the MCC950-binding pocket in the inactive NLRP3 structure (PDB: 7PZC). h, Prediction of ligand affinity between inactive NLRP3 (PDB: 7PZC) and MCC950 (PDB: 8GI) using mCSM-lig. Variants located in the PYD are colored in orange. Variants located in the NACHT domain are colored in blue. The same control data are used when results were generated from the same experiment (cf). Data were pooled from 3–12 independent repeats (a, n value for each variant is listed in Supplementary Table 1) or 3 independent repeats (cf), each dot represents the mean value of ASC50 for each NLRP3 variant (a,b) or mean and s.e.m. (cf).
Extended Data Fig. 1
Extended Data Fig. 1. ASC speck percentage is increased in cell populations with high NLRP3 expression.
a. Schematic diagram of NLRP3 variants and classification. b. Gating strategy for image-based flow cytometry analysis of ASC speck formation in ASC-BFP HEK293T cells. c. Representative images for ASC speck-negative and positive cells following gating as in b. d. Flow cytometry analysis of ASC speck percentage in cell groups with different levels of NLRP3 expression. e. Gating strategy (left) and representative images (right) for ASC speck percentage in cell populations with low, medium, or high level of NLRP3-GFP expression. Images were created using BioRender. f. Schematic diagram of automated ASC50 analysis progress. Cells were separated into a speck-positive and speck-negative population (left) and then analyzed based on the NLRP3-GFP signal (middle). The ASC percentage was calculated for each population with the same level of GFP expression. The EC50 was calculated based on the ASC percentage curve and the EC50 ratio was generated by comparing the mutant to wild-type (WT) NLRP3 (right). Data were pooled from 4 independent repeats (d, mean and s.e.m. in d) or representative of 3 independent repeats (b, c, e).
Extended Data Fig. 2
Extended Data Fig. 2. Analysis of NLRP3 variants using ASC50.
a. Correlation analysis for the association between the geometric mean which represents GFP-NLRP3 level and the ASC50 value for variants from INFEVERS and ClinVar database. b. Expression of human IL1B, IL18, NLRP3, PYCARD and NEK7 in THP-1, U937, HEK293T and healthy donor peripheral blood mononuclear cells (PBMCs) relative to ACTB. c. ASC50 of pathogenic and likely pathogenic variants that are germline, germline/mosaic or mosaic. d. ASC50 of NLRP3 with variants at A441 or E629 associated with different disease presentations. e. ASC50 of NLRP3 with variants identified at the same site associated with different disease presentations. NOMID, neonatal-onset multisystem inflammatory disease; MWS, Muckle–Wells syndrome; FCAS, familial cold autoinflammatory syndrome. Data are representative of 3 independent repeat (a) or collective of 3 independent repeats (b) or 5–11 independent repeats (c-e, n value for each variant is listed in Supplementary Table 1). One-way ANOVA with Dunnett’s multiple-comparisons test in c, d.
Extended Data Fig. 3
Extended Data Fig. 3. NLRP3 reconstitution in THP-1 cells.
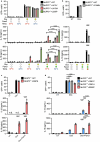
a. Immunoblot analysis of NLRP3 and tubulin in WT THP-1 cells or NLRP3 CRISPR-knockout using guide 1 or 2 (sg1 or 2). b. Release of IL-1β, IL-18 and IL-6 from NLRP3–/–THP-1 cells left untreated, or primed with Pam3CSK4 (Pam3, 100 ng/mL) for 14 hours and then with nigericin (Nig., 10 μM) for 3 hours or primed with Pam3CSK4 (Pam3, 100 ng/mL) and IFN-γ (1 μg/mL) for 24 hours and then treated with TcdB (200 ng/mL) for 14 hours. c. Release of IL-1β and IL-18 in NLRP3–/– or NLRP3–/– THP-1 cells reconstituted with GFP-tagged wild-type (WT) NLRP3 left untreated or treated with Pam3CSK4 (Pam3, 100 ng/mL) for 14 hours followed by doxycycline (Dox, 100 ng/mL) for 6 hours with or without MCC950 (10 μM), and then nigericin (Nig., 10 μM) for 1 hour. d. Percentage of cells expressing GFP and the release of IL-1β and IL-18 in NLRP3–/– THP-1 cells reconstituted with GFP-tagged wild-type (WT), R262P, R262L or R262W NLRP3 after treatment with Pam3CSK4 (Pam3, 100 ng/mL) for 14 hours and doxycycline (Dox, 100 ng/mL) for 6 hours. Data are representative of two independent repeats (a) or collective of three independent repeats (b-d, mean and s.e.m. in b-d). One-way ANOVA with Dunnett’s multiple-comparisons test in b, d. Source data
Extended Data Fig. 4
Extended Data Fig. 4. Inflammasome activity of NLRP3 variants of uncertain significance in reconstituted THP-1 cells.
a. Percentage of cells expressing GFP and the release of IL-1β and IL-18 in NLRP3–/– THP-1 cells reconstituted with GFP-tagged wild-type (WT), R172S, Q225P, R556*, R605G or Q705K NLRP3. Cells were either untreated or primed with Pam3CSK4 (Pam3, 100 ng/mL) for 14 hours followed by doxycycline (Dox, 100 ng/mL) for 6 hours, and then nigericin (Nig., 10 μM) for 1 hour. b. Percentage of cells expressing GFP and the release of IL-1β and IL-18 in PMA-induced, differentiated NLRP3–/– THP-1 cells reconstituted with GFP-tagged WT, R605G or Q705K NLRP3. Cells were either untreated or primed with LPS (50 ng/mL) for 3 hours followed by treatments with NLRP3 activators including imiquimod (Imq., 50 μM), LLOMe (50 μg/mL), monosodium urate crystals (MSU, 200 μg/mL) for 14 hours and nigericin (Nig., 10 μM) for 1 hour. Data were pooled from three independent repeats (a-b). One-way ANOVA with Dunnett’s multiple-comparisons test in a, b.
Extended Data Fig. 5
Extended Data Fig. 5. Analysis of inactive NLRP3 variants with ASC50 and structural rearrangements during NLRP3 activation.
a. NLRP3 variants with ASC50 between -15 and 0. ASC-BFP HEK392T cells were analyzed using flow cytometry 12 hours post-transfection (bottom). The location of each variant is color-coded as in the schematic diagram of NLRP3 domain organization (above). PYD, pyrin domain; FISNA, fish-specific NACHT-associated domain; NBD, nucleotide-binding domain; HD, helical domain; WHD, winged helix domain; trLRR, transition leucine-rich repeat domain; cnLRR, canonical LRR domain. b. ASC speck percentage in the cell population with an increasing amount of NLRP3 expression for wild-type (WT), R7C, R7H, D31V, Q45*, N62S, T46R, I74N, M70T, Q225P and R556* NLRP3 in ASC-BFP HEK392T cells 12 hours post-transfection with or without 1-hour nigericin (Nig., 2 μΜ) treatment. The same WT control data is used for each variant, except for R556*, when results were generated from the same experiment. c. Schematic of NLRP3 in its inactive form (PDB:7PZC) showing the pyrin domain (PYD) in light orange, fish-specific NACHT-associated domain (FISNA) in purple, NACHT domain subdomains including nucleotide-binding domain (NBD) in orange, helical domain 1 (HD1) in blue, winged helix domain (WHD) in green, HD2 in yellow, transition leucine-rich repeat domain (trLRR) in pink and canonical LRR domain (cnLRR) in blue on the left. NLRP3 inactive monomers assemble into the inactive decamer which can be disrupted by variants such as E690K and E692K. In response to the activation signal, NLRP3 switches into the active form and the active NLRP3 conformation can be stabilized by variants such as F304C. Active NLRP3 then forms NLRP3 disk-like structure which can be promoted by variants such as W416L, F445L, A441P, K437N. The pyrin domain in the active NLRP3 disk forms filament, and the interaction between each monomer can be strengthen by variants such as H51R and D21H. Data were pooled from 3–12 independent repeats (a, n value for each variant is listed in Supplementary Table 1) or 3 independent repeats (b). Each dot represents a single variant (a, mean and s.e.m. in a-b).
Extended Data Fig. 6
Extended Data Fig. 6. Activity of NLRP3 variants in response to nigericin treatment.
a-b. Biplot for the ASC50 of untreated (UT) and nigericin (2 μM) treated NLRP3 variants from the INFEVERS database (a) or the ClinVar database (b). c-d. Percentage of cells expressing GFP-tagged wild-type (WT), Y861H (c), R920Q (d) in reconstituted THP-1 cells treated with or without doxycycline (Dox, 100 ng/mL) for 6 hours. e. ASC speck percentage in the cell population with an increasing amount of NLRP3 expression for wild-type (WT), and F410S NLRP3 in ASC-BFP HEK392T cells 12 hours post-transfection with or without 1-hour nigericin (Nig., 2 μΜ) treatment. The same WT control data is used as in Extended Data Fig. 5 for R556*, as results were generated from the same experiment. f. ASC50 of NLRP3 variants treated with H2O, 50 mM,100 mM, or 1 M KCl for 12 hours simultaneously with plasmids expression. g. ASC50 of NLRP3 variants pre-treated with H2O, 50 mM,100 mM, or 1 M KCl, 30 mins prior to nigericin treatment. ASC50 is calculated in relative to the activity of each variant without nigericin treatment. h. Overlay of inactive NLRP3 in purple (PDB: 7PZC) with the NEK7-bound active NLRP3 in orange (PDB: 8EJ4). NEK7 is shown in green. Wild-type residues representing the location of Y861H and R920Q NLRP3 variants are highlighted as spheres in red. i. ASC50 for the NLRP3 variants overexpressed in ASC-BFP HEK293T cells with empty vector (EV) or mCherry-NEK7K64M. Each dot represents a single variant (a-b), or one independent repeat (c-d, f-g and i). Data were pooled from 3–12 independent repeats (a-b, n value for each variant is listed in Supplementary Table 1), or 3 (c-e, i), 2 (f), 4 (g) independent repeats (mean in a-b, mean and s.e.m. in c-g, i). Two-tailed t-test in c-d and i, one-way ANOVA with Dunnett’s multiple-comparisons test in g.
Extended Data Fig. 7
Extended Data Fig. 7. NEK7 is not required for activity of nigericin-sensitive NLRP3 variants.
a. Immunoblot analysis of NEK7, NLRP3 and β-actin in WT THP-1 cells or CRISPR-knockout of NEK7 or NEK7 and NLRP3 together. b. Release of IL-1β and IL-18 from wild-type (WT), NEK7–/–, NLRP3–/–NEK7–/– THP-1 cells left untreated, or primed with Pam3CSK4 (Pam3, 100 ng/mL) for 14 hours and then with nigericin (Nig., 10 μM) for 1 hour. c-d. Percentage of cells expressing GFP (c) and the release of IL-1β and IL-18 (d) in NLRP3–/–or NLRP3–/–NEK7–/– THP-1 cells reconstituted with GFP-tagged wild-type or G757R left untreated or primed with Pam3CSK4 (Pam3, 100 ng/mL) for 14 hours followed by 6 hours of doxycycline (Dox, 100 ng/mL) treatment. e-h. Percentage of cells expressing GFP and the release of IL-1β and IL-18 in NLRP3–/–NEK7–/– THP-1 cells reconstituted with GFP-tagged wild-type (WT), Y861H (e, f) or R920Q (g, h), untreated or primed with Pam3CSK4 (Pam3, 100 ng/mL) for 14 hours followed by 6 hours of doxycycline (Dox, 100 ng/mL) treatment and increasing concentrations of nigericin (Nig., 0.5 μM, 1 μM, 5 μM,10 μM) for 1 hour. Data was representative of 2 independent repeats (a), or pooled from 3 independent repeats (b-h). Each dot represents a single repeat (b-h, mean and s.e.m. in b-h). Two-tailed t-test in c, e, g, one-way ANOVA with Dunnett’s multiple-comparisons test in b, d, f, h. Source data
Extended Data Fig. 8
Extended Data Fig. 8. Cold temperature exposure can activate specific NLRP3 variants.
a. Biplot overview (left) and inset (right) for ASC50 of NLRP3 variants (ClinVar database) incubated under 37- or 32-°C for 12 hours. Variants with significant increase of ASC50 are colored in red. b. Structural annotation of the location of disease-associated temperature-sensitive variants, highlighted in the blue sphere, in the inactive structure of NLRP3 (PBD: 7PZC). The NACHT domain is highlighted in green. c-e. ASC speck percentage in the cell population with increasing amount of NLRP3 expression for wild-type (WT), Y565N, and Y565C (c), R262W, R262L, and R262P (d) or E629G, E629Q, and E629D (e) NLRP3 variants incubated under 37- or 32-°C. f. Histogram of L413 expression under 37- or 32-°C analyzed using flow cytometry. The same WT control data is used when results were generated from the same experiment (c-e). Each dot represents a single variant (a). Data were pooled from 3–12 independent repeats (a, n value for each variant is listed in Supplementary Table 1) or 3 independent repeats (c-e, mean in a, mean and s.e.m. in c-e) or representative of 3 independent repeats (f).
Extended Data Fig. 9
Extended Data Fig. 9. Cold temperature exposure and post-translational modification contribute to NLRP3 activity in THP-1 cells.
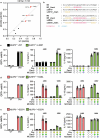
a. Percentage of cells expressing GFP and the release of IL-1β and IL-18 in NLRP3–/–THP-1 cells reconstituted with GFP-tagged wild-type (WT), L355P, L413M or L413V, untreated or primed with Pam3CSK4 (Pam3, 100 ng/mL) for 14 hours at 37 °C, followed by 6 hours of doxycycline (Dox, 50 ng/mL) treatment while incubating at 37 or 32 °C. b. Percentage of cells expressing GFP and the release of IL-1β and IL-18 in NLRP3–/–THP-1 cells reconstituted with GFP-tagged wild-type (WT) or S198N left untreated or primed with Pam3CSK4 (Pam3, 100 ng/mL) for 14 hours followed by 6 hours of doxycycline (Dox, 100 ng/mL) and nigericin (Nig., 10 μΜ) for 1 hour. c-d. Percentage of cells expressing GFP and the release of IL-1β and IL-18 in NLRP3–/–THP-1 cells reconstituted with GFP-tagged wild-type (WT), K567E (c), Y861C, Y861H or R262P (d) left untreated or primed with Pam3CSK4 (Pam3, 100 ng/mL) for 14 hours followed by 6 hours of doxycycline (Dox, 100 ng/mL). Each dot represents an independent repeat (a-d). Data were pooled from 3 independent repeats (a-d, mean and s.e.m. in a-d). One-way ANOVA with Dunnett’s multiple-comparisons test in a and d, two-tailed t-test in b-c.
Extended Data Fig. 10
Extended Data Fig. 10. Specific NLRP3 variants can resist inhibition by MCC950 in THP-1 cells.
a. Biplot for ASC50 of NLRP3 variants (ClinVar database) left untreated or treated with MCC950 (10 μΜ) for 12 hours while NLRP3 overexpression. b. Secondary structure prediction of wild-type (WT) and NLRP3 variants using Jpred 4. c-e. Percentage of cells expressing GFP and the release of IL-1β and IL-18 in NLRP3–/–THP-1 cells reconstituted with GFP-tagged wild-type (WT), L355P (c), T438P or T438A (d), E527V or E527K (e) left untreated or primed with Pam3CSK4 (Pam3, 100 ng/mL) for 14 hours followed by 6 hours of doxycycline (Dox, 100 ng/mL) together with or without MCC950 (10 μΜ). Each dot represents one variant (a) or one independent repeat (c-e). Data were pooled from 3–12 independent repeats (a, n value for each variant is listed in Supplementary Table 1) or 2-3 independent repeats (c-e, mean in a, mean and s.e.m. in c-e). One-way ANOVA with Dunnett’s multiple-comparisons test in in c-e.

References

    1. Blevins, H. M., Xu, Y., Biby, S. & Zhang, S. The NLRP3 inflammasome pathway: a review of mechanisms and inhibitors for the treatment of inflammatory diseases. Front. Aging Neurosci.14, 879021 (2022). - PMC - PubMed
    1. Broz, P. & Dixit, V. M. Inflammasomes: mechanism of assembly, regulation and signalling. Nat. Rev. Immunol.16, 407–420 (2016). - PubMed
    1. Fu, J. & Wu, H. Structural mechanisms of NLRP3 inflammasome assembly and activation. Annu. Rev. Immunol.41, 301–316 (2023). - PMC - PubMed
    1. Brinkschulte, R. et al. ATP-binding and hydrolysis of human NLRP3. Commun. Biol. 5, 1176 (2022). - PMC - PubMed
    1. Hochheiser, I. V. et al. Structure of the NLRP3 decamer bound to the cytokine release inhibitor CRID3. Nature604, 184–189 (2022). - PubMed

MeSH terms

Substances

LinkOut - more resources