. 2025 Mar;44(6):1804-1828.
doi: 10.1038/s44318-025-00376-6. Epub 2025 Feb 10.

Organoid modeling reveals the tumorigenic potential of the alveolar progenitor cell state

Affiliations

Organoid modeling reveals the tumorigenic potential of the alveolar progenitor cell state

Jingyun Li et al. EMBO J. 2025 Mar.

Abstract

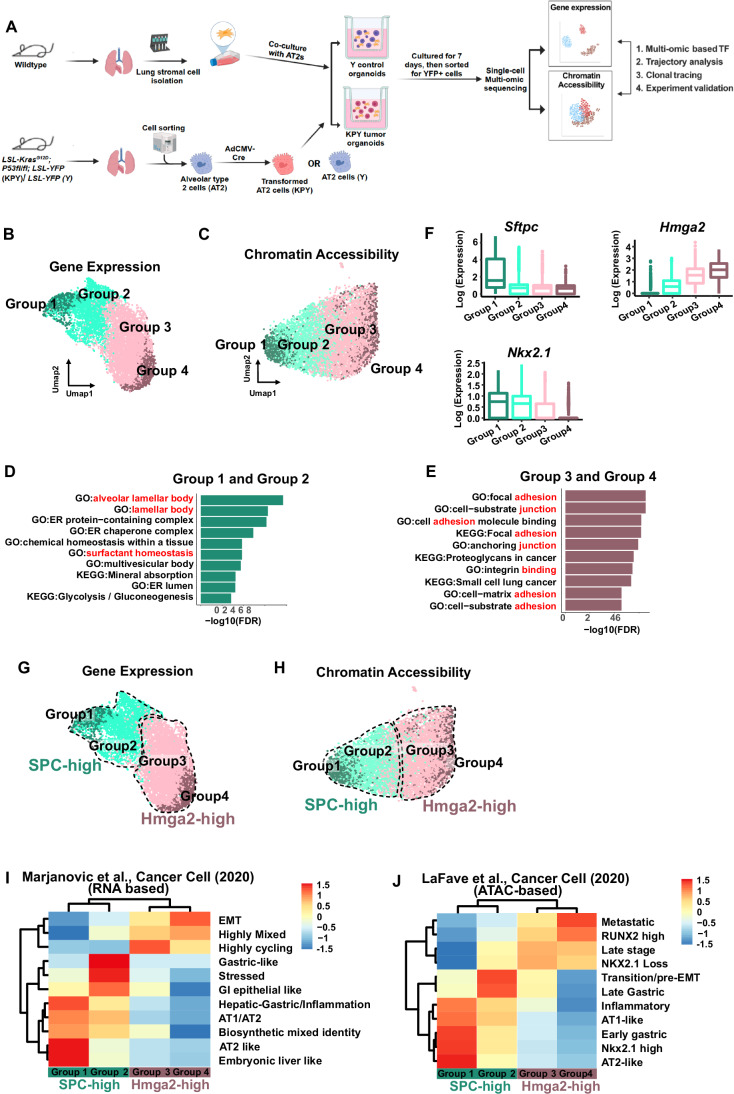
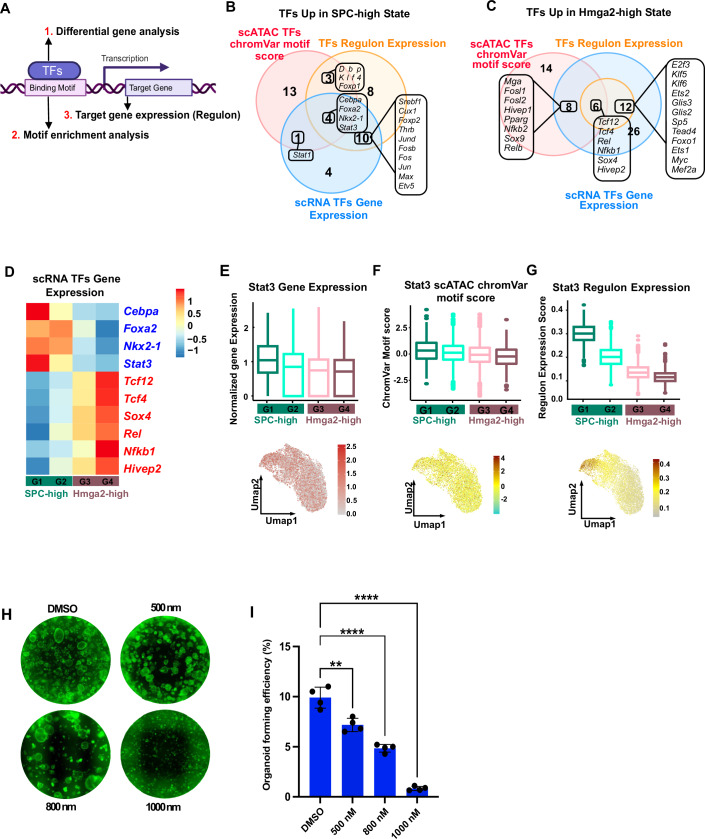
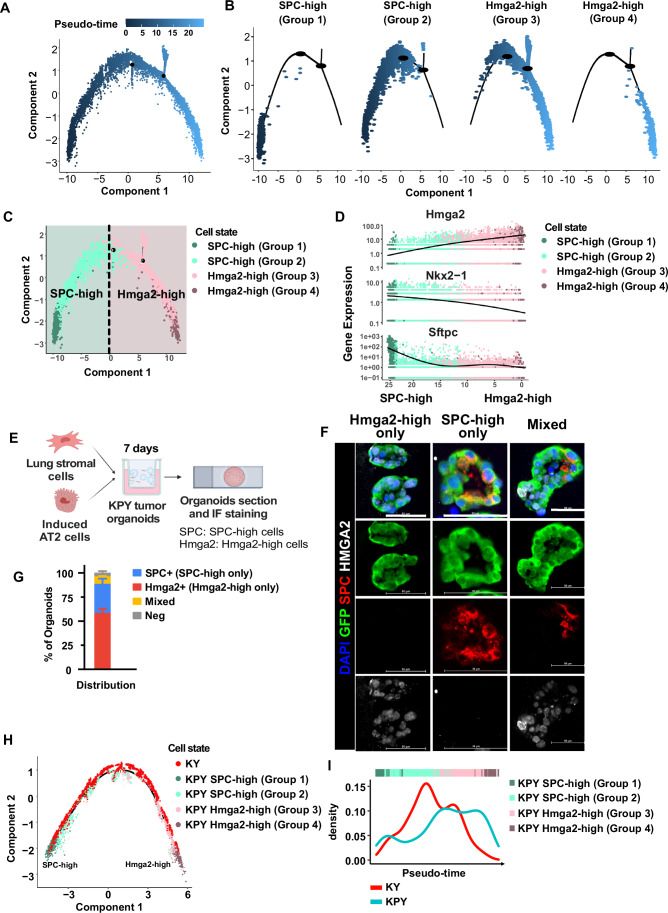
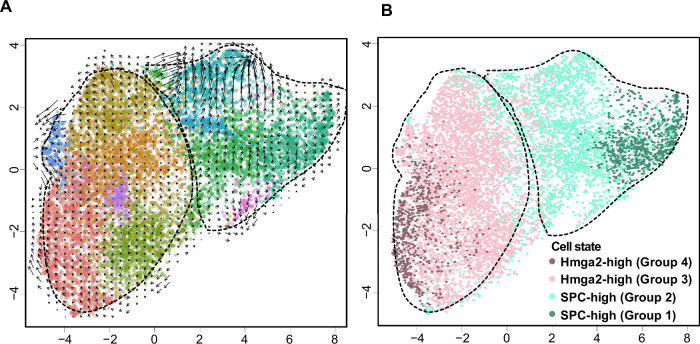
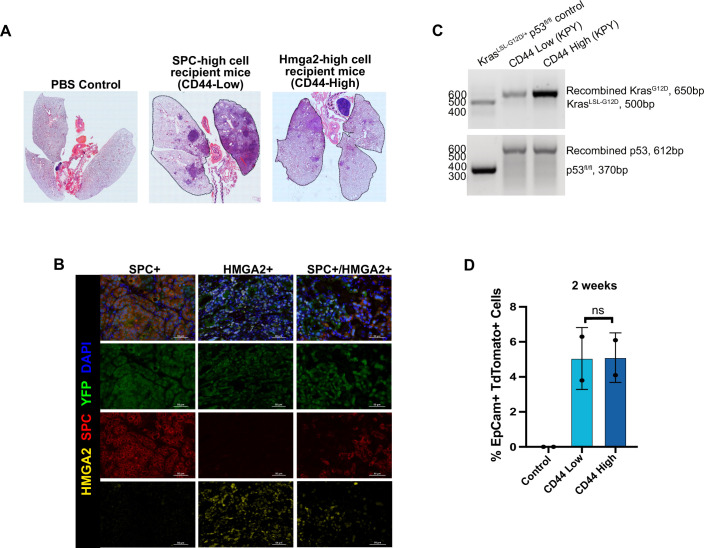
Cancers display cellular, genetic and epigenetic heterogeneity, complicating disease modeling. Multiple cell states defined by gene expression have been described in lung adenocarcinoma (LUAD). However, the functional contributions of cell state and the regulatory programs that control chromatin and gene expression in the early stages of tumor initiation are not well understood. Using single-cell RNA and ATAC sequencing in Kras/p53-driven tumor organoids, we identified two major cellular states: one more closely resembling alveolar type 2 (AT2) cells (SPC-high), and the other with epithelial-mesenchymal-transition (EMT)-associated gene expression (Hmga2-high). Each state exhibited distinct transcription factor networks, with SPC-high cells associated with TFs regulating AT2 fate and Hmga2-high cells enriched in Wnt- and NFκB-related TFs. CD44 was identified as a marker for the Hmga2-high state, enabling functional comparison of the two populations. Organoid assays and orthotopic transplantation revealed that SPC-high, CD44-negative cells exhibited higher tumorigenic potential within the lung microenvironment. These findings highlight the utility of organoids in understanding chromatin regulation in early tumorigenesis and identifying novel early-stage therapeutic targets in Kras-driven LUAD.

Keywords: Alveolar; Cell State; Kras; Lung Cancer; Organoids.


Conflict of interest statement

Disclosure and competing interests statement. We declare no competing interests. CFK and ALM are founders of Cellforma. CFK is a member of the EMBO Journal editorial advisory board.

Figures

Figure 1
Figure 1. Two cell states exist in tumor organoids which are marked by unique gene expression signatures and chromatin accessibility signatures.
(A) Experimental pipeline of using single cell multi-omic sequencing to analyze KPY tumor organoids. AT2, alveolar type 2 (AT2) cells. TF, Transcription factor. (B) Gene expression Umap showing the cell group identity. (C) Chromatin accessibility Umap showing the cell group identity. (D) Top 10 Gene ontology terms of genes highly expressed in Group 1 and Group 2. (E) Top 10 Gene ontology terms of genes highly expressed in Group 3 and Group 4. (F) Boxplots highlighting expression level (Log(TPX +1), color bar of Umaps and Y axis of boxplots) of selected genes. The central line represents the median, the box encompasses the interquartile range (IQR) (25th to 75th percentile), and the whiskers extend to the minimum and maximum values within 1.5 times the IQR. Outliers are shown as individual points beyond the whiskers. Group 1: n = 773; Group 2: n = 2514; Group 3: n = 4367; Group 4: n = 769. (G) Umap of gene expression assay showing the cell state definition in 7 days KPY organoids. (H) Umap of chromatin accessibility assay showing the cell state definition in 7 days KPY organoids. (I) Signature scores of gene programs (rows) (Marjanovic et al, 2020) in each cell state (columns). (J) Scores of chromatin co-accessibility modules (rows) (LaFave et al, 2020) in each cell state (columns).
Figure 2
Figure 2. Using scMulti-omic data to dissect the regulatory programs underlying tumor heterogeneity.
(A) Analysis strategy for identifying the transcription regulators underlying tumor heterogeneity. (B) Venn diagram showing the overlap of TFs enriched in SPC-high cells using differential gene analysis, chromVar motif score analysis and Regulon expression analysis. (C) Venn diagram showing the overlap of TFs enriched in Hmga2-high cells using differential gene analysis, chromVar motif score analysis and Regulon expression analysis. (D) Summary of all candidate regulators for SPC-high and Hmga2-high cells. The gene expression levels for each candidate regulator are shown using heatmaps. (EG) Showing candidate regulator for Spc-high cells. The gene expression level (E), motif enrichment score (F), and regulon expression score (G) of Stat3 are shown both in boxplots and Umap. The central line represents the median, the box encompasses the interquartile range (IQR) (25th to 75th percentile), and the whiskers extend to the minimum and maximum values within 1.5 times the IQR. Outliers are shown as individual points beyond the whiskers. G1: n = 773; G2: n = 2514; G3: n = 4367; G4: n = 769. (H) Representative images showing transwells with organoids grown from DMSO- and Stattic-treated KPY cells in co-culture (magnification = 4×). (I) Quantification of organoids forming efficiency of DMSO- and Stattic-treated KPY cells in co-culture. Each dot indicates one biological replicate (n = 4). The data represents the mean ± SD. p-Value was calculated using an unpaired t-test with Welch’s correction. p-Values = 0.0002, <0.0001, and <0.0001 (from bottom to top).
Figure 3
Figure 3. SPC-high cells and Hmga2-high cells represent distinct path for tumorigenesis.
(A) Monocle 3 pseudotime trajectory analysis of scMulti-omic sequencing expression data of KPY organoids. (B) Each cell state identified in Fig. 1G, H is illustrated in Monocle 3 pseudotime trajectory. (C) Monocle 3 pseudotime trajectory analysis of gene expression assay of single cells from KPY organoids. Cells are colored by cell state identity. (D) Gene expression level of selected genes along the pseudotime trajectory. Cells are colored by cell state identity. (E) Experiment strategy for identifying SPC-high cells and Hmga2-high cells in 7 days KPY organoids using IF staining. (SPC was used to label SPC-high cells; Hmga2 was used to label Hmga2-high cells) (F). Three types of KPY organoids, including Hmga2-high only (Hmga2+), SPC-high only (SPC +) and mixed (Hmga2 +/SPC+) based on immunofluorescence staining of SPC and Hmga2. (G) Quantification of the percentage of each type of organoids from (F). The data represents the mean ± SD (n = 3). (H) Monocle 3 pseudotime trajectory analysis of integrated data (see Methods) containing scMulti-omic sequencing expression data of KPY (KrasG12D/P53Loss/LSL-YFP) organoids and scRNA-seq data of KY (KrasG12D/LSL-YFP)organoids. Cells from KY organoids are colored Red. Cells from KPY organoids are colored by cell identity defined in Fig. 1G, H. (I) Density distribution of cells from KPY or KY organoids along the pseudotime trajectory. Source data are available online for this figure.
Figure 4
Figure 4. Co-culture with lung mesenchymal cells enhance the organoids forming ability of SPC-high cells but not Hmga2-high cells.
(A, B) Gene expression level of CD44 on Umap (A) and in four cell states (B). The central line represents the median, the box encompasses the interquartile range (IQR) (25th to 75th percentile), and the whiskers extend to the minimum and maximum values within 1.5 times the IQR. Outliers are shown as individual points beyond the whiskers. G1: n = 773; G2: n = 2514; G3: n = 4367; G4: n = 769. (C) IF staining indicates that CD44 co-stains with Hmga2. Scale bar, 100 μm. (D). FACS strategy to subset 7 days KPY organoids using CD44, then the CD44-high and CD44-neg population were cultured into organoids in co-culture or mono-culture condition. (E) qPCR showing that CD44 negative population expresses higher SPC-high lineage markers (Sftpc, Cd36, and St3gal5) and CD44 high population expresses higher Hmga2-high lineage markers (Hmga2, Cd44, and Slc4a11), the data represents the mean ± SD, sample size is 5 for each group. (F) Representative images showing transwells with organoids grown from SPC-high cells and Hmga2-high cells in Co-culture and Mono-culture conditions. (G) Summary of organoids forming efficiency of SPC-high cells and Hmga2-high cells in co-culture and mono-culture conditions. The data represents the mean ± SD, each dot indicates one biological replicate. Paired two-tailed t-test was performed, from left to right *p-Value = 0.034. N.s. p-Value = 0.43. (H) Quantification of the percentages of SPC+, Hmga2+ and mixed (Hmga2 + /SPC +) organoids in passage 1 organoids derived from SPC-high (CD44-neg) and Hmga2-high (CD44-high) cells in co-culture and mono-culture conditions. (I) Representative images of immunofluorescence staining of Stat3 and phospho-Stat3 in cytospin performed on CD44-Low vs. CD44-High cells (magnification = 4×, scale = 200 μm). (J) Quantification of phospho-Stat3 positive cells in CD44-Low vs. CD44-High cells. Each dot represents a field and the color of the dots (red and black) indicates two individual experiments (n = 2). p-Value was calculated using an unpaired t-test with Welch’s correction. p-Value = <0.0001. (K) qPCR showing increased expression of putative Stat3 target genes Abca3 and Etv5 in CD44-Low KPY organoid cells, compared to CD44-High cells. The data represents the mean ± SD (n = 4). p-value was calculated using an unpaired t-test with Welch’s correction. p-Values = 0.0043 and 0.0074 (from left to right). Source data are available online for this figure.
Figure 5
Figure 5. SPC-high cells have higher tumorigenic capacity than Hmga2-high cells in vivo.
(A) Experiment strategy for subsetting Hmga2-high cells and SPC-high cells and evaluating their ability to contribute to tumors in vivo using Orthotopic transplantation assay (see Methods). (B) Quantification of tumor burden in CD44-High and CD44-Neg recipient mice. Paired two-tailed t-test was performed, **p-Value = 0.009, the data represents the mean ± SD, each dot indicates one biological replicate. (C) HE staining shows representative tumors at different grades from CD44-Neg recipient mice and CD44-High recipient mice. Scale bar, 100 μm. (D) Quantification of the percentage of tumor at different grades in CD44-Neg and CD44-High recipient mice. The data represents the mean ± SD, paired two-tailed t-test was performed for significant analysis, *p-Value = 0.016 (Grade III), 0.047 (Grade II), 0.033 (Grade I). (E) Quantification of the percentage of each tumor type (SPC only, Hmga2 only, and mixed) in CD44-Neg, and CD44-High recipient mice. The data represents the mean ± SD, paired two-tailed t-test was performed for significant analysis, *p-Value = 0.076 (Mixed), 0.053 (SPC-only). (F) Model for oncogenic changes in AT2 cells after the onset of Kras activation and P53 Loss. Source data are available online for this figure.
Figure EV1
Figure EV1. related to Fig. 1. Cell state definition by combining gene expression assay and chromatin accessibility assay from one single cell.
(A) UMAP projection of scMulti-omic gene expression data of KPY and YFP control organoids. Cells are colored by RNA clusters. (B) UMAP projection of scMulti-omic gene expression data of KPY and YFP control organoids. Cells are colored by sample ID. (CE) Umap plots highlighting expression level (Log(TPX + 1), color bar of Umaps and Y axis of boxplots) of selected genes. (F) UMAP projection of scMulti-omic gene expression data of KPY organoids. Cells are colored by RNA clusters. (G) UMAP projection of scMulti-omic chromatin accessibility data of KPY organoids. Cells are colored by cell clusters identified in Fig. EV1F. (H) Each cluster identified from scMulti-omic gene expression data (Fig. EV1F) is illustrated in Chromatin accessibility UMAP. (I) Heatmap showing the highly expressed genes in each group of cells. (J) Umap plots highlighting expression level (Log(TPX + 1), color bar of Umaps and Y axis of boxplots) of selected genes.
Figure EV2
Figure EV2. related to Fig. 2.
(AC) Showing candidate regulator for SPC-high cells. The gene expression level (A), motif enrichment score (B) and Regulon expression score (C) of Nkx2.1 are shown both in boxplots and Umap. The central line represents the median, the box encompasses the interquartile range (IQR) (25th to 75th percentile), and the whiskers extend to the minimum and maximum values within 1.5 times the IQR. Outliers are shown as individual points beyond the whiskers. G1: n = 773; G2: n = 2514; G3: n = 4367; G4: n = 769. (DF) Showing candidate regulator for Hmga2-high cells. The gene expression level (D), motif enrichment score (E), and regulon expression score (F) of Nfkb1 are shown both in boxplots and Umap. The central line represents the median, the box encompasses the interquartile range (IQR) (25th to 75th percentile), and the whiskers extend to the minimum and maximum values within 1.5 times the IQR. Outliers are shown as individual points beyond the whiskers. G1: n = 773; G2: n = 2514; G3: n = 4367; G4: n = 769. (G, H) Summary of all candidate regulators for SPC-high and Hmga2-high cells. The motif enrichment score (G) and regulon expression score (H) for each candidate regulator are shown using heatmaps. (I) qPCR showing that Stattic treatment (800 nM) on day 7 KPY organoid cells reduced the expression of putative Stat3 target genes Abca3 and Etv5, compared to DMSO treatment. The data represents the mean ± SD (n = 2). P-value was calculated using an unpaired t-test with Welch’s correction. p-Values = 0.035 and 0.046 (from left to right).
Figure EV3
Figure EV3. related to Fig. 3. Pseudotime analysis reconstructs tumorigenesis trajectory in tumor organoids.
(A) RNA velocity analysis of 7 day KPY tumor organoids. (B) Cell states identity are plotted on the RNA velocity UMAP.
Figure EV4
Figure EV4. related to Fig. 4. Co-culture with lung mesenchymal cells enhanced the organoids forming ability of SPC-high cells but not Hmga2-high cells.
(A) FACS strategy for subsetting two cell states from 7 days KPY organoids using CD44. (B) Check the expression of CD44 in freshly sorted AT2 cells (DAPI-/CD31-/CD45-/EPCAM+/SCA1-). CD44 FMO control was used to set the CD44-neg and CD44-high gate. (C) Representative pictures of whole mount staining on 7 days KPY organoids in different conditions when the ratio between epithelial cells and mesenchymal cells is 1:10, 1:5, 1:2. (D) Bar plot showing the percentage of SPC+ organoids in three conditions when the ratio between epithelial cells and mesenchymal cells is 1:10, 1:5, 1:2. The data represents the mean ± SD. (E) Representative pictures of 7 days SPC+/Hmga2- organoids (SPC-high), SPC-/Hmga2+ organoids (Hmga2-high) and SPC + /Hmga2+ organoids (Mixed) derived from CD44-neg population in Co-culture and Mono-culture condition. Scale bar, 100 μm. (F) Representative pictures of 7 days SPC+/Hmga2- organoids (SPC-high), SPC-/Hmga2+ organoids (Hmga2-high) and SPC+/Hmga2+ organoids (Mixed) derived from CD44-high population in Co-culture and Mono-culture condition. Scale bar, 100 μm.
Figure EV5
Figure EV5. related to Fig. 5. SPC-high cells have higher tumorigenic capacity than Hmga2-high cells in vivo.
(A) HE staining of lungs from PBS control, CD44-neg, and CD44-high recipient mice. (B) IF staining showing the expression of SPC and Hmga2 in lesions from tumor organoids recipient mice. Both CD44-neg recipient mice and CD44-high recipient mice can derive SPC+, HMGA2+, SPC+/HMGA2+ tumors. Scaled bar = 50 μM. (C) Recombination PCR data showing no amplified bands corresponding to the unrecombined Kras or p53 alleles in both the CD44-low and CD44-high KPY cell population. (D) Bar diagram quantifying the percentage of DAPI-/EpCam+/TdTomato+ from mice injected with CD44-low and -high organoid cells. N.s. non-significant. The data represents the mean ± SD. p-value was calculated using an unpaired t-test with Welch’s correction. p-Value = 0.9780 (compare light blue vs. dark blue bars).

Update of

References

    1. Aibar S, González-Blas CB, Moerman T, Huynh-Thu VA, Imrichova H, Hulselmans G, Rambow F, Marine JC, Geurts P, Aerts J et al (2017) SCENIC: single-cell regulatory network inference and clustering. Nature methods 14:1083–1086. - PMC - PubMed
    1. Barbie DA, Tamayo P, Boehm JS, Kim SY, Moody SE, Dunn IF, Schinzel AC, Sandy P, Meylan E, Scholl C et al (2009) Systematic RNA interference reveals that oncogenic KRAS-driven cancers require TBK1. Nature 462:108–112 - PMC - PubMed
    1. Caetano MS, Hassane M, Van HT, Bugarin E, Cumpian AM, McDowell CL, Cavazos CG, Zhang H, Deng S, Diao L et al (2018) Sex specific function of epithelial STAT3 signaling in pathogenesis of K-ras mutant lung cancer. Nat Commun 9:1–11 - PMC - PubMed
    1. Camolotto SA, Pattabiraman S, Mosbruger TL, Jones A, Belova VK, Orstad G, Streiff M, Salmond L, Stubben C, Kaestner KH et al (2018) FoxA1 and FoxA2 drive gastric differentiation and suppress squamous identity in NKX2-1-negative lung cancer. Elife 7:1–28 - PMC - PubMed
    1. Cassel TN, Nord M (2003) C/EBP transcription factors in the lung epithelium. Am J Physiol Lung Cell Mol Physiol 285:L773–L781 - PubMed

MeSH terms