

Sensitive detection of miR-21 and miR-25 in gastric adenocarcinoma patient serum using a SERS sensor based on AuNT and enzyme cleavage strategy
- PMID: 39931404
- PMCID: PMC11808354
- DOI: 10.1039/d4ra08761e
Sensitive detection of miR-21 and miR-25 in gastric adenocarcinoma patient serum using a SERS sensor based on AuNT and enzyme cleavage strategy
Abstract
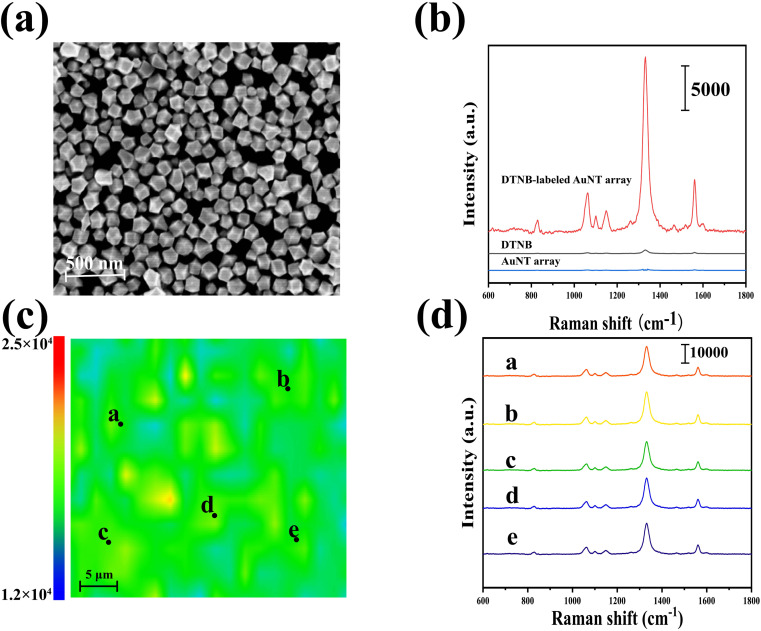
MicroRNA (miRNA) detection has significant application value for early cancer diagnosis. In this study, a surface-enhanced Raman scattering (SERS) sensor was developed for detecting miR-21 and miR-25 in the serum of Gastric adenocarcinoma (GAC) patients. The sensor was constructed using arrays of Au trioctahedral nanoparticles (AuNT) and enzyme cleavage techniques. The AuNT was obtained by self-assembly at the oil-water interface, and the Cy5-labeled miR-21 and 5-FAM-labeled miR-25 complementary single-stranded ssDNA-21 and ssDNA-25 were connected with the AuNT to form the SERS sensor. When miR-21 and miR-25 were present, ssDNA-21 and ssDNA-25 were paired and hybridized to form miR-21-ssDNA-21 and miR-25-ssDNA-25 double strands. Duplex-specific nuclease (DSN) could act on the DNA phosphodiester bond in the double strand, causing Cy5 and 5-FAM to be far away from the AuNT, which resulted in a reduction of the SERS signal. In the range of 10 aM to 1 pM, the logarithm of miR-25 concentration was linearly related to the intensity of the characteristic peak of 5-FAM at 1178 cm-1, and the limit of detection (LOD) was determined to be 8.12 aM. The logarithm of miR-21 concentration was linearly related to the characteristic peak intensity of Cy5 at 1367 cm-1, and the LOD was determined to be 4.29 aM. Furthermore, the accuracy of the SERS sensor for the detection of miR-21 and miR-25 in clinical serum samples was evaluated using real-time quantitative polynucleotide chain reaction (qRT-PCR) technology as the gold standard. The relative errors of the two methods miR-21 in healthy people and gastric adenocarcinoma patients were 1.71% and -2.40%. The relative errors of miR-25 were 2.74% and -2.67%. There was no significant difference between the two methods, and the expression levels of miR-21 and miR-25 in the serum of GAC patients were found to be higher than those in healthy individuals. Consequently, this method offers a reliable solution for the early diagnosis of gastric cancer.
This journal is © The Royal Society of Chemistry.
Conflict of interest statement
There are no conflicts to declare.
Figures


Similar articles
-
A microfluidic-based SERS biosensor with multifunctional nanosurface immobilized nanoparticles for sensitive detection of MicroRNA.Anal Chim Acta. 2022 Aug 15;1221:340139. doi: 10.1016/j.aca.2022.340139. Epub 2022 Jul 1. Anal Chim Acta. 2022. PMID: 35934371
-
Enzyme-free sensitive SERS biosensor for the detection of thalassemia-associated microRNA-210 using a cascade dual-signal amplification strategy.Anal Chim Acta. 2024 Mar 1;1292:342255. doi: 10.1016/j.aca.2024.342255. Epub 2024 Jan 16. Anal Chim Acta. 2024. PMID: 38309848
-
Efficient and accurate detection of GC-associated miR-96-5p using a competitive lateral flow method based on SERS.RSC Adv. 2024 Oct 8;14(43):31809-31819. doi: 10.1039/d4ra03880k. eCollection 2024 Oct 1. RSC Adv. 2024. PMID: 39380650 Free PMC article.
-
Frequency shift Raman-based sensing of serum MicroRNA for ultrasensitive cervical cancer diagnosis.Photodiagnosis Photodyn Ther. 2024 Apr;46:104105. doi: 10.1016/j.pdpdt.2024.104105. Epub 2024 Apr 25. Photodiagnosis Photodyn Ther. 2024. PMID: 38677498
-
Ultra-sensitive and high efficiency detection of multiple non-small cell lung cancer-related miRNAs on a single test line in catalytic hairpin assembly-based SERS-LFA strip.Anal Chim Acta. 2021 Sep 15;1178:338800. doi: 10.1016/j.aca.2021.338800. Epub 2021 Jun 26. Anal Chim Acta. 2021. PMID: 34482860
References
-
- Zhang Z. Z. Zhu C. C. Cao H. Zhonghua wei chang wai ke za zhi. 2024;27:137–142. - PubMed
-
- Sun X. Zhang J. J. Inf. Process. Syst. 2017;13:1527–1543.
LinkOut - more resources
Full Text Sources
Miscellaneous