. 2025 Feb;55(2):e202451651.
doi: 10.1002/eji.202451651.

ISG15-Dependent Stabilisation of USP18 Is Necessary but Not Sufficient to Regulate Type I Interferon Signalling in Humans

Affiliations

ISG15-Dependent Stabilisation of USP18 Is Necessary but Not Sufficient to Regulate Type I Interferon Signalling in Humans

Andri Vasou et al. Eur J Immunol. 2025 Feb.

Abstract

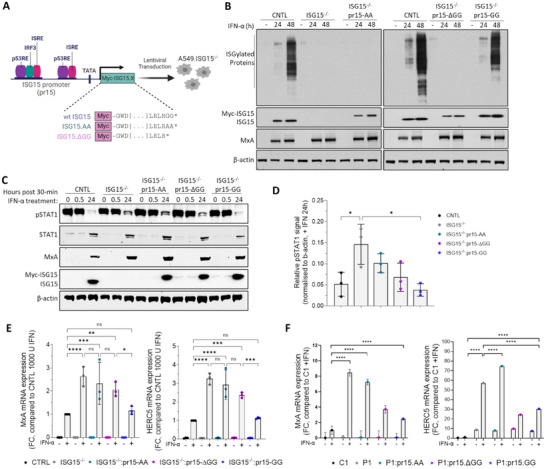
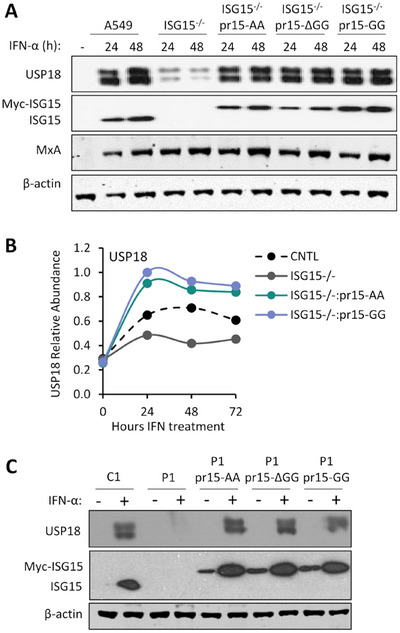
Type I interferon (IFN) signalling induces the expression of several hundred IFN-stimulated genes (ISGs) that provide an unfavourable environment for viral replication. To prevent an overexuberant response and autoinflammatory disease, IFN signalling requires tight control. One critical regulator is the ubiquitin-like protein IFN-stimulated gene 15 (ISG15), evidenced by autoinflammatory disease in patients with inherited ISG15 deficiencies. Current models suggest that ISG15 stabilises ubiquitin-specific peptidase 18 (USP18), a well-established negative regulator of IFN signalling. USP18 also functions as an ISG15-specific peptidase that cleaves ISG15 from ISGylated proteins; however, USP18's catalytic activity is dispensable for controlling IFN signalling. Here, we show that the ISG15-dependent stabilisation of USP18 involves hydrophobic interactions reliant on tryptophan 123 (W123) in ISG15. Nonetheless, while USP18 stabilisation is necessary, it is not sufficient for the regulation of IFN signalling; ISG15 C-terminal mutants with significantly reduced affinity still stabilised USP18, yet the magnitude of signalling resembled ISG15-deficient cells. Hence, USP18 requires non-covalent interactions with the ISG15 C-terminal diGlycine motif to promote its regulatory function. It shows ISG15 is a repressor of type I IFN signalling beyond its role as a USP18 stabiliser.

Keywords: ISG15; Type I IFN signalling; USP18; autoinflammatory disease; interferonopathy; interferon‐stimulated genes.


Conflict of interest statement

The authors declare no conflicts of interest.

Figures

FIGURE 1
FIGURE 1
Functional characterization of A549‐ISG15−/− cell lines reconstituted with the C‐terminal ISG15 mutants. (A) Schematic presentation of the lentiviral technology used to reconstitute ISG15 expression in A549‐ISG15−/− using an inducible system where expression of ISG15 is under the control of its native promoter (pr15). The induction of pr15 is regulated by transcription factors physiologically upregulated by innate immune responses (e.g., IRF3 and ISGF3) or cell‐cycle regulators (e.g., p53). Image created with Biorender.com (B) Immunoblot analysis of ISG15 expression induced by IFN‐α treatment. A549 (CNTL), ISG15−/− and ISG15.AA‐, ΔGG‐, and GG‐expressing derivatives were treated with 1000 IU/mL IFN‐α for 24 and 48 h or left untreated. Whole‐cell extracts were prepared and ISG15, MxA, and β‐actin proteins were analysed by immunoblot. (C) A549 (CNTL), 1SG15−/− and ISG15.AA‐, ΔGG‐, GG‐expressing derivatives were treated with 1000 IU/mL IFN‐α for 30 min, then extensively washed and media without IFN replaced. Cells were harvested at 0 and 30 min and 24 h after IFN‐α removal and phopho‐STAT1, total STAT1, MxA, ISG15, and β‐actin were detected by immunoblot. (D) Experiments in (C) were performed on three independent occasions and phospho‐STAT1 levels after 24 h IFN‐α removal were quantified using Image Studio software (LI‐COR). Error bars represent the SD of the mean and statistical significance was assessed using one‐way ANOVA and Sidak post‐tests. Data in lanes 1–6 have previously been reported (21) (E) A549 (CNTL), ISG15−/− and ISG15.AA‐, ΔGG‐, GG‐expressing derivatives were treated with 1000 IU/mL IFN‐α for 24 h. Expression of ISGs was tested using reverse transcription quantitative PCR (RT‐qPCR) with primers specific for MxA and HERC5. Relative expression was determined following SYBR Green quantitative PCR (qPCR) using the ΔΔCt method. β‐Actin expression was used to normalize between samples. Data are presented as a mean fold increase relative to IFN‐α‐treated A549 control cells (set to 1). (F) hTert‐immortalized ISG15‐deficient patient‐derived dermal fibroblasts (P1) transduced with ISG15.GG (wt) and C‐terminal mutants (ISG15.AA and ISG15.ΔGG) were treated with 1000 IU/mL IFN‐α for 12 h, or left untreated, washed, and incubated in media without IFN‐α for 24 h. MxA and HERC5 expression was analyzed as in (E) with data presented as fold increase relative to non‐IFN‐α treated P1. Error bars (in E and F) represent the SD of the mean from three independent experiments performed on different occasions. Each experiment additionally included three technical replicates. Statistical significance was assessed using two‐way ANOVA and the Tukey multiple comparisons test. *p < 0.05, **, p < 0.01, ***p < 0.001, ****p < 0.0001, n.s., no statistical significance.
FIGURE 2
FIGURE 2
The ability of ISG15 C‐terminus to regulate IFN‐α signalling influences viral infection. (A) A549 (CNTL), ISG15−/− and ISG15.AA‐, ISG15.ΔGG‐, and ISG15.GG‐expressing derivatives were treated with 1000 IU/mL IFN‐α for 18 h and then infected with rPIV5‐cherry (MOI 10). Cells were harvested at 24 and 48 h p.i. and processed for immunoblot analysis using antibodies specific for PIV5 NP, STAT1, MxA, ISG15, and β‐actin. Reconstituted ISG15 expression was under the control of a cloned ISG15 promoter (pr15) and was therefore IFN‐inducible. (B) Experiments described in (A) were performed independently three times (infections were performed on three separate occasions), and NP and β‐actin levels were quantified using Image Studio software (LI‐COR Biosciences). Signals were relative to those generated from IFN‐α‐treated A549 cells infected for 48 h p.i. (set to 100%). Error bars = SD. Statistical significance was assessed using two‐way ANOVA and Tukey multiple comparisons test; ****p < 0.0001, n.s., no statistical significance. (C) Fluorescent imaging of mCherry expression, indicative of rPIV5‐mCherry infection in A549, ISG15−/− and ISG15.AA‐, ISG15.ΔGG‐ and ISG15.GG‐expressing A549‐ISG15−/−. Cells were treated with 1000 IU/mL IFN‐α for 18 h and then infected with rPIV5‐mCherry (MOI 10) and imaged at 48 h post‐infection (h.p.i.). (D) Experiments described in (C) were performed with hTert‐immortalized dermal fibroblasts. C1 are cells from ISG15+/+ donor and P1 are from an ISG15−/− donor. Images were taken 38 h p.i.
FIGURE 3
FIGURE 3
The C‐terminal di‐Gly motif of ISG15 is not required for USP18 stabilization. (A) Immunoblot analysis of USP18 expression in A549 (CNTL), ISG15−/− and ISG15.AA‐, ΔGG‐, GG‐expressing derivatives after treatment with 1000 IU/mL IFN‐α for 24 h. Whole‐cell extracts were prepared and USP18, ISG15, MxA, and β‐actin protein levels were analyzed by immunoblot. (B) USP18 abundance in A549 (CNTL), ISG15−/‐ and ISG15.AA and ISG15.GG‐expressing derivative cells measured using quantitative tandem mass tags (TMT)‐based proteomic analysis. Indicated cells were treated with 1000 IU/mL IFN‐α for the indicated times (‘0 h’ cells were not treated with IFN‐α and harvested at 72 h). (C) hTert‐immortilized dermal fibroblasts from a ISG15+/+ donor (C1), from an ISG15−/− donor (P1) and P1 cells reconstituted with IFN‐inducible (pr15) ISG15.AA, ISG15.ΔGG and ISG15.GG. Cells were treated with 1000 IU/mL IFN‐α, or not treated, for 48 h. Whole‐cell extracts were prepared and USP18, ISG15 and β‐actin protein levels were analyzed by immunoblot.
FIGURE 4
FIGURE 4
Tryptophan 123 (Trp123/W123) in ISG15 is required for USP18 stability and the C‐terminal tail of ISG15 is crucial for the regulation of type I IFN signalling. (A) AlphaFold2 model representing a complex between the ISG15 binding box 1 (IBB‐1) in hUSP18 (grey; Uniprot ID: Q9UMW8) and the hydrophobic pocket that accommodates the W123 side chain from hISG15 (blue; Uniprot ID: P05161) along with an amino acid sequence alignment of the corresponding region of mIsg15 (W121) and hISG15 (W123). (B) A549‐ISG15−/− were reconstituted with ISG15‐W123R under the control of the ISG15 promoter (pr15) and was therefore IFN‐inducible. A549, A549‐ISG15−/− and A549‐ISG15−/−‐pr15‐W123R were treated with 1000 IU/mL IFN‐α for 24 h. Whole‐cell extracts were prepared and USP18, ISG15 and β‐actin protein levels were analyzed by immunoblot. (C) A549, A549‐ISG15−/− and A549‐ISG15−/−‐pr15‐W123R were treated with 1000 IU/mL IFN‐α for 24 h and MxA and HERC5 expression was measured by RTqPCR (see Figure 1E for details). (D) Immunoprecipitation of Myc‐tagged ISG15.AA‐, ΔGG‐, and GG after treatment with 1000 IU/mL IFN‐α for 24 h. An ISG15−/− cell line expressing a non‐tagged form of ISG15 was used as a negative control (left lane) and an ISG15.GG‐expressing 1SG15−/−.UBA7−/− cell line was used as an ISGylation‐deficient control (final lane). ISG15 was immunoprecipitated (IP) using anti‐c‐Myc antibodies covalently coupled to magnetic beads. Immunoprecipitates (top) and whole cell lysates (WCL; bottom) were subject to immunoblot analysis with antibodies to USP18, ISG15, and UBA7. ISG15 expression in reconstituted cell lines was under the control of the ISG15 promoter (pr15) and was therefore inducible by IFN. Data representative of at least three independent assays. (E) SDS‐PAGE gel of purified and maleimide BODIPY labelled ISG15 and C‐terminal variants: Coomassie‐stained gel (500 ng protein per lane; left) and fluorescence detection (50 ng protein per lane; right). (F) Analysis of hISG15 (and C‐terminal variants) and hUSP18 binding using fluorescence polarization (FP). GST was used as a negative control. Reactions were performed independently three times. The mean Kd values are shown with error bars (and bracketed values in the summary table) represent the standard deviation. Statistical significance was assessed using one‐way ANOVA and Tukey multiple comparisons test, *p < 0.01, n.s., no statistical significance.
FIGURE 5
FIGURE 5
Functional characterization of catalytically inactive and ISG15‐binding mutants of USP18. (A) Immunoprecipitation of Flag‐tagged wt and mutant forms of USP18 in HEK293T cells co‐transfected with wt ISG15 (ISG15.GG) as indicated. Cells were lysed 48 h post‐transfection and lysates were immunoprecipitated with Flag‐specific antibodies covalently coupled to magnetic beads. Immunoprecipitants (top) and whole cell lysates (WCL; bottom) were subject to immunoblot with antibodies to USP18 and ISG15. (B) Immunoprecipitation of V5‐tagged IFNAR2 cytoplasmic domain in HEK293T cells co‐transfected with STAT2‐Myc, USP18.wt‐Flag, USP18.I60N‐Flag, or USP18.C64S‐Flag plasmids as indicated. Cells were lysed at 48 h post‐transfection and lysates were immunoprecipitated with anti‐V5 antibody coupled to protein G dynabeads. Following immunoblotting, immunoprecipitants (V5‐IP; top) and proteins from whole cell lysates (WCL; bottom) were detected with antibodies to anti‐V5 epitope tag, STAT2 and USP18. (C) Schematic presentation of the lentiviral technology used to reconstitute USP18 expression in A549‐USP18−/− using an inducible system where USP18 expression is driven by the ISG15 promoter (pr15). Image created with Biorender.com (D) Immunoblot analysis of USP18 expression induced by IFN‐α treatment. A549 (CNTL), USP18−/− and USP18.wt‐, I60N‐, and C64S‐expressing cell lines were treated with 1000 IU/mL IFN‐α for 48 h or left untreated. Whole‐cell extracts were prepared and USP18, ISG15, MxA, and β‐actin protein levels were analyzed by immunoblot.
FIGURE 6
FIGURE 6
ISG expression is dysregulated in cells expressing USP18 mutant unable to bind ISG15. (A) A549 control cells expressing NC1 non‐targeting guide RNA (NC1‐CNTL), A549‐USP18−/−, and USP18.wt, I60N‐, C64S‐expressing derivatives (where USP18 expression was under the control of the ISG15 promoter (pr15) and therefore inducible by IFN) were treated with 1000 IU/mL IFN‐α for 16 h. Expression of ISGs was tested using reverse transcription quantitative PCR (RT‐qPCR) with primers specific for MxA and HERC5. Relative expression was determined following SYBR Green quantitative PCR (qPCR) using the ΔΔCt method. β‐Actin expression was used to normalize between samples. Data shown represent mean values from three independent experiments performed on different occasions; error bars = SD. Statistical significance was assessed using two‐way ANOVA and Tukey multiple comparisons test; *p < 0.05, **p < 0.01, ***p < 0.001, n.s., no statistical significance. (B) A549 NC1‐CNTL, A549‐USP18−/−, and USP18.wt‐, I60N‐, C64S‐expressing derivatives were pre‐treated with 1000 IU/mL IFN‐α for 16 h and then infected with rPIV5‐mCherry (MOI 10). Cells were harvested at 24 and 48 h.p.i. and processed for immunoblot analysis using antibodies specific for PIV5 NP, STAT1, USP18, and β‐actin. (C) Experiments described in (B) were performed independently three times (infections were performed on three separate occasions), and NP and β‐actin levels were quantified using Image Studio software (LI‐COR Biosciences). Signals were normalized to IFN‐a‐treated A549 cells infected for 48 h p.i. (set to 100%). Data shown represent mean values from three independent experiments; error bars = SD. Statistical significance was assessed using two‐way ANOVA and Tukey multiple comparisons test; ****p < 0.0001, n.s., no statistical significance. (D) Fluorescent imagining of mCherry expression, indicative of rPIV5‐mCherry infection, at 48 h p.i time point of the experiment described in (B).
FIGURE 7
FIGURE 7
The ISG15‐USP18 interaction is important for desensitization of IFN‐α signalling. (A) A549 control cells expressing NC1 non‐targeting guide RNA (NC1‐CNTL), A549‐USP18−/− and USP18.wt‐, I60N, and C64S‐expressing cells were primed with 2000 IU/mL IFN‐α (equivalent to 20 ng/mL) for 8 h or left untreated. Cells were washed and re‐incubated in a medium without IFN for 16 h and then stimulated with 2000 IU/mL IFN‐α for 30 min. Cell lysates were subject to immunoblot analysis with antibodies to anti‐phospho‐STAT1, USP18, and β‐actin. Reconstituted USP18 expression was under the control of a clone ISG15 promoter (pr15) and was therefore IFN‐inducible. (B) Experiments described in (A) were performed independently three times, and phospho‐STAT1 and β‐actin levels were quantified using Image Studio software (LI‐COR Biosciences). Signals are presented as ratios of primed to non‐primed control (a ratio of 1 is equivalent to no change). (C, D) Experiments in (A) and (B) were repeated with A549 (NC1‐CNTL), A549‐ISG15−/−, and ISG15.AA‐ or ISG15.GG‐expressing cells. Reconstituted ISG15 expression was under the control of a clone's ISG15 promoter (pr15) and was therefore IFN‐inducible. Data shown represent mean values from three independent experiments; error bars = SD. Statistical significance was assessed using one‐way ANOVA and Tukey multiple comparisons test; *p < 0.05, **p < 0.01, ***p < 0.001, ****p < 0.0001, n.s., no statistical significance.

References

    1. Ivashkiv L. B. and Donlin L. T., “Regulation of Type I Interferon Responses,” Nature Reviews Immunology 14 (2014): 36–49, 10.1038/nri3581. - DOI - PMC - PubMed
    1. Isaacs A. and Lindenmann J., “Virus Interference. I. The Interferon,” Proceedings of the Royal Society of London Series B: Biological Sciences 147 (1957): 258–267, 10.1098/rspb.1957.0048. - DOI - PubMed
    1. Kim S. H., Cohen B., Novick D., and Rubinstein M., “Mammalian Type I Interferon Receptors Consists of Two Subunits: IFNaR1 and IFNaR2,” Gene 196 (1997): 279–286, 10.1016/S0378-1119(97)00240-0. - DOI - PubMed
    1. Gauzzi M. C., Velazquez L., McKendry R., Mogensen K. E., Fellous M., and Pellegrini S., “Interferon‐alpha‐dependent Activation of Tyk2 Requires Phosphorylation of Positive Regulatory Tyrosines by another Kinase,” Journal of Biological Chemistry 271 (1996): 20494–20500, 10.1074/jbc.271.34.20494. - DOI - PubMed
    1. Li X., Leung S., Kerr I. M., and Stark G. R., “Functional Subdomains of STAT2 Required for Preassociation With the Alpha Interferon Receptor and for Signalling,” Molecular and Cellular Biology 17 (1997): 2048–2056, 10.1128/mcb.17.4.2048. - DOI - PMC - PubMed

LinkOut - more resources