. 2025 Feb;55(2):e202350975.
doi: 10.1002/eji.202350975.

Dynamic Activation of NADPH Oxidases in Immune Responses Modulates Differentiation, Function, and Lifespan of Plasma Cells

Affiliations

Dynamic Activation of NADPH Oxidases in Immune Responses Modulates Differentiation, Function, and Lifespan of Plasma Cells

Olivia T M Bucheli et al. Eur J Immunol. 2025 Feb.

Abstract

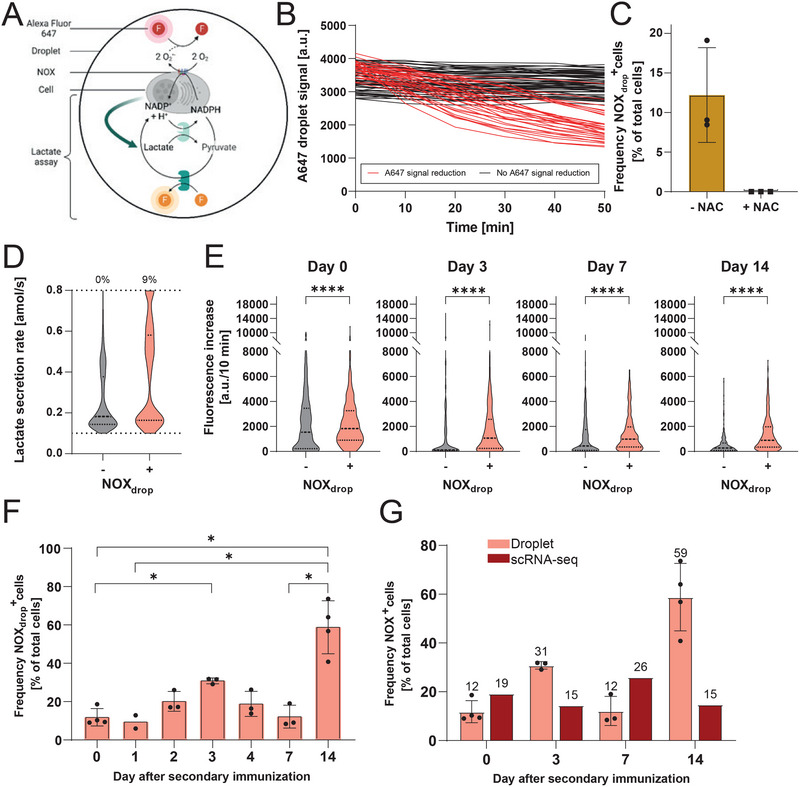
NADPH-oxidase (NOX)-derived reactive oxygen species (ROS) have been described to play essential roles in B-cell activation processes. However, several key questions concerning NOX activity and subsequent ROS production remain unaddressed, including fundamental processes such as differentiation, functional competence, cellular metabolism, and viability. This study investigated these questions in a murine B-cell response after secondary immunization. We combined single-cell transcriptomics and single-cell detection of NOX activity and observed that various subsets of B cells dynamically express NOX1 and NOX2. The NOX+ cellular phenotype correlated with increased activity of metabolic pathways, augmented lactate production, lower IgG secretion rates, and markers for longevity. The NOX+ cellular phenotype was also associated with increased cellular stress and apoptosis, underscoring the intricate relationship between ROS and cellular survival. Consequently, these insights advance our understanding of how long-lived humoral immunity is formed.

Keywords: B cells; BCR signaling; NADPH oxidase; TLR4 signaling; immune metabolism; immune response.


Conflict of interest statement

The authors declare no conflicts of interest.

Figures

FIGURE 1
FIGURE 1
B cell populations and NOX expression measured by scRNA‐Seq. (A) Employed immunization scheme. (B) Frequency of B‐cell subpopulations; immature B cells (blue), activated B cells (pink), naïve B cells (green), GCBCs (red), PCs divided into immature (dark yellow), apoptotic (light orange), mature PCs (dark orange) and plasmablasts (yellow), and MBCs (blue) throughout the immune response to TT supplemented with MPLA in alum (called AS04). Non‐B cells are summarized under others (brown). (C) Frequency of GCDZ and GCLZ cells of all GCBCs (left) and of immature, apoptotic, and mature PCs and plasmablasts (right). (D) The total frequency of NOXmRNA + B cells in relation to all B cells throughout the immune response and the division into subpopulations. Immature B cells, naïve B cells and immature PCs were NOXmRNA . (E) Frequency of NOXmRNA + GCBCs in GCDZ and LZ (left), and of immature, apoptotic, and mature PCs and plasmablasts related to all NOXmRNA + mature PCs (right). All plasmablasts were NOXmRNA . For this analysis, splenic B cells from two mice were mixed in a 1:1 ratio followed by scRNA‐Seq (n = 800–5500 cells).
FIGURE 2
FIGURE 2
(A) Schematic representation of the bioassay to assess the presence of active NOXes. In short, NOXes catalyzed the conversion of molecular oxygen (O2) and NADPH into the ROS superoxide anion (O2 •−), which decreased the fluorescence of extracellular A647. (B) Traces of A647 signal of droplets containing a B cell. Only in the presence of a cell with active NOXes, a reduction of the signal of the oxidation‐sensitive A647 was observed over the measurement time (highlighted in red, termed NOXdrop +). (C) Frequency of NOXdrop + cells without or in the presence of the ROS scavenger NAC on day 7 (n = 3). (D) Distribution of lactate secretion rates from NOXdrop and NOXdrop + cells (n = 1500, randomly selected in groups of 125 from each mouse and day of analysis). The dotted lines indicate the quantitative range of the lactate assay (0.1–0.8 amol/s [38]), and the number shown above the cutoff represents the percentage of B cells with a lactate secretion rate of ≥0.8 amol/s. (E) Comparison of the intracellular ROS level distributions between NOXdrop and NOXdrop + cells. The fluorescence increase, related to ROS production, was measured using CellROX Green [38] (all n = 375, randomly selected in groups of 125 from each mouse). (F) Frequency of cells detected as NOXdrop + throughout the immune response (n = 2–4). (G) Comparison of frequency of NOXdrop + cells determined by droplet measurements (light red) and NOXmRNA + cells detected by transcriptomic analysis (dark red, data from Figure 1C) throughout the immune response. The median, 25 and 75 quartiles are indicated as dashed and dotted lines, respectively, in the violin plots, and the mean and SD are displayed in the bar charts. The level of statistical significance is denoted as *p < 0.05, **p < 0.01, ***p < 0.001, and ****p < 0.0001. The schematic representation of the bioassay was created with BioRender.com.
FIGURE 3
FIGURE 3
(A) Frequency of NOXdrop + cells obtained by immunization with TT/AS04 (purple) and TT/alum (pink) throughout the immune response. Mean, SD, and individual measurements (n = 3–4 mice) are shown. TT/AS04 data is identical to the data displayed in Figure 2G. (B) Frequency of NOXdrop + cells on day 0 without (−, orange) or with (+, red) ex vivo stimulation using MPLA (n = 3–4). (C) Distribution of measured IgG secretion rates of all cells (i.e., NOX independent; grey) or NOXdrop cells (yellow) on days 0, 3, 7, and 14. The IgG secretion rate of NOXdrop + cells could not be determined due to the loss of the A647 signal. All IgG‐SCs from three mice per day were pooled. Day 0: n all IgG‐SCs (grey) = 12, n NOX IgG‐SCs (yellow) = 13, day 3: n all IgG‐SCs = 459, n NOX IgG‐SCs = 106, day 7: n all IgG‐SCs = 78, n NOX IgG‐SCs = 17, day 14: n all IgG‐SCs = 75, n NOX IgG‐SCs = 6. The dotted lines represent the quantitative range (9–285 IgG/s) and the number above the upper limit, the frequency of cells with an IgG secretion rate of ≥285 IgG/s of the respective category. The level of statistical significance is denoted as *p < 0.05, ***p < 0.001, and ****< 0.0001.
FIGURE 4
FIGURE 4
Top row: Expression level of genes associated with selected metabolic pathways in NOXmRNA (left column) and NOXmRNA + (right column) (A) activated B cells, (B) GCBCs, for PC subpopulations divided into (C) mature PCs, (D) apoptotic PCs, and (E) immature PCs during the immune response, and (F) MBCs. As all plasmablasts were NOXmRNA , this subset was excluded from the analysis. The log2 fold change of DEGs involved in each pathway was considered (p‐value <0.05). Bottom row: Heatmap representing the expression level of apoptosis, ER stress, and mitochondrial stress‐associated genes. (G) Distribution of lactate secretion rates of NOXdrop and NOXdrop + cells during the secondary immune response. The dotted lines represent the borders of the quantitative range (0.1–0.8 amol/s [38]). The number above the distributions indicates the frequency of cells with a lactate secretion rate of ≥0.8 amol/s for the respective category. The level of statistical significance is denoted as ***p < 0.001 and ****p < 0.0001.

References

    1. O'Connor B. P., Vogel L. A., Zhang W., et al., “Imprinting the Fate of Antigen‐Reactive B Cells Through the Affinity of the B Cell Receptor,” Journal of Immunology 177, no. 11 (2006): 7723–7732. - PMC - PubMed
    1. Paus D., Phan T. G., Chan T. D., Gardam S., Basten A., and Brink R., “Antigen Recognition Strength Regulates the Choice Between Extrafollicular Plasma Cell and Germinal Center B Cell Differentiation,” Journal of Experimental Medicine 203, no. 4 (2006): 1081–1091. - PMC - PubMed
    1. Schwickert T. A., Victora G. D., Fooksman D. R., et al., “A Dynamic T Cell‐Limited Checkpoint Regulates Affinity‐Dependent B Cell Entry Into the Germinal Center,” Journal of Experimental Medicine 208, no. 6 (2011): 1243–1252. - PMC - PubMed
    1. Victora G. D. and Nussenzweig M. C., Annual Review of Immunology 30 (2012): 429–457. - PubMed
    1. Kurosaki T. and Hikida M., “Tyrosine Kinases and Their Substrates in B Lymphocytes,” Immunological Reviews 228, no. 1 (2009): 132–148. - PubMed

MeSH terms

LinkOut - more resources