

Development and Validation of Prognostic Characteristics Associated With Chromatin Remodeling-Related Genes in Ovarian Cancer
- PMID: 39932052
- PMCID: PMC11811884
- DOI: 10.1002/cam4.70634
Development and Validation of Prognostic Characteristics Associated With Chromatin Remodeling-Related Genes in Ovarian Cancer
Abstract
Background: Ovarian cancer (OC) is a prevalent malignant tumor in the field of gynecology, exhibiting the third highest incidence rate and the highest mortality rate among gynecological tumors. Chromatin remodeling accomplishes specific chromatin condensation at distinct genomic loci and plays an essential role in epigenetic regulation associated with various processes related to cancer development.
Methods: Differentially expressed genes (DEGs) between OC and control samples were screened from The Cancer Genome Atlas (TCGA) and Genotype-Tissue Expression (GTEx) databases, combined with chromatin remodeling-related genes (CRRGs) obtained from the GeneCards database to identify differentially expressed CRRGs (DECRRGs). Enrichment analysis and protein-protein interaction (PPI) network were performed on the DECRRGs. Prognostic genes of OC were screened using univariate Cox and least absolute shrinkage and selection operator (Lasso) analyses. A risk model based on prognostic genes was developed, and the survival probability of OC patients in different risk groups was analyzed by Kaplan-Meier (KM) curve. Finally, the expression levels of prognostic genes were validated by quantitative real-time polymerase chain reaction (qRT-PCR) and western blotting.
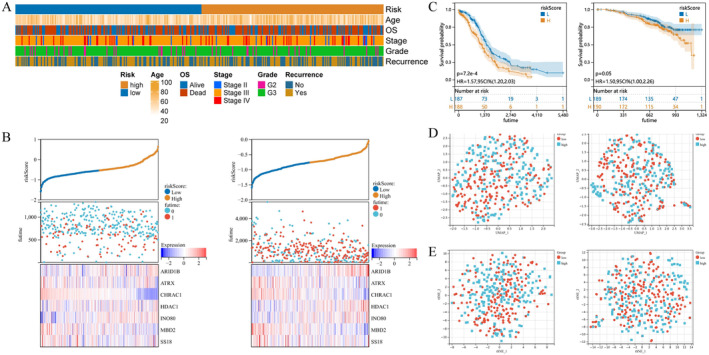
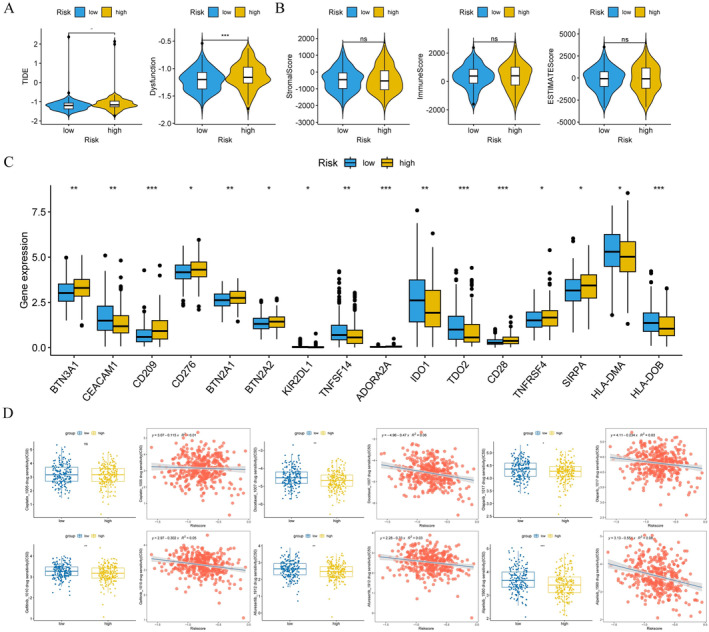
Results: In total, 7 potential prognostic genes associated with the progression of OC patients were obtained, including ARID1B, ATRX, CHRAC1, HDAC1, INO80, MBD2, and SS18. Based on the expression level of prognostic genes, OC patients were divided into high-risk group and low-risk group. Survival analysis indicated that patients classified into the high-risk group had higher mortality rates, which enables this prediction model to be utilized as an independent predictor of OC. Immunocorrelation analysis showed that low-risk patients were more likely to benefit from immunotherapy.
Conclusion: In this study, we have identified 7 prognostic genes, including ARID1B, ATRX, CHRAC1, HDAC1, INO80, MBD2, and SS18. Overall, our findings provided a foundation for further comprehension of the potential molecular mechanisms underlying OC pathogenesis and progression.
Keywords: chromatin remodeling; immunocorrelation; ovarian cancer; prognostic genes.
© 2025 The Author(s). Cancer Medicine published by John Wiley & Sons Ltd.
Conflict of interest statement
The authors declare no conflicts of interest.
Figures


Similar articles
-
Identification of chromatin remodeling-related gene signature to predict the prognosis in breast cancer.Clin Exp Med. 2025 May 3;25(1):137. doi: 10.1007/s10238-025-01661-8. Clin Exp Med. 2025. PMID: 40317384 Free PMC article.
-
A novel TCGA-validated programmed cell-death-related signature of ovarian cancer.BMC Cancer. 2024 Apr 23;24(1):515. doi: 10.1186/s12885-024-12245-2. BMC Cancer. 2024. PMID: 38654239 Free PMC article.
-
Identification and validation of a novel defined stress granule-related gene signature for predicting the prognosis of ovarian cancer via bioinformatics analysis.Medicine (Baltimore). 2024 Nov 22;103(47):e40608. doi: 10.1097/MD.0000000000040608. Medicine (Baltimore). 2024. PMID: 39809219 Free PMC article.
-
Screening of potential targets and small-molecule drugs related to lipid metabolism in ovarian cancer based on bioinformatics.Biochem Biophys Res Commun. 2024 Nov 12;733:150673. doi: 10.1016/j.bbrc.2024.150673. Epub 2024 Sep 11. Biochem Biophys Res Commun. 2024. PMID: 39293329
-
Identification of latent biomarkers in connection with progression and prognosis in oral cancer by comprehensive bioinformatics analysis.World J Surg Oncol. 2021 Aug 12;19(1):240. doi: 10.1186/s12957-021-02360-w. World J Surg Oncol. 2021. PMID: 34384424 Free PMC article.
Cited by
-
Gut-Vaginal Microbiome Crosstalk in Ovarian Cancer: Implications for Early Diagnosis.Pathogens. 2025 Jun 25;14(7):635. doi: 10.3390/pathogens14070635. Pathogens. 2025. PMID: 40732683 Free PMC article. Review.
References
MeSH terms
Substances
Grants and funding
LinkOut - more resources
Full Text Sources
Medical
Miscellaneous
