. 2025 Jan 28;44(1):115151.
doi: 10.1016/j.celrep.2024.115151. Epub 2024 Dec 28.

Bone marrow mesenchymal stromal cells support translation in refractory acute myeloid leukemia

Affiliations

Bone marrow mesenchymal stromal cells support translation in refractory acute myeloid leukemia

Livia E Lisi-Vega et al. Cell Rep. .

Abstract

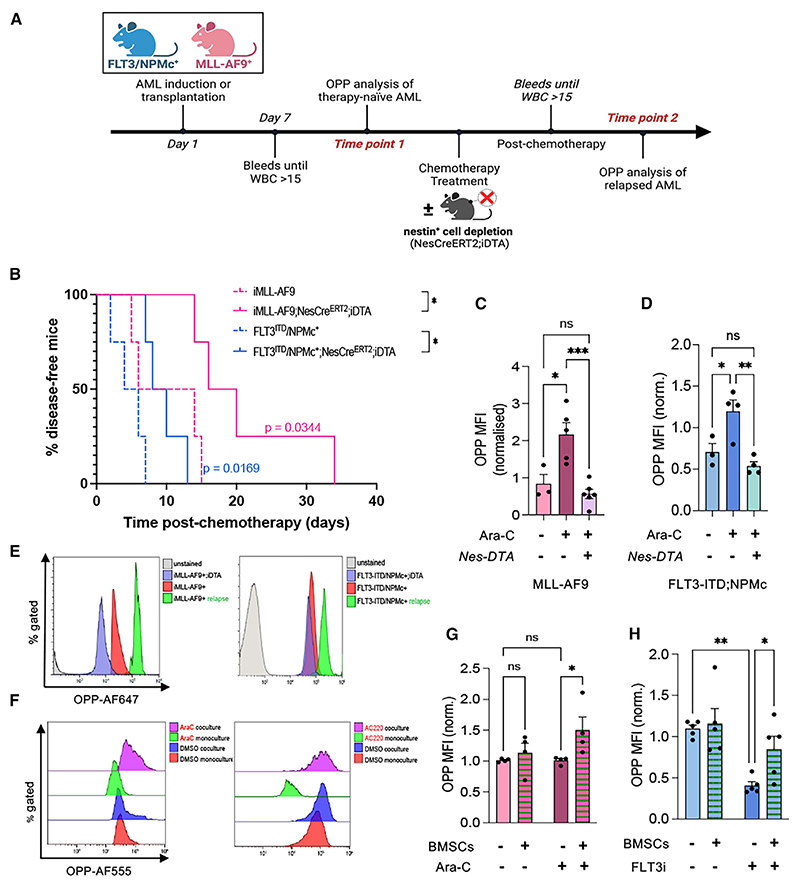
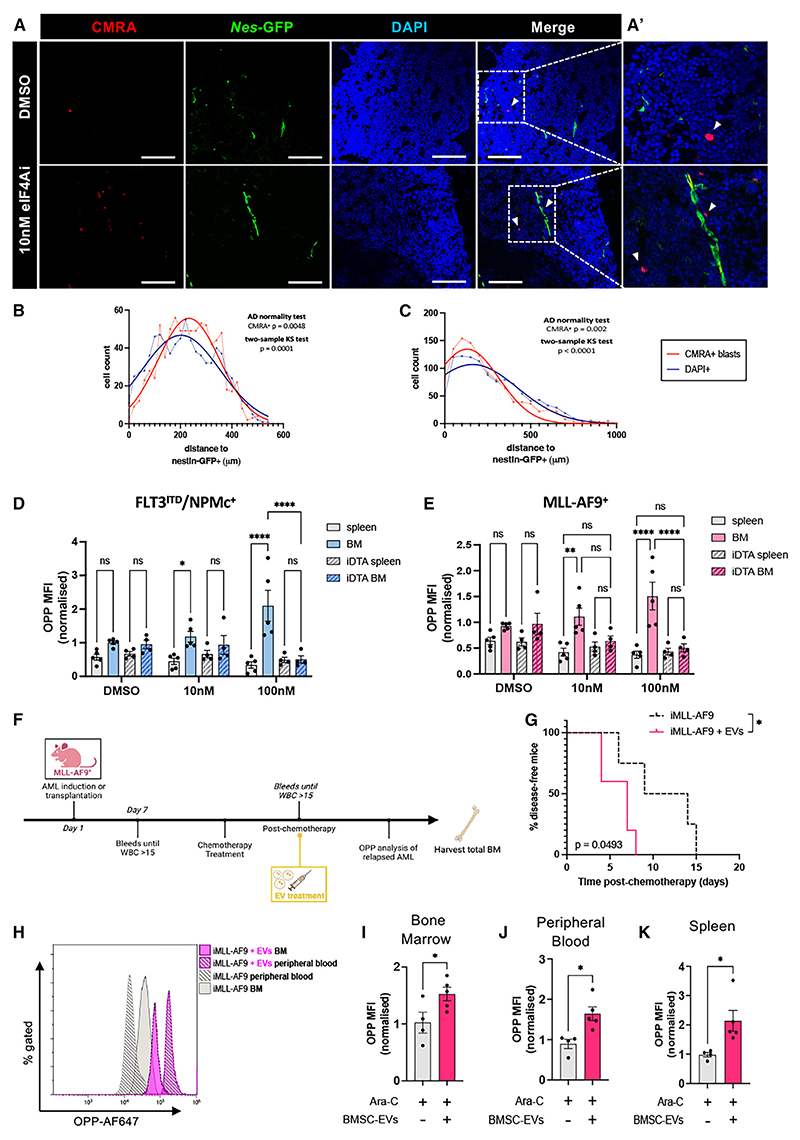
In acute myeloid leukemia (AML), malignant cells surviving chemotherapy rely on high mRNA translation and their microenvironmental metabolic support to drive relapse. However, the role of translational reprogramming in the niche is unclear. Here, we found that relapsing AML cells increase translation in their bone marrow (BM) niches, where BM mesenchymal stromal cells (BMSCs) become a source of eIF4A-cap-dependent translation machinery that is transferred to AML cells via extracellular vesicles (EVs) to meet their translational demands. In two independent models of highly chemo-resistant AML driven by MLL-AF9 or FLT3-ITD (internal tandem duplication) and nucleophosmin (NPMc) mutations, protein synthesis levels increase in refractory AML dependent on nestin+ BMSCs. Inhibiting cap-dependent translation in BMSCs abolishes their chemoprotective ability, while EVs from BMSCs carrying eIF4A boost AML cell translation and survival. Consequently, eIF4A inhibition synergizes with conventional chemotherapy. Together, these results suggest that AML cells rely on BMSCs to maintain an oncogenic translational program required for relapse.

Keywords: CP: Cancer; acute myeloid leukemia; bone marrow mesenchymal stromal cells; chemotherapy; extracellular vesicles; microenvironment; niche; protein synthesis; refractory; relapse; translation.


Conflict of interest statement

Declaration of interests The authors declare no competing interests.

Figures

Graphical abstract
Graphical abstract
Figure 1
Figure 1. Increased protein synthesis in AML cells and their niches supports refractory AML
(A) Experimental workflow of O-propargyl-puromycin (OPP) labeling in vivo to assess AML blast translation levels before and after AML recurrence in the FLT3-ITD; NPMc and MLL-AF9 mouse models. (B–D) Representative flow cytometry plots (B) and quantification (C and D) of global protein synthesis levels measured by OPP mean fluorescence intensity (MFI) in MLL-AF9 (C) or FLT3-ITD; NPMc (D) blasts from therapy-naive and refractory AML mice. MFI values are normalized to average OPP MFI values of therapy-naive AML mice. Dots represent data from individual mice (n = 2 independent experiments). Data are mean ± SEM. Unpaired two-tailed t test. (E and F) Comparison of global protein synthesis levels between MLL-AF9 and FLT3-ITD; NPMc AML blasts in the BM (E) and peripheral blood (F). Dots represent data from individual mice (data pooled from n = 4 independent experiments for E and n = 2 for F). Data are mean ± SEM. Unpaired two-tailed t test. (G) Inverse correlation between AML blast translation levels in refractory AML and the time to recurrence (measured as number of days post-chemotherapy until reappearance of disease based on peripheral blood counts). Dots represent data from individual mice. Data were pooled from MLL-AF9 (n = 3) and FLT3-ITD; NPMc (n = 4) in vivo experiments. Pearson correlation analysis and linear regression line fitting were used (blue line, 95% confidence interval [CI] represented by dashed line). (H and I) Representative BM immunofluorescence images of Nestin-gfp mice transplanted with WT (H) or FLT3-ITD; NPMc (I) BM cells. Nestin-GFP (green), CD31+ or endomucin (EMCN)+ blood vessels (red), and nuclei counterstained with 4′,6-diamidino-2-phenylindole (DAPI; blue). Scale bar, 200 μm. (J) BM area occupied by Nes-GFP+ cells (%) in Nestin-gfp mice 5–8 weeks after transplantation with WT or FLT3-ITD; NPMc AML cells. Areas are normalized with the average of WT controls from 2 independent experiments. Dots represent data from individual mice. Unpaired two-tailed t test. (K and L) Fold change in the number of BM stromal cells (CD45Ter119CD31) (K) and BMSCs expressing Nes-GFP (Nes-GFP+) (L) in the BM of control (Nes-GFP mice) and AML (Nes-GFP;FLT3-ITD;NPMc) mice. Numbers were normalized with the average of WT controls. Dots represent data from individual mice. Unpaired two-tailed t test. See also Figures S1 and S2.
Figure 2
Figure 2. Chemotherapy induces a metabolic/translational switch in nestin+ BMSCs
(A) In vivo global protein synthesis levels measured by O-propargyl-puromycin (OPP) mean fluorescence intensity (MFI) of CD45CD31Ter119Nes-GFP+ cells from WT and AML mice before or after AML recurrence. (B and C) Global protein synthesis levels as measured by OPP MFI in monocultured BMSCs and BMSCs cocultured with MLL-AF9 (B) or FLT3-ITD; NPMc (C) AML blasts with/without chemotherapy (AraC or the FLT3i AC220, respectively, n = 4). Data are mean ± SEM. Dots represent biological replicates (n = 4 independent experiments). *p < 0.05, **p < 0.01, and ***p < 0.001. One-way ANOVA and pairwise comparisons. (D) Overview of BONCAT experiments. Briefly, AHA-labeled BMSCs previously stimulated with H2O2 (50 μM) were washed and cocultured with MLL-AF9 or FLT3-ITD; NPMc blasts for 24 h in the presence or absence of chemotherapy treatment. After coculture, AHA-labeled proteins were conjugated to a fluorophore (AF647) or resin beads via click chemistry for microscopy and proteomics, respectively. MS analysis aimed to (1) identify changes in the nascent proteome of BMSCs upon coculture and exposure to chemotherapy and (2) use the presence of the AHA label to trace proteins transferred from BMSCs to AML blasts. (E) Global protein synthesis levels as measured by OPP MFI in monocultured BMSCs and BMSCs previously stimulated with H2O2 (50 μM). **p < 0.01, unpaired two-tailed t test. (F and G) Chord diagrams showing the relationships between the top 10 Gene Ontology (GO) terms and their associated proteins, appearing as differentially translated/labeled in BMSCs in coculture vs. monoculture (F) and BMSCs cocultured in the presence of chemotherapy vs. monoculture (G). Top 10 GO terms were extracted from the GO enrichment results obtained from ClusterProfiler, and the associated genes were extracted from these terms. The top 10 genes were then extracted from this list and sorted based on their frequency of occurrence in the aforementioned GO terms. Proteomics samples pooled were together from various experiments, n = 2 for monoculture and n = 3 for coculture and coculture + chemotherapy conditions. See also Figures S1 and S2 and Table S2.
Figure 3
Figure 3. Translation-related proteins are transferred from the BM niche to AML blasts, supporting oncogenic translation
(A) Experimental workflow to assess the potential transfer of microenvironmentally derived proteins to pediatric FLT3-ITD AML cells in a xenograft model. (B) iBAQ scores of mouse proteins enriched in xenografted hCD45+hCD33+FLT3-ITD AML cells (n = 3). The discontinuous line represents the average iBAQ score of the mouse proteins (M) identified in the samples. Proteins were considered enriched when the iBAQ observed/expected ratio + iBAQ scores were higher than average. (C) iBAQ scores of the top 10 translation related proteins enriched in xenografted hCD45+hCD33+FLT3-ITD AML cells (n = 3) mapped to human and mouse (HM) libraries. The discontinuous line represents the average iBAQ score of the HM mapped proteins identified in the samples. Proteins were considered enriched when the iBAQ observed/expected ratio + iBAQ scores were higher than average. (D) Frequencies (%) of ribosomal proteins (RPs) and translation factors found enriched in xenografted hCD45+hCD33+FLT3-ITD AML cells (n = 3). (E) Volcano plot of enriched Gene Ontology categories. (F) Distribution of 5′ and 3′ UTRs and GC content (%) in genes coding for mouse or human proteins enriched in in xenografted hCD45+hCD33+FLT3-ITD AML cells compared to other coding genes (ShinyGO software). *p < 0.05, **p < 0.01, ***p < 0.001, and ****p < 0.0001. Unpaired two-tailed t test. See also Tables S3 and S4.
Figure 4
Figure 4. Nestin+ BMSCs support increased protein synthesis in refractory AML
(A) Experimental workflow of in vivo O-propargyl-puromycin (OPP) labeling to assess blast translation levels at AML recurrence in control littermates or experimental mice with nestin+ cell depletion (Nes-CreERT2;iDTA mice). (B) Refractory AML in control iMLL-AF9 mice or FTL3-ITD; NPMc mice (dashed line, n = 4) compared with experimental AML mice following nestin+ cell depletion (Nes-CreERT2;iDTA mice; continuous lines, n = 4). *p < 0.05, log rank test. (C) Global translation in CD45.2+linckit+MLL-AF9+ leukemia stem cells (LSCs) in therapy-naive mice (iMLL-AF9) vs. refractory AML mice with (Nes-DTA+) or without nestin+ cell depletion. (D) OPP mean fluorescence intensity (MFI) of LinCD45.2+ckit+FLT3-ITD; NPMc blasts from therapy-naive mice (FLT3ITD/NPMc+) vs. refractory AML mice with (Nes-DTA+) and without nestin+ cell depletion. (E) Global translation in CD45.2+linckit+ LSCs from MLL-AF9 (left) or FLT3-ITD; NPMc (right) therapy-naive or refractory AML mice with (iDTA) or without nestin+ cell depletion. (F–H) Global translation flow cytometry plots (F) and quantification (G and H) in monocultured/cocultured MLL-AF9 (G) or FLT3-ITD; NPMc (H) AML blasts with/without chemotherapy. (C, D, G, and H) Each dot is a biological replicate (n = 4). Data are mean ± SEM. *p < 0.05, **p < 0.01, and ***p < 0.001; ANOVA and pairwise comparisons. See also Figures S2 and S3 and Tables S5 and S6.
Figure 5
Figure 5. Nestin+ BMSCs shape the nascent proteome of refractory AML cells
(A and B) Gene Ontology (GO) categories of biological process (A) and cellular component (B) terms enriched in nascent proteome of linLy6G+CD11b+ cells from AML mice with (iMLL-AF9;Nes-CreERT2;iDTA, n = 9) or without (control iMLL-AF9, n = 8) nestin+ cell depletion. (C) Protein-protein interaction (STRING) analysis of differentially O-propargyl-puromycin (OPP)-labeled proteins in linLy6G+CD11b+ cells from AML mice with (iMLL-AF9;Nes-CreERT2;iDTA, n = 9) or without (control iMLL-AF9, n = 8) nestin+ cell depletion. Interacting translation-related proteins are highlighted by the red discontinuous line. (D) Fold enrichment in translation-related GO categories enriched in AML mice and patients with relapsed AML. (E and F) GO cellular component categories enriched in proteins labeled with the azide-bearing artificial amino acid AHA and found to be transferred from BMSCs to cocultured FLT3-ITD; NPMc (E) or MLL-AF9 (F) AML blasts after chemotherapy with FLT3 inhibitor (FLT3i, AC220) or Ara-C, respectively. (G) CNet plot of transferred proteins shared by AraC-treated MLL-AF9 AML blasts and FLT3i-treated FLT3-ITD; NPMc AML blasts and their relationships to the top biological process GO terms enriched in both conditions (3 biological replicates from 2 independent experiments). See also Figure S4 and Table S5.
Figure 6
Figure 6. BMSCs support AML blast translation through eIF4A carried in extracellular vesicles
(A and B) Global translation in MLL-AF9 (A) or FLT3-ITD; NPMc (B) AML blasts in monoculture or cocultured with BMSCs directly or through transwell, treated with chemotherapy (A, AraC; B, FLT3 inhibitor AC220) or control vehicle (DMSO) (n = 4). (C) Heatmap of average normalized spectrum counts of translation initiation and elongation factors detected in extracellular vesicles (EVs) derived from monocultured MLL-AF9 blasts (M), AML-BMSC cocultures (C), and BMSCs (n = 3). (D) Venn diagram of proteins transferred from BMSCs to MLL-AF9 blasts or FLT3-ITD; NPMc blasts and similarly detected in BMSC-derived EVs. eIF4A1 stands out among 6 shared proteins as a critical factor regulating pro-oncogenic translational programs. (E) Violin plot of average eIF4A1 Zq values in secretome of AML mice with (iMLL-AF9;Nes-CreERT2;iDTA) or without (control iMLL-AF9) nestin+ cell depletion (n = 3). (F and G) Global translation in MLL-AF9 (F) and FLT3-ITD; NPMc (G) blasts treated for 12 h with 10/100 nM eIF4A inhibitor (eIF4Ai) or control DMSO and maintained for 24 h in monoculture (M) or in direct (C) or transwell (T) coculture with BMSCs (n = 4). (H and I) Global translation in MLL-AF9 (H) and FLT3-ITD; NPMc (I) blasts pre-treated for 12 h with 10/100 nM eIF4Ai or control DMSO, followed by addition of EVs isolated from monocultured AML blasts (M-EVs), AML-BMSC cocultures (C-EVs), or monocultured BMSCs pre-treated with vehicle (BMSC-EVs) or 100 nM eIF4Ai (BMSC-EVs + eIF4Ai) for 12 h (n = 4). (J and K) Frequency of CD45+ MLL-AF9 (J) or FLT3-ITD; NPMc (K) AML cells resistant to 12 h treatment with eIF4Ai compared with control vehicle (DMSO), followed by monoculture or coculture with BMSCs in presence of chemotherapy (n = 3). (L and M) Frequency of surviving CD45+ MLL-AF9 (L) or FLT3-ITD; NPMc (M) AML cells treated with FLT3i and cultured alone or in coculture with BMSCs pre-treated for 12 h with eIF4Ai or control vehicle (n = 3). (B and F–M) Each dot is a biological replicate. Data are mean ± SEM. *p < 0.05, **p < 0.01, and ***p < 0.001; ANOVA and pairwise comparisons. See also Figure S5 and Tables S7 and S8.
Figure 7
Figure 7. BMSCs rescue translation inhibition in AML cells in vivo
(A and A′) Immunofluorescence of CellTrackerOrangeCMRA+ (red) AML cells, Nestin-GFP+ (green) cells and DAPI-counterstained nuclei (blue) in Nestin-gfp BM 12 h after homing of intravenously (i.v.) injected AML cells treated with eIF4A inhibitor (eIF4Ai) or vehicle (DMSO). Scale bar, 200 μm. (B and C) Cumulative frequency distribution representing the cartesian distances between i.v. injected CMRA+ blasts treated with control vehicle (B) or 10 nM eIF4Ai (C) and BM Nes-GFP+ cells compared with randomly distributed DAPI+ cells. Two-sample Kolmogorov-Smirnov and Anderson-Darling normality tests indicate the non-random distribution of AML cells, close to Nes-GFP+ cells (n = 3 mice per condition). (D and E) Global translation levels in CMRA+linCD45.2+ckit+ (D) FLT3-ITD; NPMc or (E) MLL-AF9 leukemic stem cells previously treated with vehicle or eIF4Ai and harvested for 12 h after i.v. transplantation from the BM or the spleen of recipient mice with (iDTA) or without nestin+ cell depletion. Dots represent biological replicates. (F) Scheme depicting experimental design of in vivo EV treatment experiments. (G) Kinetics of AML recurrence after chemotherapy treatment alone (black) or followed by i.v. injection of BMSC-derived extracellular vesicles (EVs, pink); n = 2 independent experiments, *p < 0.05, log rank test. (H–K) Flow cytometry histograms (H) and quantification of global translation in (I) BM, (J) peripheral blood, and (K) spleen linCD45+ckit+ cells from mice treated with chemotherapy alone (gray) or followed by BMSC-derived EV infusion (pink) (n = 2). (D–E and I–K). Data are mean ± SEM. (I–K) Each dot is a mouse. *p < 0.05, **p < 0.01, ***p < 0.001, and ****p < 0.0001. (D and E) Two-way ANOVA. (I–K) Unpaired two-tailed t test. See also Figure S6.

References

    1. Dohner H, Wei AH, Appelbaum FR, Craddock C, DiNardo CD, Dombret H, Ebert BL, Fenaux P, Godley LA, Hasserjian RP, et al. Diagnosis and management of AML in adults: 2022 recommendations from an international expert panel on behalf of the ELN. Blood. 2022;140:1345–1377. - PubMed
    1. Krivtsov AV, Armstrong SA. MLL translocations, histone modifications and leukaemia stem-cell development. Nat Rev Cancer. 2007;7:823–833. - PubMed
    1. Falini B, Nicoletti I, Martelli MF, Mecucci C. Acute myeloid leukemia carrying cytoplasmic/mutated nucleophosmin (NPMc+ AML): biologic and clinical features. Blood. 2007;109:874–885. - PubMed
    1. Mendez-Ferrer S, Bonnet D, Steensma DP, Hasserjian RP, Ghobrial IM, Gribben JG, Andreeff M, Krause DS. Bone marrow niches in haematological malignancies. Nat Rev Cancer. 2020;20:285–298. doi: 10.1038/s41568-020-0245-2. - DOI - PMC - PubMed
    1. Forte D, Garcia-Fernandez M, Sanchez-Aguilera A, Stavropoulou V, Fielding C, Martin-Perez D, Lopez JA, Costa ASH, Tronci L, Nikitopoulou E, et al. Bone Marrow Mesenchymal Stem Cells Support Acute Myeloid Leukemia Bioenergetics and Enhance Antioxidant Defense and Escape from Chemotherapy. Cell Metabol. 2020;32:829–843. doi: 10.1016/j.cmet.2020.09.001. - DOI - PMC - PubMed

Publication types

LinkOut - more resources