. 2025 Mar 18;99(3):e0153224.
doi: 10.1128/jvi.01532-24. Epub 2025 Feb 11.

Activation of CXCR3+ Tfh cells and B cells in lymph nodes during acute HIV-1 infection correlates with HIV-specific antibody development

Affiliations

Activation of CXCR3+ Tfh cells and B cells in lymph nodes during acute HIV-1 infection correlates with HIV-specific antibody development

Julie L Mitchell et al. J Virol. .

Abstract

Lymph node T follicular helper (Tfh) cells and germinal center (GC) B cells are critical to generate potent antibodies but are rarely possible to study in humans. To understand how Tfh/GC B-cell interactions during acute HIV-1 infection (AHI) impact the generation of HIV-specific antibodies, we performed a unique cross-sectional analysis of inguinal lymph node biopsies taken prior to antiretroviral therapy (ART) initiation in AHI. Although total Tfh and GC B cell frequencies did not change during AHI, increased frequencies of proliferating Th1-like CXCR3+ Tfh, CXCR3+ non-GC B cells, and total CXCR3+ GC B cells correlated with gp120-specific IgG antibody levels in AHI. Frequencies of proliferating CXCR3+ Tfh in AHI also correlated with gp120-specific IgG antibody levels after 48 weeks of ART, antibody-dependent cellular cytotoxicity, antibody-dependent cellular phagocytosis, and increased antibody binding to infected cells after ART. Importantly, while beneficial for antibody development, CXCR3+ Tfh cells were also infected by HIV-1 at higher frequencies than their CXCR3- counterparts and may contribute to the initial dissemination of HIV-1 in follicles. Together, these data suggest that activation of CXCR3+ Tfh cells is associated with induction of the germinal center response and subsequent antibody development, making these cells an important target for future therapeutic interventions.

Importance: Early initiation of antiretroviral therapy (ART) is important to limit the seeding of the long-lasting HIV-1 reservoir; however, it also precludes the development of HIV-specific antibodies that can help control the virus if ART is stopped. Antibody development occurs within germinal centers in the lymph node and requires activation of both antigen-specific B cells and T follicular helper cells (Tfh), a specialized CD4+ cell that provides B cell help. To understand how early ART initiation may prohibit antibody development, we analyzed the frequencies and activation status of Tfh and B cells in lymph node biopsies collected in the different stages of acute HIV-1 infection. Our data suggest that decreased antibody development after early ART initiation may be due to limited germinal center development at the time of treatment and that new interventions that target activation of CXCR3+ Tfh may be beneficial to increase long-term HIV-specific antibody levels.

Keywords: B-cell responses; Tfh cells; human immunodeficiency virus; humoral immunity; lymph node.


Conflict of interest statement

J.A. has received honoraria from Merck, ViiV Healthcare, Roche, AbbVie, and Gilead for her participation in advisory meetings. The other authors declare no conflicts of interest.

Figures
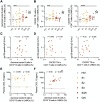
Fig 1
Fig 1
Germinal center B cell and T follicular helper cell frequencies do not increase in acute HIV-1 infection. (A) Frequencies of IgD-CD38hi germinal center (GC) B cells were measured in LNMCs from participants prior to ART initiation in different stages of acute (AHI) or chronic (CHI) HIV infection by flow cytometry. GC B-cell frequencies were measured in individuals without HIV as a control. (B) Levels of gp120-specific IgG antibodies were measured in the plasma of participants in AHI, and the correlation with the frequency of GC B cells in lymph nodes in S3-5 of AHI is shown. (C) Frequencies of CXCR3 and CXCR3+ Tfh (CXCR5+PD-1hi CD4+ T cells) were measured in LNMCs of participants in the different stages of AHI or CHI by flow cytometry. (D) Correlations between the frequencies of CXCR3 and CXCR3+ Tfh in LNMCs and plasma gp120-specific IgG antibody levels in S3-5 of AHI. CXCL13 levels were measured in plasma by Luminex, and correlations with GC B cell frequencies are shown for participants sampled in S1-2 (E) or S3-5 of AHI (F). Changes in cell populations during HIV-1 infection were measured by a Kruskal-Wallis test with Dunn’s multiple comparison to HIV- controls. Correlations were measured with Spearman correlation. No correlations remained significant after correction for a false discovery rate (FDR) of 5%. N = 62 *P < 0.05, **P < 0.01, ***P < 0.001, ****P < 0.0001.
Fig 2
Fig 2
Increased frequencies of activated CXCR3+ Tfh cells during AHI. Frequencies of ICOShi cells (A) and Ki-67+ cells (B) within CXCR3 and CXCR3+ Tfh populations were measured in LNMCs from participants prior to ART initiation in different stages of AHI or in CHI by flow cytometry. Frequencies of ICOShi cells (C) and Ki-67+ cells (D) within CXCR3 and CXCR3+ CXCR5-PD-1+ non-Tfh CD4+ T-cell populations were measured by flow cytometry in LNMCs. Changes in frequencies of activated cells during HIV-1 infection were measured by a Kruskal-Wallis test with Dunn’s multiple comparison to HIV controls. N = 62 *P < 0.05, **P < 0.01, ***P < 0.001, ****P < 0.0001.
Fig 3
Fig 3
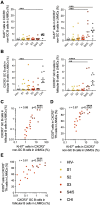
CXCR3+ B cells are activated in lymph nodes during AHI. (A) The frequency of Ki-67+ cells within CXCR3 and CXCR3+ follicular non-GC B cells (CXCR5+Bcl-6) was measured by flow cytometry in LNMCs from participants prior to ART initiation in different stages of AHI or CHI. (B) The frequencies of CXCR3 and CXCR3+ GC B cells (CXCR5+Bcl-6+) in LNMCs were measured by flow cytometry. (C) Correlation between the frequency of Ki-67+ cells within CXCR3+ non-GC B cells and the frequency of CXCR3+ GC B cells. Correlations were also measured between the frequency of Ki-67+ cells within CXCR3+ non-GC B cells (D) or CXCR3+ GC B cells (E) and the frequency of ICOShi CXCR3+ Tfh during S3-5 of AHI. Changes in frequencies of cell populations during HIV-1 infection were measured by a Kruskal-Wallis test with Dunn’s multiple comparison to HIV controls. Correlations were measured by Spearman correlation. All correlations remained significant after correction for an FDR of 5%. N = 62 *P < 0.05, **P < 0.01, ***P < 0.001, ****P < 0.0001.
Fig 4
Fig 4
The frequencies of proliferating CXCR3+ Tfh and CXCR3+ GC B cells in lymph nodes correlated with plasma gp120-specific antibody levels in AHI. Correlations between plasma gp120-specific antibody levels at the time of diagnosis and the frequency of ICOShi or Ki-67+ cells in CXCR3+ Tfh (A), Ki-67+ cells in CXCR3+ non-GC B cells (B), and CXCR3+ GC B cells (C) in lymph nodes prior in S3-5 of AHI. (D) Levels of gp120-specific antibodies were measured in the plasma by ELISA after 48 weeks of ART. The correlation between the frequency of Ki-67+ cells within CXCR3+ Tfh cells in lymph nodes prior to ART initiation in AHI and gp120-specific antibody levels after 48 weeks of ART is shown. All correlations were measured by Spearman correlation. Correlations that remained significant after correction for an FDR of 5% are indicated by asterisks (*). N = 18 for A-C; N = 14 for D.
Fig 5
Fig 5
The frequencies of proliferating CXCR3+ Tfh cells in lymph nodes correlated with increased antibody binding. Correlations between Ki-67+ CXCR3+ Tfh cells in lymph nodes at the time of diagnosis and the ADCC antibody titer (A) and ADCP phagocytic score (B) measured in plasma collected at ART initiation in S3–5 of AHI and after 48 weeks of ART. (C) Correlation between Ki-67+ CXCR3+ Tfh cells in lymph nodes at the time of diagnosis and the frequency of p24+ CRF01_AE infected cells bound by plasma antibody from week 0 or week 48. All correlations were measured by Spearman correlation. N = 13 for week 0; N = 12 for week 48. (D) A heatmap shows the Spearman r values for correlations between Tfh and B cell populations at the time of diagnosis and antibody measures at diagnosis or after 48 weeks of ART for participants who initiated treatment in S3-5 of AHI. All correlations were measured by Spearman correlation. Correlations that remained significant after correction for a FDR of 5% are indicated by white asterisks (*). *P < 0.05, **P < 0.01, ***P < 0.001, ****P < 0.0001.
Fig 6
Fig 6
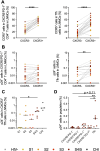
Increased permissiveness and infection of CXCR3+ Tfh cells in lymph nodes. (A) The frequency of CCR5+ cells within CXCR3 and CXCR3+ CXCR5-PD-1+ non-Tfh or Tfh populations was measured in LNMCs from participants at different stages of AHI. (B) The frequency of HIV-1 p24-producing cells was measured by HIV-Flow in LNMCs from participants in AHI. Comparisons of the frequency of p24+ cells in CXCR3 and CXCR3+ populations are shown for CXCR5-PD-1+ non-Tfh and Tfh cells. (C) Frequencies of p24+ cells within CXCR3+ Tfh cells in LNMCs from participants in AHI and CHI. (D) Frequencies of p24+ cells within different CXCR3+ memory CD4+ T-cell populations in LNMCs from participants in S4/5 of AHI. Differences in the frequency of CCR5+ or p24+ cells between CXCR3 and CXCR3+ cell populations were measured by a Wilcoxon test. Changes in frequencies of p24+ cells between different stages of AHI were measured by a Kruskal-Wallis test with Dunn’s multiple comparison between stages. Changes in frequencies of p24+ cells between different CXCR3+ CD4+ T-cell populations in S4/5 were measured by a Kruskal-Wallis test with Dunn’s multiple comparison to Tfh cells. N = 26 *P < 0.05, **P < 0.01, ****P < 0.0001.

References

    1. Wei X, Decker JM, Wang S, Hui H, Kappes JC, Wu X, Salazar-Gonzalez JF, Salazar MG, Kilby JM, Saag MS, Komarova NL, Nowak MA, Hahn BH, Kwong PD, Shaw GM. 2003. Antibody neutralization and escape by HIV-1. Nature 422:307–312. doi:10.1038/nature01470 - DOI - PubMed
    1. Richman DD, Wrin T, Little SJ, Petropoulos CJ. 2003. Rapid evolution of the neutralizing antibody response to HIV type 1 infection. Proc Natl Acad Sci U S A 100:4144–4149. doi:10.1073/pnas.0630530100 - DOI - PMC - PubMed
    1. Gray ES, Madiga MC, Moore PL, Mlisana K, Abdool Karim SS, Binley JM, Shaw GM, Mascola JR, Morris L. 2009. Broad neutralization of human immunodeficiency virus type 1 mediated by plasma antibodies against the gp41 membrane proximal external region. J Virol 83:11265–11274. doi:10.1128/JVI.01359-09 - DOI - PMC - PubMed
    1. Doria-Rose NA, Klein RM, Manion MM, O’Dell S, Phogat A, Chakrabarti B, Hallahan CW, Migueles SA, Wrammert J, Ahmed R, Nason M, Wyatt RT, Mascola JR, Connors M. 2009. Frequency and phenotype of human immunodeficiency virus envelope-specific B cells from patients with broadly cross-neutralizing antibodies. J Virol 83:188–199. doi:10.1128/JVI.01583-08 - DOI - PMC - PubMed
    1. Simek MD, Rida W, Priddy FH, Pung P, Carrow E, Laufer DS, Lehrman JK, Boaz M, Tarragona-Fiol T, Miiro G, et al. . 2009. Human immunodeficiency virus type 1 elite neutralizers: individuals with broad and potent neutralizing activity identified by using a high-throughput neutralization assay together with an analytical selection algorithm. J Virol 83:7337–7348. doi:10.1128/JVI.00110-09 - DOI - PMC - PubMed

MeSH terms