

Evaluating stool microbiome integrity after domestic freezer storage using whole-metagenome sequencing, genome assembly, and antimicrobial resistance gene analysis
- PMID: 39932403
- PMCID: PMC11878046
- DOI: 10.1128/spectrum.02278-24
Evaluating stool microbiome integrity after domestic freezer storage using whole-metagenome sequencing, genome assembly, and antimicrobial resistance gene analysis
Abstract
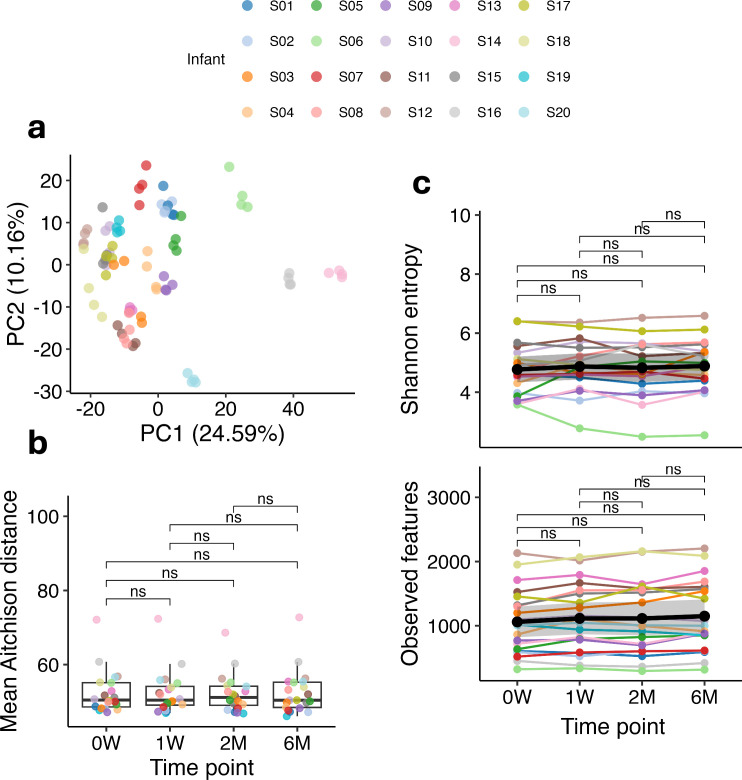
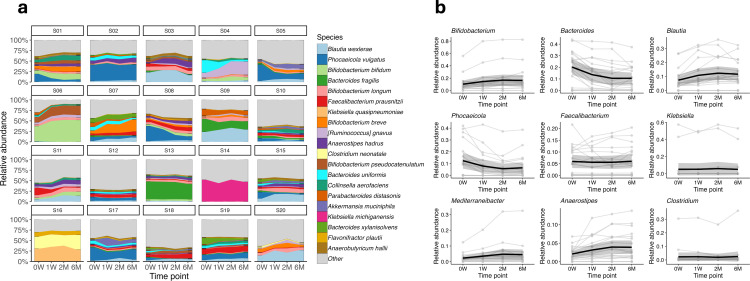
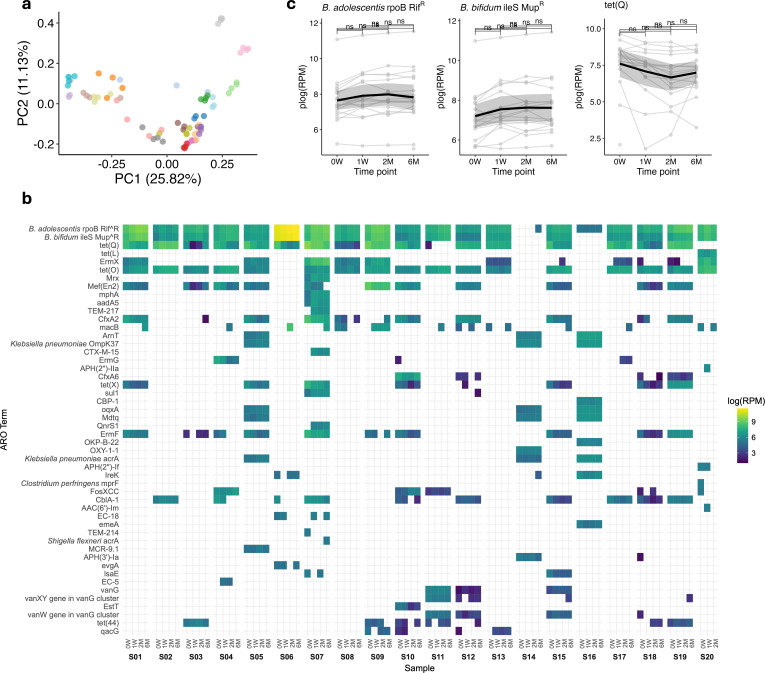
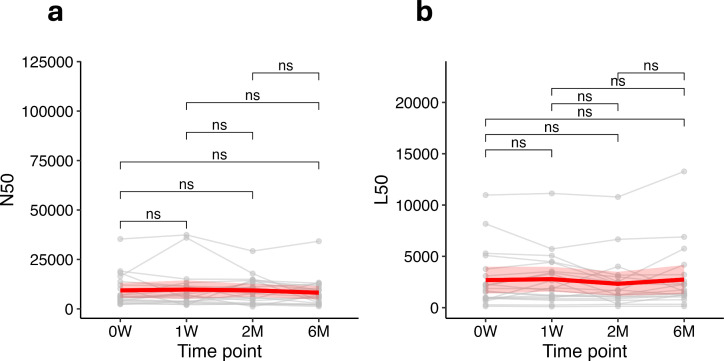
The gut microbiome is crucial for host health. Early childhood is a critical period for the development of a healthy gut microbiome, but it is particularly sensitive to external influences. Recent research has focused on using advanced techniques like shotgun metagenome sequencing to identify key microbial signatures and disruptions linked to disease. For accurate microbiome analysis, samples need to be collected and stored under specific conditions to preserve microbial integrity and composition, with -80°C storage considered the gold standard for stabilization. This study investigates the effect of domestic freezer storage on the microbial composition of stool samples obtained from 20 children under 4 years of age with the use of shotgun metagenome sequencing. Fresh stool samples were aliquoted into sterile tubes, with one aliquot stored at 4°C and analyzed within 24 hours, while others were frozen in domestic freezers (below -18°C) and analyzed after 1 week, 2 months, and 6 months. Assessments of contig assembly quality, microbial diversity, and antimicrobial resistance genes revealed no significant degradation or variation in microbial composition.
Importance: Most prior studies on sample storage have relied on amplicon sequencing, which is less applicable to metagenome sequencing-given considerations of contig quality and functional gene detection-and less reliable in representing microbial composition. Moreover, the effects of domestic freezer storage for at-home stool collection on microbiome profiles, contig quality, and antimicrobial resistance gene profiles have not been previously investigated. Our findings suggest that stool samples stored in domestic freezers for up to 6 months maintain the integrity of metagenomic data. These findings indicate that domestic freezer storage does not compromise the integrity or reproducibility of metagenomic data, offering a reliable and accessible alternative for temporary sample storage. This approach enhances the feasibility of large-scale at-home stool collection and citizen science projects, even those focused on the more easily perturbed early life microbiome. This advancement enables more inclusive research into the gut microbiome, enhancing our understanding of its role in human health.
Keywords: fecal; gut; infant; microbiota; shotgun sequencing; −20°C.
Conflict of interest statement
The authors declare no conflict of interest.
Figures
Similar articles
-
Comparison of Methods To Collect Fecal Samples for Microbiome Studies Using Whole-Genome Shotgun Metagenomic Sequencing.mSphere. 2020 Feb 26;5(1):e00827-19. doi: 10.1128/mSphere.00827-19. mSphere. 2020. PMID: 32250964 Free PMC article.
-
Comparison of Fecal Collection Methods on Variation in Gut Metagenomics and Untargeted Metabolomics.mSphere. 2021 Oct 27;6(5):e0063621. doi: 10.1128/mSphere.00636-21. Epub 2021 Sep 15. mSphere. 2021. PMID: 34523982 Free PMC article.
-
Standard Sample Storage Conditions Have an Impact on Inferred Microbiome Composition and Antimicrobial Resistance Patterns.Microbiol Spectr. 2021 Oct 31;9(2):e0138721. doi: 10.1128/Spectrum.01387-21. Epub 2021 Oct 6. Microbiol Spectr. 2021. PMID: 34612701 Free PMC article.
-
Effects of Stool Sample Preservation Methods on Gut Microbiota Biodiversity: New Original Data and Systematic Review with Meta-Analysis.Microbiol Spectr. 2023 Jun 15;11(3):e0429722. doi: 10.1128/spectrum.04297-22. Epub 2023 Apr 24. Microbiol Spectr. 2023. PMID: 37093040 Free PMC article.
-
Integrating functional metagenomics to decipher microbiome-immune interactions.Immunol Cell Biol. 2024 Sep;102(8):680-691. doi: 10.1111/imcb.12798. Epub 2024 Jul 2. Immunol Cell Biol. 2024. PMID: 38952337 Review.
Cited by
-
Bile-Liver phenotype: Exploring the microbiota landscape in bile and intratumor of cholangiocarcinoma.Comput Struct Biotechnol J. 2025 Mar 18;27:1173-1186. doi: 10.1016/j.csbj.2025.03.030. eCollection 2025. Comput Struct Biotechnol J. 2025. PMID: 40206347 Free PMC article.
References
MeSH terms
Grants and funding
LinkOut - more resources
Full Text Sources
Medical
