

Locus coeruleus neuromelanin, cognitive dysfunction, and brain metabolism in multiple system atrophy
- PMID: 39932591
- PMCID: PMC11814031
- DOI: 10.1007/s00415-025-12932-5
Locus coeruleus neuromelanin, cognitive dysfunction, and brain metabolism in multiple system atrophy
Abstract
Background: Cognitive dysfunction is increasingly recognized in multiple system atrophy (MSA). Locus coeruleus (LC) integrity is associated with cognitive performance both in healthy controls (HC) and neurodegenerative conditions such as Parkinson's disease (PD). Furthermore, cortical glucose hypometabolism is associated with impaired cognitive performance in MSA. However, knowledge about LC sub-regional degeneration and its association with cognitive dysfunction and cortical glucose metabolism is lacking.
Objective: To investigate LC sub-regional involvement and its association with cognitive impairment and brain metabolism in MSA.
Methods: Eleven MSA, eighteen PD, and eighteen HC participants were included in the study. Neuromelanin-sensitive MRI was used to determine rostral, middle and caudal LC neuromelanin signals. Brain glucose metabolism was investigated with [18F]Fluorodeoxyglucose PET (FDG-PET). The Montreal Cognitive Assessment (MoCA) was used as a measure of global cognition.
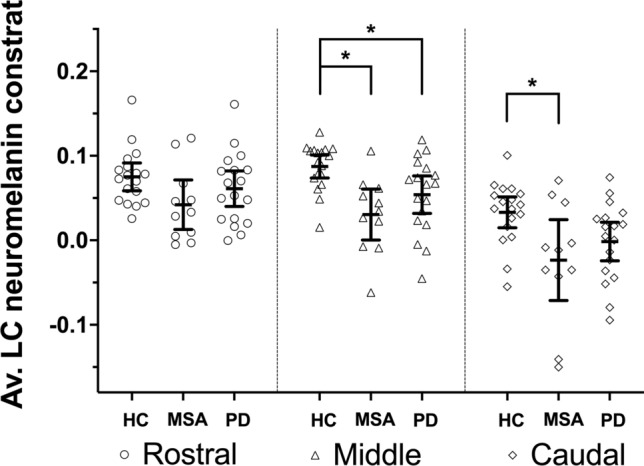
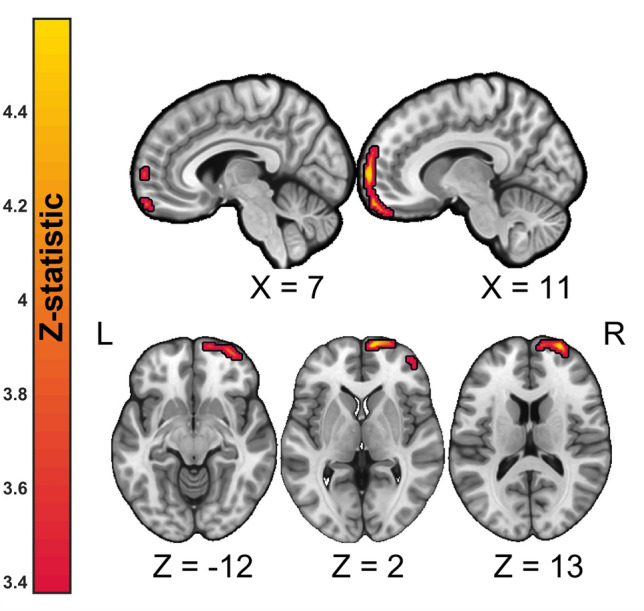
Results: Middle LC neuromelanin signal was significantly reduced in MSA [t(43) = 3.70, corrected-p = 0.004] and PD [t(43) = 2.63, corrected-p = 0.041] compared to HC, while caudal LC was only reduced in MSA [t(43) = 2.82, corrected-p = 0.030]. In MSA, decreased rostral LC neuromelanin was associated with lower MoCA scores (ρ = 0.760, p = 0.006) which, in turn, were associated with lower frontal cortex glucose metabolism. An association between rostral LC neuromelanin signal and frontal cortex glucose metabolism was found in exploratory analyses.
Conclusion: Loss of LC neuromelanin signal was found in MSA, the middle and caudal parts being targeted. Rostral LC neuromelanin signal loss was associated with both frontal cortex hypometabolism and lower MoCA scores. This pathophysiological link should be further investigated as the noradrenergic system transmission is amenable to pharmacological manipulation.
Keywords: Cognitive decline; FDG-PET; Locus coeruleus; Multiple system atrophy.
© 2025. The Author(s).
Conflict of interest statement
Declarations. Conflicts of interest: The authors have no competing interests to declare that are relevant to the content of this article. Ethical standard: Ethical approval was granted by the London-Surrey Research Ethics Committee Research Ethics Committee (18/LO/2123). All participants involved in the study provided written informed consent according to the Declaration of Helsinki.
Figures

References
-
- Miki Y et al (2020) Hippocampal α-synuclein pathology correlates with memory impairment in multiple system atrophy. Brain 143(6):1798–1810. 10.1093/brain/awaa126 - PubMed
MeSH terms
Substances
Grants and funding
LinkOut - more resources
Full Text Sources
Medical
