

Emerging Tools to Support DILI Assessment in Clinical Trials with Abnormal Baseline Serum Liver Tests or Pre-existing Liver Diseases
- PMID: 39932652
- PMCID: PMC11982145
- DOI: 10.1007/s40264-024-01511-8
Emerging Tools to Support DILI Assessment in Clinical Trials with Abnormal Baseline Serum Liver Tests or Pre-existing Liver Diseases
Abstract
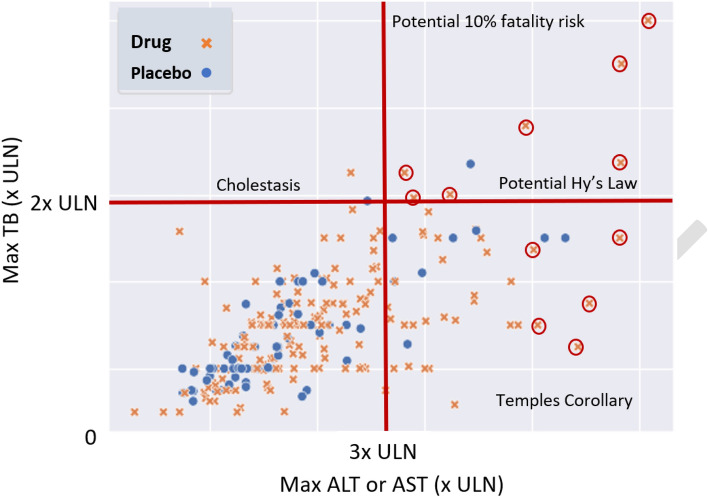
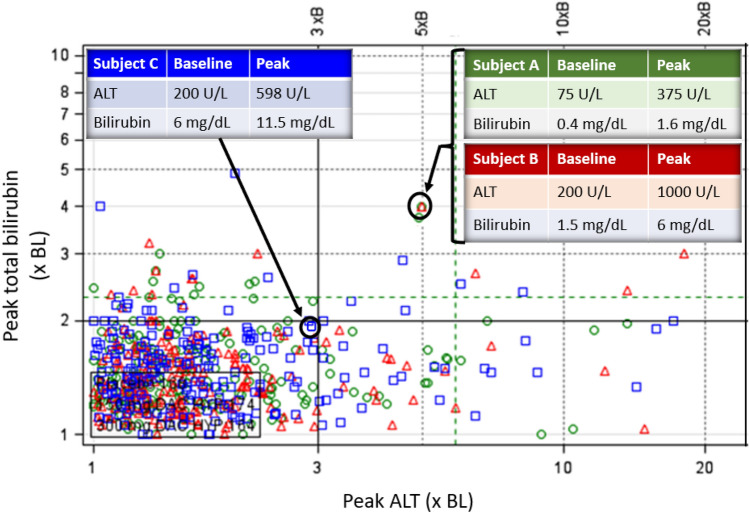
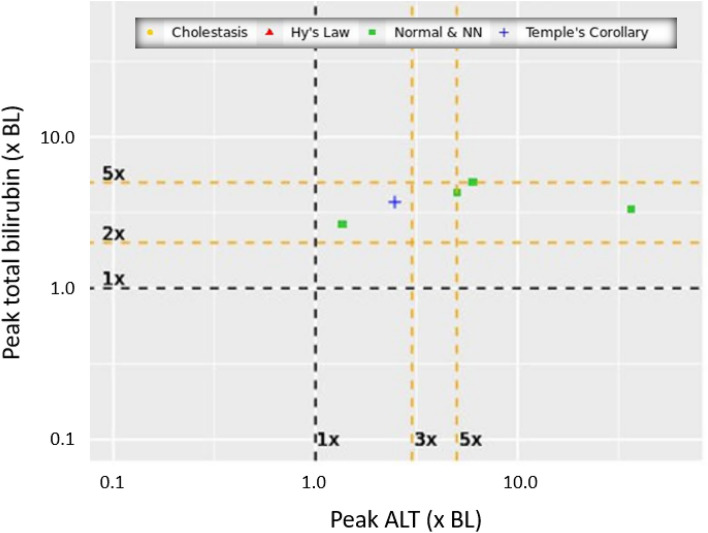
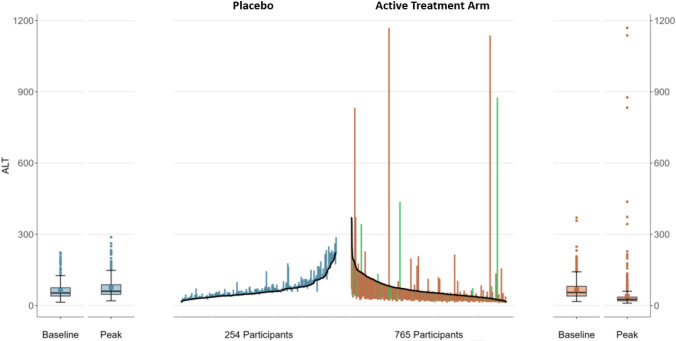
Based on the late Dr. Hyman Zimmerman's observation that hepatocellular drug-induced liver injury (DILI) leading to jaundice carries a ≥ 10% fatality risk (coined as Hy's law by others), evaluation of Drug-Induced Serious Hepatotoxicity (eDISH) continues to play a central role in the assessment of a study drug's liability for acute hepatocellular DILI. The eDISH identifies drugs in clinical trials with DILI fatality (death or transplant) risk that may be unacceptable in a post-market setting. As a two-dimensional graph that plots peak total bilirubin (TB) versus peak serum aminotransferase levels for each patient during study drug or comparator treatment, eDISH identifies potential cases of acute, modest, and serious hepatocellular DILI for in-depth analysis of liver tests (LT) and clinical course so that the likelihood of causal association with the study drug can be determined. Unfortunately, the generalizable utility of this tool only pertains to trials enrolling patients with normal or near normal (NNN) baseline (BL) serum LTs. The eDISH does not necessarily apply to trials of patients with abnormal baseline (ABN-BL) LTs that often coincide with underlying liver disorders. Because drug development programs being reviewed by the FDA increasingly target liver disorders, we are often challenged to evaluate DILI risk in trials of patients with ABN-BL LTs. Also, the high background prevalence of metabolic dysfunction associated steatotic liver disease (MASLD) means patients with LTs above NNN may need to be enrolled in trials treating non-liver disorders to reflect the target population. Such study populations create challenges for industry and regulators because eDISH may not reliably categorize or identify potential cases of DILI for further analysis, as it so efficiently does in NNN-BL trials. We describe the main functionalities of eDISH in NNN-BL trials to understand what should be emulated by new tools or eDISH modifications. We then discuss non-eDISH-based plots that may be useful in ABN-BL trials.
© 2025. This is a U.S. Government work and not under copyright protection in the US; foreign copyright protection may apply.
Conflict of interest statement
Declarations. Funding: The Research Participation Program at the U.S. Food and Drug Administration administered by the Oak Ridge Institute for Science and Education through an interagency agreement between the U.S. Department of Energy and the U.S. Food and Drug Administration (Grant no. CDER-OND-M-24-11192). Conflicts of interest: The authors have no conflicts of interest to declare. Disclaimer: The conclusions and views in this manuscript are the authors and do not represent an official position of the Food and Drug Administration. Ethics Approval: Not applicable. Data are not identifiable to any drug product, subject, or patient. Consent to participate: Not applicable. Consent to Publication: Not applicable. Availability of Data: Not applicable. Datasets from new drug applications are not publicly available. Code Availability: Composite coding available on GitHub. Other coding to be available on GitHub shortly. Author Contributions: JA: study design, programming, data analysis, manuscript writing; BT: programming, data analysis; YVP: study design, manuscript writing; EN: study design, data analysis, manuscript writing; MIA: Study design, manuscript writing; PHH: study design, data analysis, manuscript. All authors have read and approved the final version.
Figures

References
-
- Watkins PB, Seligman PJ, Pears JS, Avigan MI, Senior JR. Using controlled clinical trials to learn more about acute drug-induced liver injury. Hepatology. 2008;48(5):1680–9. 10.1002/hep.22633. - PubMed
-
- Avigan MI. DILI and drug development: a regulatory perspective. Semin Liver Dis. 2014;34(2):215–26. 10.1055/s-0034-1375961. (published Online First: 20140531). - PubMed
-
- Avigan M, Munoz, MA. Perspectives on the Regulatory and Clinical Science of Drug-induced Liver Injury. Drug-Induced Liver Toxicity: Springer Protocols, 2018:367-93.
-
- Drug-induced liver injury (DILI): Current status and future directions for drug development and the post-market setting. A consensus by a CIOMS Working Group.; 2020; Geneva, Switzerland. Council for International Organizations of Medical Sciences (CIOMS), https://cioms.ch/publications/product/drug-induced-liver-injury/. Accessed 12 Jun 2024.
Publication types
MeSH terms
Grants and funding
LinkOut - more resources
Full Text Sources
Medical
Research Materials
