. 2025 Feb 11;10(6):e186073.
doi: 10.1172/jci.insight.186073.

Loss of long-chain acyl-CoA dehydrogenase protects against acute kidney injury

Affiliations

Loss of long-chain acyl-CoA dehydrogenase protects against acute kidney injury

Takuto Chiba et al. JCI Insight. .

Abstract

The renal tubular epithelial cells (RTECs) are particularly vulnerable to acute kidney injury (AKI). While fatty acids are the preferred energy source for RTECs via fatty acid oxidation (FAO), FAO-mediated H2O2 production in mitochondria has been shown to be a major source of oxidative stress. We have previously shown that a mitochondrial flavoprotein, long-chain acyl-CoA dehydrogenase (LCAD), which catalyzes a key step in mitochondrial FAO, directly produces H2O2 in vitro. Furthermore, we showed that renal LCAD becomes hyposuccinylated during AKI. Here, we demonstrated that succinylation of recombinant LCAD protein suppresses the production of H2O2. Following 2 distinct models of AKI, cisplatin treatment or renal ischemia/reperfusion injury (IRI), LCAD-/- mice demonstrated renoprotection. Specifically, LCAD-/- kidneys displayed mitigated renal tubular injury, decreased oxidative stress, preserved mitochondrial function, enhanced peroxisomal FAO, and decreased ferroptotic cell death. LCAD deficiency confers protection against 2 distinct models of AKI. This suggests a therapeutically attractive mechanism whereby preserved mitochondrial respiration as well as enhanced peroxisomal FAO by loss of LCAD mediates renoprotection against AKI.

Keywords: Cell stress; Fatty acid oxidation; Metabolism; Nephrology.


Figures

Figure 1
Figure 1. LCAD expression in the kidneys.
(A) Anti-LCAD immunoblot in LCAD–/– versus WT mouse kidney lysates. GAPDH, loading control; HSP60, mitochondrial loading control. (B) Anti-LCAD immunostaining in LCAD–/– versus WT mouse kidney, costained with Lotus Tetragonolobus Lectin (LTL). (C) LCAD–/– versus WT mouse kidney homogenates were tested for palmitoyl-CoA (C16-CoA) dehydrogenase activities. n = 3–4. Scale bars: 100 μm. ***P < 0.001, using t test.
Figure 2
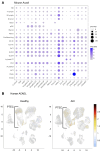
Figure 2. Differential expression of ACADL (LCAD) in renal cell clusters from healthy and AKI mouse and human kidneys.
(A) Data were derived from the Mouse Kidney scRNA-Seq Atlas from Katalin Susztak’s laboratory (https://susztaklab.com). scRNA-Seq data (36 samples) and bulk gene expression data (42 samples) from 18 commonly used mouse kidney disease models. (A) Mouse kidney models used to generate the scRNA-Seq atlas: APOL1, Apol1 transgenic; Control, WT control; Esrra, Esrra KO; FAN, folic acid nephropathy; IRI, ischemia reperfusion injury; LPS, endotoxin injection; Notch1, Notch1 transgenic; PGC1α, Pgc1a transgenic; UUO, unilateral ureteral obstruction. Note, IRI contains long and short IRI samples collected 1, 3, and 14 days after the ischemia; LPS contains samples obtained at 1, 4, 16, 27, 36, and 48 hours after the LPS injection. (B) Data were derived from the Kidney Precision Medicine Project (KPMP) Kidney Tissue Atlas. Healthy, n = 28; AKI, n = 14; CKD, n = 37. Data were derived from the Kidney Precision Medicine Project (KPMP) Kidney Tissue Atlas, which was accessed on November 1, 2024.
Figure 3
Figure 3. LCAD succinylation linked to renoprotection.
(A) Mass spectrometry revealed hyposuccinylation of several lysine residues of LCAD in kidneys after AKI compared with contralateral uninjured kidneys. (B) Succinylation reduces mouse LCAD oxidase activity. n = 4, ****P < 0.0001, using t test.
Figure 4
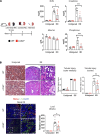
Figure 4. LCAD–/– kidneys are protective against cisplatin-AKI in sex-independent manner.
(AC) Female mouse studies. (D and E) Male studies (A and D) Serum analyses for BUN, creatinine, Albumin and Phosphorus indicate that the level of renal functional impairment is decreased in LCAD–/– mice 3 days post cisplatin treatment in sex independent manner. (B and E) H&E-stained kidney tissues demonstrate that renal tubular injury is mitigated in LCAD–/– kidneys 3 days after cisplatin treatment in sex independent manner. Glomeruli indicated by #; proteinaceous cast indicated by +. n = 8–11. Representative images and semiquantitative scoring for renal tubular damage at day 3 after cisplatin treatment are shown. Cortex and outer medulla regions are scored separately. (C) LCAD–/– kidneys decreased mRNA (Lcn2) and immunostained tubular cells for NGAL or KIM-1 in whole kidneys 3 days after cisplatin treatment. Scale bars: 50 μm. *P < 0.05; ***P < 0.001; ****P < 0.0001, using 1-way ANOVA post hoc Tukey multiple comparison. Arrowheads indicate damaged tubules.
Figure 5
Figure 5. LCAD–/– kidneys are protective against ischemic-AKI.
(A) Schematic of ischemia reperfusion injury regime. Serum analyses for BUN, creatinine, and phosphorus indicate that the level of renal functional impairment is decreased in LCAD–/– mice 7 days after renal IRI in male mice. (B) H&E-stained kidney tissues demonstrate that renal tubular injury is mitigated in LCAD–/– kidneys 7 days postrenal IRI. Glomeruli indicated by #; proteinaceous cast indicated by +; dilated tubule indicated by *. n = 6–7. Representative images and semiquantitative scoring for renal tubular damage at day 7 after renal IRI are shown. Cortex and outer medulla are scored separately. LCAD–/– kidneys decreased mRNA (Lcn2) and immunostained tubular cells for NGAL in whole kidneys 7 days after renal IRI. Scale bars: 50 μm. *P < 0.05; **P < 0.01; ***P < 0.001, using 1-way ANOVA post hoc Tukey multiple comparison.
Figure 6
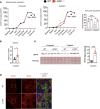
Figure 6. LCAD–/– kidneys preserve mitochondrial function in cisplatin-AKI.
(A) Oroboros O2k respirometry revealed that Complex I of the electron transport chain was increased in LCAD–/– kidneys compared with WT 3 days after cisplatin treatment. (B) mtDNA levels are increased in LCAD–/– kidneys. (C) LCAD–/– kidneys increased immunoblotted succinate dehydrogenase complex flavoprotein subunit A (SDHA) expression in whole kidney lysates 3 days after cisplatin treatment. A representative blot image and the quantified data for cisplatin treated samples are shown. (D) Immunostained SDHA in whole kidneys of WT versus LCAD–/– 3 days after cisplatin treatment. Scale bars: 50 μm. *P < 0.05; ****P < 0.0001, using 1-way ANOVA post hoc Tukey multiple comparison (A) or t test (B and C).
Figure 7
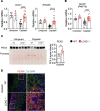
Figure 7. LCAD–/– kidneys enhance peroxisomal fatty acid oxidation (FAO) in cisplatin-AKI.
(B) LCAD–/– kidneys increase mRNA levels of peroxisomal FAO associated genes (Acox1 and Ehhadh). (B) mRNA levels of PMP70 (peroxisomal marker) are increased in LCAD–/– kidneys 3 days after cisplatin treatment. (C) Immunoblotted PEX5 (peroxisomal marker) is increased in LCAD–/– kidneys 3 days after cisplatin treatment. (D) PEX5 immunostaining images are also shown. Scale bars: 50μm. *P < 0.05; **P < 0.01; ***P < 0.001; ****P < 0.0001, using 1-way ANOVA post hoc Tukey multiple comparison or t test.
Figure 8
Figure 8. LCAD–/– kidneys mitigate oxidative stress and ferroptosis in cisplatin-AKI.
(A) The in vivo oxidative stress marker, isofuran/F2- Isoprostane (IsoF/F2-IsoP) ratio, is decreased in LCAD–/– kidneys 3 days after cisplatin treatment. (B) TUNEL+ dying cells are decreased in LCAD–/– kidneys 3 days after cisplatin treatment. (C) Ferroptosis associated genes Ptges2 are decreased while Gpx4 is increased in LCAD–/– kidneys 3 days after cisplatin treatment. (D) Immunoblotted GPX4 expression is increased in LCAD–/– kidneys 3 days after cisplatin treatment. Scale bars: 50 μm. *P < 0.05; **P < 0.01; ****P < 0.0001, using 1-way ANOVA post hoc Tukey multiple comparison or t test.
Figure 9
Figure 9. Proposed model by which loss of or hypersuccinylation of LCAD mediates renoprotection against AKI.
Enhanced peroxisomal activity due to loss of LCAD reduces H2O2 production and contributes to renoprotection against AKI. Ferroptotic cell death (ROS-associated form of cell death) is attenuated in LCAD–/– kidneys. S, hypersuccinylation.

Update of

References

    1. Clark AJ, Parikh SM. Mitochondrial metabolism in acute kidney injury. Semin Nephrol. 2020;40(2):101–113. doi: 10.1016/j.semnephrol.2020.01.002. - DOI - PMC - PubMed
    1. Seifert EL, et al. Electron transport chain-dependent and -independent mechanisms of mitochondrial H2O2 emission during long-chain fatty acid oxidation. J Biol Chem. 2010;285(8):5748–5758. doi: 10.1074/jbc.M109.026203. - DOI - PMC - PubMed
    1. Rosca MG, et al. Oxidation of fatty acids is the source of increased mitochondrial reactive oxygen species production in kidney cortical tubules in early diabetes. Diabetes. 2012;61(8):2074–2083. doi: 10.2337/db11-1437. - DOI - PMC - PubMed
    1. Kobayashi K, et al. Ultrastructural changes of renal tubules in the riboflavin deficient mouse. Virchows Arch B Cell Pathol Incl Mol Pathol. 1980;34(2):99–109. doi: 10.1007/BF02892411. - DOI - PubMed
    1. Stadler K, et al. The evolving understanding of the contribution of lipid metabolism to diabetic kidney disease. Curr Diab Rep. 2015;15(7):40. doi: 10.1007/s11892-015-0611-8. - DOI - PMC - PubMed

MeSH terms

LinkOut - more resources