. 2025 Apr 1;135(7):e175972.
doi: 10.1172/JCI175972.

TRIB3 mediates vascular calcification by facilitating self-ubiquitination and dissociation of Smurf1 in chronic kidney disease

Affiliations

TRIB3 mediates vascular calcification by facilitating self-ubiquitination and dissociation of Smurf1 in chronic kidney disease

Yihui Li et al. J Clin Invest. .

Abstract

The osteogenic environment promotes vascular calcium phosphate deposition and aggregation of unfolded and misfolded proteins, resulting in ER stress in chronic kidney disease (CKD). Controlling ER stress through genetic intervention is a promising approach for treating vascular calcification. In this study, we demonstrated a positive correlation between ER stress-induced tribble homolog 3 (TRIB3) expression and progression of vascular calcification in human and rodent CKD. Increased TRIB3 expression promoted vascular smooth muscle cell (VSMC) calcification by interacting with the C2 domain of the E3 ubiquitin-protein ligase Smurf1, facilitating its K48-related self-ubiquitination at Lys381 and Lys383 and subsequent dissociation from the plasma membrane and nuclei. This degeneration of Smurf1 accelerated the stabilization of the osteogenic transcription factors RUNX family transcription factor 2 (Runx2) and SMAD family member 1 (Smad1). C/EBP homologous protein and activating transcription factor 4 are upstream transcription factors of TRIB3 in an osteogenic environment. Genetic KO of TRIB3 or rescue of Smurf1 ameliorated VSMC and vascular calcification by stabilizing Smurf1 and enhancing the degradation of Runx2 and Smad1. Our findings shed light on the vital role of TRIB3 as a scaffold in ER stress and vascular calcification and offer a potential therapeutic option for CKD.

Keywords: Cardiology; Cardiovascular disease; Ubiquitin-proteosome system; Vascular biology.


Figures

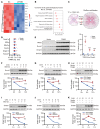
Figure 1
Figure 1. Elevated VSMC TRIB3 expression in ER stress.
(A) Representative Western blots and analysis of TRIB3, GPR78, and phosphorylation of PERK expression in primary hVSMCs following treatment with L-glucose osmotic medium control (CTR) or 2.6 mM phosphate (Pi), 25 mM glucose plus 10 nM insulin (HG+Ins), 25 mM glucose (HG), 10 nM human bone morphogenetic protein 2 (BMP2), 80 μg/mL ox-LDL, 0.1 μg/mL tunicamycin, 5 μM 4-phenylbutyric acid (4PBA). n = 6 per group. Quantification of the protein expression of TRIB3, GPR78, and phosphorylation of PERK. (B) RT-qPCR analysis of TRIB3 relative mRNA expression in hVSMCs following indicated treatment. n = 6 per group. (C and D) RT-qPCR analysis of TRIB3 relative mRNA expression in carotid and renal arteries of patients with chronic kidney disease (CKD). n = 10–17 per group. (E and F) Correlation of TRIB3 relative mRNA expression and calcium deposition in CTR carotid and renal artery plaque tissue and that from patients with CKD. P represents the 2-tailed probability value of the Pearson’s correlation. n = 18 per group. (G) Representative Western blots and analysis of TRIB3, GPR78, and PERK protein expression in renal arteries from patients with CKD and individuals with normal renal function (n = 12 in each). (H) Representative original histological images and IHC analysis showing TRIB3 expression and ectopic calcification in CTR renal arteries and those from patients with CKD (n = 15 per group). alizarin red staining identifies mid-to-late-stage mineralization, Von Kossa staining identifies late-stage calcification, and osteopontin (OPN) (n = 6 per group) serves as a marker for osteogenic differentiation. Scale bar: 100 μm. Data are shown in scatter dot plots and as the arithmetic mean ± SEM (AU). Throughout the figure, relative values were compared against those of the CTR group. Statistical analyses were performed using 1-way ANOVA (A and B) and unpaired 2-tailed Student’s t test with Welch correction (C, D, G, and H). ***P < 0.001, statistically significant vs. CTR.
Figure 2
Figure 2. TRIB3 suppresses Runx2 and Smad1 degradation in VSMCs.
(A) Heatmap of differentially expressed genes (DEGs) of vascular calcification phenotype gene cluster (DISGENET C0342649) in hVSMCs transfected with negative control (NC) or siTRIB3. (B) Gene ontology (GO) analysis of DEGs in hVSMCs transfected with NC or siTRIB3. (C) The overlap of transcription factor (TF) binding signature analysis for DEGs after TRIB3 KO and DISGENET C0342649. (D) RT-qPCR analysis of osteogenic TF (Runx2, Smad1, Sox2, Msx2, Klf6, and Twist1) mRNA expression in hVSMCs transfected with blank vector (Vector) and TRIB3 overexpression adenovirus (TRIB3). n = 6 per group. Statistical analyses were performed using the unpaired 2-tailed Student’s t test. Relative values were compared against those of the vector group. (E) Representative Western blots and analysis of protein expression in TRIB3, Runx2, and Smad1 in hVSMCs transfected with vector and TRIB3. n = 6 per group. Statistical analyses were performed using the unpaired 2-tailed Student’s t test. Relative values were compared against those of the vector group. ***P < 0.001, statistically significant vs. vector. (FK) Representative Western blots and analysis of Runx2 (FH) and Smad1 (IK) protein expression in hVSMCs following treatment with or without MG132 (10 μM, 4 h), Pi (2.6 mM, 48 h), vector, or TRIB3 (48 h) and incubation with CHX (50 μg/mL) for indicated time points. n = 6 per group. CHX, cycloheximide. Statistical analyses were performed using repeated measures 2-way ANOVA. Data are shown in scatter dot plots and as the arithmetic mean ± SEM (AU). ***P < 0.001, statistically significant vs. CHX or CHX vector.
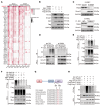
Figure 3
Figure 3. TRIB3 promotes Runx2 and Smad1 ubiquitination via interacting with Smurf1.
(A) Matrix bubble diagram of E3 ubiquitin ligases prediction of Runx2 and Smad1 in human and mouse. (B) Representative Western blots of protein expression in Runx2 and Smad1 in hVSMCs transfected with exogenous TRIB3, Smurf1, and Smurf2 plasmid. The presented results represent 1 of 3 independent replicates. (C) Representative Western blots of protein expression in TRIB3 and Smurf1 in hVSMCs and mVSMCs treated with Pi (2.6 mM, 48 h). The presented results represent 1 of 3 independent replicates. (D) Representative Western blots of ubiquitination of Smurf1 in hVSMCs transfected with shTRIB3 and treated with Pi (2.6 mM) at the indicated times. The presented results represent 1 of 3 independent replicates. (E) Representative Western blots of ubiquitination of exogenous Smurf1 in HEK293T cells. The presented results represent 1 of 3 independent replicates. (F) Representative Western blots of ubiquitination of exogenous Smurf1 in HEK293T cells transfected with plasmids encoding the mutant of TRIB3 238–266aa (TRIB3Δ), HA-ubiquitin (K48), and HA-ubiquitin (K63). The presented results represent 1 of 3 independent replicates. (G) The multiple sequence alignment and K48 ubiquitin site prediction for Smurf1. (H) Representative Western blots of Smurf1 ubiquitination assay with exogenous Smurf1 (Smurf1 WT), Smurf1 mutant with the lysine residue replaced by arginine in K381 (K381R), and K383 (K383R). The presented results represent 1 of 3 independent replicates.
Figure 4
Figure 4. TRIB3 interacted Smurf1 and promoted its self-ubiquitination through C2 domain.
(A) Structure docking to simulate the interaction between Smurf1 and TRIB3. (B) Smurf1 domain structure and deletion mutants used in the study (WT, ΔC2, C2, ΔHECT, HECT, and WW). (C) Representative IP Western blots of Myc-TRIB3 and Flag-Smurf1 and mutants in HEK293T cells were transfected with plasmid for 48 hours. The presented results represent 1 of 3 independent replicates. (D) Representative immunofluorescence of Smurf1 and αSMA in hVSMCs transfected with TRIB3, Smurf1 WT, and Smurf1ΔC2 for 48 hours. The DAPI indicated the nuclei, and the margin of αSMA indicated the plasma membrane (PM). The white line is the path of the colocalization analysis. Scale bar: 20 μm. The presented results represent 1 of 3 independent replicates. (E) Representative Western blots of cellular fractionation showing Smurf1 expression in the nuclear and cytoplasmic fractions in hVSMCs. The presented results represent 1 of 3 independent replicates. (F) Representative Western blots of ubiquitination of exogenous Smurf1 and Smurf1ΔC2 with TRIB3 in HEK293T cells. The presented results represent 1 of 3 independent replicates. (G) Representative alizarin red staining of hVSMCs transfected with plasmids encoding mutant of Smurf1, Smurf1ΔC2, and TRIB3 and then treated with Pi (2.6 mM) for 7 days (n = 6 in each). The calcium contents analysis of hVSMCs transfected with plasmids encoding mutant of Smurf1, Smurf1ΔC2, and TRIB3 and then treated with Pi (2.6 mM) for 7 days. Statistical analyses were performed using 2-way ANOVA. Relative values were compared against those of the CTR group. ***P < 0.001, statistically significant vs. CTR. †††P < 0.001, statistically significant vs. TRIB3. Each experiment was repeated independently for a minimum 3 times. Data are shown in scatter dot plots and as the arithmetic mean ± SEM (AU).
Figure 5
Figure 5. ATF4 and CHOP induced TRIB3 transcription in phosphorate stimuli.
(A) IGV was used to display data for the TRIB3 loci, with ChIP-Seq tracks and sequence logo for ATF4 and CHOP. (B) Wild-type or mutant TRIB3 promoter luciferase plasmid. (C) (41.Luciferase activity of mVSMCs transfected with the TRIB3-WT or TRIB3-mut promoter luciferase plasmid and treated with Pi (2.6 mM) for 12 h or transfected with shRNA to knock down ATF4 or CHOP for 48 h). Statistical analyses were performed using 2-way ANOVA. ***P < 0.001, statistically significant vs. 1.TRIB3-WT without Pi treatment; †††P < 0.001, statistically significant vs. 4.transfected with shCTR and TRIB3-WT with Pi treatment. (D) ChIP-PCR showing enrichment of both ATF4 and CHOP at the TRIB3 binding site (BS) in mVSMCs treated Pi (2.6 mM) for 24 hours. Statistical analyses were performed using 1-way ANOVA. **P < 0.01, ***P < 0.001, statistically significant vs. 0 h Pi treatment (ATF4); ††P < 0.01, †††P < 0.001, statistically significant vs. 0 h Pi treatment (CHOP). (E and F) Formaldehyde-assisted isolation of regulatory elements–ChIP (FAIRE-ChIP) PCR was performed on Pi (2.6 mM) for indicated times in mVSMCs. Statistical analyses were performed using repeated measures 2-way ANOVA. (GI) Representative Western blots of TRIB3, ATF4, and CHOP in mVSMCs treated with Pi (2.6 mM) at the indicated times after pretreatment with 4PBA 5 μM for 12 hours or transfection with shRNA for knockdown of ATF4 and CHOP for 48 hours. Statistical analyses were performed using repeated measures 2-way ANOVA. Data are shown in scatter dot plots and as the arithmetic mean ± SEM (AU). *P < 0.05, **P < 0.01, ***P < 0.001, statistically significant vs. 0 h treatment, DMSO, or shCTR. Each experiment was repeated independently 3–6 times. Data are shown in scatter dot plots and as the arithmetic mean ± SEM (AU).
Figure 6
Figure 6. Effect of TRIB3 deficiency on ER-induced osteogenic transdifferentiation of primary aortic smooth muscle cells.
(A) Representative alizarin red staining of hVSMCs transfected with shCTR and shTRIB3 plasmids and then treated with L-glucose osmotic medium control (CTR), solvent (Sol), 2.6 mM Pi plus 25 mM HG plus 10 nM Ins, 25 mM HG, 10 nM BMP2, 80 μg/mL ox-LDL, 0.1 μg/mL TM, or 5 μM 4PBA for 7 days. (B) Calcium content analysis for A (n = 6 in each). Statistical analyses were performed using 1-way ANOVA. Relative values were compared against those of the CTR group. (C) Representative alizarin red staining of mVSMCs from WT and TRIB3-KO mice that were then treated with 2.6 mM Pi plus 25 mM HG plus 10 nM Ins, 25 mM HG, 10 nM BMP2, 80 μg/mL ox-LDL, 0.1 μg/mL TM, or 5 μM 4PBA for 7 days. (D) Calcium content analysis for C (n = 6 in each). Statistical analyses were performed using 1-way ANOVA. Relative values were compared against those of the CTR group. (E) RT-qPCR analysis of osteogenic factor (BGLAP, ALPL, BMP2, and COL1A1) mRNA expression in hVSMCs transfected with shCTR and shTRIB3 plasmids and then treated with Pi (2.6 mM, 7d) (n = 6 in each). Statistical analyses were performed using 2-way ANOVA. ***P < 0.001, statistically significant vs. CTR or Sol; †††P < 0.001, statistically significant vs. Pi plus shCTR. Data are shown in scatter dot plots and as the arithmetic mean ± SEM (AU).
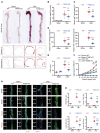
Figure 7
Figure 7. Effect of TRIB3 deficiency during acute kidney injury–induced CKD vascular calcification in mice.
(A) Representative alizarin red staining of whole aorta and thoracic and abdominal aorta section images showing aortic alizarin red staining in acute kidney injury–induced (AKI-induced) CKD mice. Scale bar: 100 μm. Calcified areas are shown with red staining. (B) Calcium content analysis in the aortic arch of AKI-induced CKD mice, normalized by dry weight. Statistical analyses were performed using 2-way ANOVA. (C and D) The ratio of alizarin red–positive area to the whole aortic area, thoracic aorta, and abdominal aorta in the indicated group of mice (n = 12 in each). Statistical analyses were performed using 2-way ANOVA. (E) Abdominal aortic pulse wave velocity (PWV) in AKI-induced CKD mice (n = 12 in each). Statistical analyses were performed using 2-way ANOVA. (F) Wall tension (n = 3 rings, 6 mice per group; mN/mm) during mechanical stretch (mm) ex vivo of abdominal aorta isolated from AKI-induced CKD mice. (G) Representative immunofluorescence of TRIB3, Smurf1, Runx2, and Smad1 in thoracic aortic tissue of AKI-induced CKD mice. Scale bar: 50 μm. (H) The quantitative analysis for G (n = 5 incontinuous sections from 10 mice per group). Statistical analyses were performed using 2-way ANOVA. **P < 0.01, ***P < 0.001, statistically significant vs. sham WT mice; P < 0.05, ††P < 0.01, and †††P < 0.001, statistically significant vs. CKD WT mice. n = 15 per group unless otherwise indicated. Data are shown in scatter dot plots and as the arithmetic mean ± SEM (AU).
Figure 8
Figure 8. Effect of TRIB3 deficiency during metabolic CKD-induced vascular calcification in mice.
(A) Representative alizarin red staining of whole aorta images, alizarin red staining of aortic valve sections, and Von Kossa staining of aortic valve sections in metabolic CKD mice. Scale bar: 100 μm. Calcified areas are shown with red staining. (B) Calcium content analysis in the aortic arch of metabolic CKD mice, normalized by dry weight. (C) The area ratio of calcification to the whole aortic area in metabolic CKD mice. Statistical analyses were performed using 2-way ANOVA. (D) The ratio of alizarin red–positive and Von Kossa–positive area to the whole aortic valves (sections with max valve plaque lesion area). Statistical analyses were performed using 2-way ANOVA. (E) PWV in metabolic CKD mice. Statistical analyses were performed using 2-way ANOVA. (F) Representative immunofluorescence of TRIB3, Smurf1, Runx2, and Smad1 in thoracic aortic tissue of metabolic CKD mice. Scale bar: 50 μm. (G) The quantitative analysis for F (n = 5 incontinuous sections from 10 mice per group). Statistical analyses were performed using 2-way ANOVA. **P < 0.01, ***P < 0.001, statistically significant vs. sham ApoE-KO mice; ††P < 0.01, †††P < 0.001, statistically significant vs. diabetes mellitus. ApoE-KO mice. n = 12 per group unless otherwise indicated. Data are shown in scatter dot plots and as the arithmetic mean ± SEM (AU).

References

    1. Ibels LS, et al. Arterial calcification and pathology in uremic patients undergoing dialysis. Am J Med. 1979;66(5):790–796. - PubMed
    1. Raggi P, et al. Cardiac calcification in adult hemodialysis patients. A link between end-stage renal disease and cardiovascular disease? J Am Coll Cardiol. 2002;39(4):695–701. doi: 10.1016/S0735-1097(01)01781-8. - DOI - PubMed
    1. Stompór T. An overview of the pathophysiology of vascular calcification in chronic kidney disease. Perit Dial Int. 2007;27 Suppl 2:S215–S222. - PubMed
    1. Budoff MJ, et al. Relationship of estimated GFR and coronary artery calcification in the CRIC (chronic renal insufficiency cohort) study. Am J Kidney Dis. 2011;58(4):519–526. doi: 10.1053/j.ajkd.2011.04.024. - DOI - PMC - PubMed
    1. Kazancioğlu R. Risk factors for chronic kidney disease: an update. Kidney Int Suppl (2011) 2013;3(4):368–371. doi: 10.1038/kisup.2013.79. - DOI - PMC - PubMed

MeSH terms