. 2025 Apr 15;85(8):1479-1495.
doi: 10.1158/0008-5472.CAN-24-1757.

Concurrent Inhibition of the RAS-MAPK Pathway and PIKfyve Is a Therapeutic Strategy for Pancreatic Cancer

Affiliations

Concurrent Inhibition of the RAS-MAPK Pathway and PIKfyve Is a Therapeutic Strategy for Pancreatic Cancer

Jonathan M DeLiberty et al. Cancer Res. .

Abstract

Pancreatic ductal adenocarcinoma (PDAC) is characterized by KRAS- and autophagy-dependent growth. Inhibition of the KRAS-RAF-MEK-ERK pathway enhances autophagic flux and dependency, and concurrent treatment with the nonspecific autophagy inhibitor chloroquine (CQ) and ERK-MAPK pathway inhibitors can synergistically block PDAC growth. However, CQ is limited in terms of specificity and potency. To find alternative anti-autophagy strategies, in this study, we performed a CRISPR-Cas9 loss-of-function screen in PDAC cell lines that identified the lipid kinase phosphatidylinositol-3-phosphate 5-kinase (PIKfyve) as a growth-promoting gene. PIKfyve inhibition by the small molecule apilimod resulted in durable growth suppression, with much greater potency than CQ treatment. PIKfyve inhibition caused lysosomal dysfunction, reduced autophagic flux, and led to the accumulation of autophagy-related proteins. Furthermore, PIKfyve inhibition blocked the compensatory increases in autophagic flux associated both with MEK inhibition and with direct RAS inhibition. Accordingly, combined inhibition of PIKfyve and the RAS-MAPK pathway showed robust growth suppression across a panel of KRAS-mutant PDAC models. Growth suppression was due, in part, to potentiated cell-cycle arrest and induction of apoptosis following loss of inhibitor of apoptosis proteins. These findings indicate that concurrent inhibition of RAS and PIKfyve is a synergistic, cytotoxic combination that may represent a therapeutic strategy for PDAC. Significance: PIKfyve inhibition effectively blocks autophagy in multiple models of KRAS-mutant pancreatic cancer and can synergize with inhibitors of members of the RAS-MAPK pathway, providing an effective combination strategy for pancreatic cancer.


Conflict of interest statement

K.L. Bryant has received research funding support from SpringWorks Therapeutics. A.D. Cox has consulted for Eli Lilly and Mirati Therapeutics. C.J. Der was a consultant/advisory board member for Cullgen, Deciphera Pharmaceuticals, Kestrel Therapeutics, Mirati Therapeutics, Reactive Biosciences, Revere Pharmaceuticals, Revolution Medicines, Ribometrix, Sanofi and SHY Therapeutics. C.J.D. has received research funding support from Deciphera Pharmaceuticals, Mirati Therapeutics, Reactive Biosciences, Revolution Medicines, and SpringWorks Therapeutics. E.F. Petricoin is a shareholder and consultant of Avant Diagnostics, TheraLink Technologies, Inc. and Perthera. E.F. Petricoin received funding support from Mirati Therapeutics, Genentech, Inc., and Abbvie, Inc.

Figures
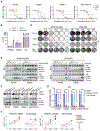
Figure 1.
Figure 1.
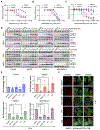
PIKfyve inhibition reduces proliferation and autophagic flux in KRAS-mutant PDAC cell lines. A, Five-day viability assay following PIKfyvei (apilimod, [0.76 – 50,000 nM]) DC661 ([0.76 – 50,000 nM]) or CQ (chloroquine, [0.76 – 50,000 nM]) treatment. Each data point represents mean ± SD of three independent experiments. B, GI50 values from data plotted in A, error bars denote mean ± SD. C, Fourteen-day colony formation assay following PIKfyvei (apilimod) or chloroquine (CQ) treatment (representative of three independent experiments). D, Immunoblots of Pa14C and Pa02C cells treated for 24 or 120 hours with PIKfyvei (apilimod) or CQ at indicated concentrations (representative of three independent experiments). E, Immunoblots of PDAC cell lines following CRISPR-mediated PIKfyve depletion (representative of two independent experiments). Values represent relative PIKfyve protein expression, normalized to control (sgGFP infected) cell lines. F, Log2 fold-change values for LC3B and p62 upon treatment with either PIKfyvei (apilimod) or CQ relative to vehicle over a 72-hour time course. Differential expression and statistical significance were determined by linear modeling and empirical Bayes moderation in LIMMA. G, PDAC cells stably expressing mCherry-EGFP-LC3B were treated with vehicle, PIKfyvei (apilimod, 100 nM), or CQ (chloroquine, 6.25 μM) and imaged by confocal microscopy. Data points represent mCherry/EGFP ratio from each field (at least 10 fields per condition). Plot is representative of three independent experiments per cell line. Error bars represent mean ± SD of three independent experiments and statistical significance was determined by unpaired student’s t test. *, P < 0.05; **, P < 0.01; ****, P < 0.0001.
Figure 2.
Figure 2.
Chemically distinct PIKfyve inhibitors phenocopy apilimod treatment in PDAC cells. A, Five-day viability assay following APY0201 treatment (3.9 – 1,000 nM). Each data point represents the mean ± SD of three independent experiments. B, Five-day viability assay following YM201636 (39 – 10,000 nM) treatment. Each data point represents the mean ± SD of three independent experiments. C, Five-day viability assay following treatment with PIKfyve-specific chemical probe C17 (solid lines, 1.5 – 10,000 nM) and inactive enantiomer C30 (dotted lines, 1.5 – 10,000 nM). Each data point represents the mean ± SD of three independent experiments. D, Immunoblots of Pa14C, Pa02C, PANC-1, and MIA PaCa-2 cell lines treated for 24 or 120 hours with APY0201 or C17 at indicated concentrations (representative of three independent experiments). E, PDAC lines stably expressing mCherry-EGFP-LC3B were treated for 24 hours with either APY0201 (100 nM), YM201636 (1 μM), C17 (active analog, 1 μM) or C30 (inactive analog, 1 μM) and imaged by confocal microscopy. Data points represent mCherry/EGFP ratio from each field (at least 10 fields per condition). Plots are representative of three independent experiments per cell line. Error bars denote mean ± SD and statistical significance was determined by unpaired student’s t test. F, Representative images of Pa02C cells described and quantified in E. Scale bar, 20 μm. *, P < 0.05; **, P < 0.01; ***, P < 0.001; ****, P < 0.0001.
Figure 3.
Figure 3.
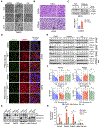
PIKfyvei treatment results in the accumulation of vacuoles enriched for LAMP1 that exhibit impaired cargo degradation. A, Representative wide field images of Pa02C cell line treated with DMSO, PIKfyvei (100 nM), and CQ (6.25 μM) for 24, 72, and 120 hours. Scale bars, 75 μm. B, H&E staining of KPC2-derived orthotopic tumors treated with vehicle (0.5% methylcellulose) or PIKfyvei (apilimod mesylate, 90 mg/kg, P.O., BID x 4 days). Images are representative. Scale bar, 50 μm. C, Top, immunoblot of KPC2-derived orthotopic tumors treated with vehicle (0.5% methylcellulose) or PIKfyvei (apilimod mesylate, 90 mg/kg, P.O., BID x 4 days). Bottom, densitometry of relative LC3B-II normalized to vehicle control (dotted line). Each data point represents a unique portion of the same tumor from blot above. Data representative of three independent experiments. D, Representative confocal immunofluorescence images of individual and merged staining for EEA-1 (green) LAMP-1 (red) and DAPI (blue) in Pa14C and Pa02C cell lines treated with DMSO or PIKfyvei (apilimod, 50 nM) for 24 and 72 hours. Scale bars, 20 μm. E, Immunoblots of Pa14C, Pa02C, PANC-1, and MIA PaCa-2 cells treated with DMSO, PIKfyvei (apilimod, 100 nM) or CQ (6.25 μM) for 72 hours prior to stimulation with epidermal growth factor (EGF, 50 ng/mL) for 0, 1, 2, 3 or 4 hours (representative blots of three independent experiments). F, EGFR blots from E were quantified by densitometry, normalized to DMSO treatment and 0 hours EGF stimulation (dotted line), and plotted. Data points represent three independent experiments; error bars denote mean ± SD of three independent replicates and statistical significance was determined by unpaired student’s t test. G, Immunoblots of Pa14C, Pa02C, PANC-1, and MIA PaCa-2 cells treated with DMSO, PIKfyvei (apilimod, 100 nM) or CQ (6.25 μM) for 72 hours. Pro-cathepsin B (inactive, top band), cathepsin B (active, bottom bands) and vinculin (loading control) protein levels were visualized. Representative blots from three independent experiments are shown. H, Pro-cathepsin and active cathepsin B protein levels from G were quantified by densitometry. The ratio of pro-to-active cathepsin is shown, values were normalized to DMSO (dotted line) and plotted. Quantification is average of two (Pa14C and Pa02C) or three (PANC-1 and MIA PaCa-2) independent experiments and statistical significance was determined by unpaired student’s t test. *, P < 0.05; **, P < 0.01; ***, P < 0.001; ****, P < 0.0001.
Figure 4.
Figure 4.
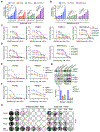
Dual inhibition of RAS ERK-MAPK pathway and PIKfyve impairs PDAC proliferation. A, Median values from flow cytometry analysis of GFP-LC3-RFP-LC3ΔG-expressing PDAC cell lines following treatment with DMSO or a dose response of RASi (RMC-7977, 72 hours). Data are representative of median ± SEM of three independent replicates and statistical significance was determined by unpaired student’s t test. B, Same as in A but cells were treated with a dose response of KRASi (MRTX1133 or MRTX849, 72 hours). C, Five-day viability assay in Pa14C, Pa02C, PANC-1, and MIA PaCa-2 cell lines following increasing doses of RASi (RMC-7977, 0.005 – 33 nM) alone or in combination with doses of PIKfyvei (apilimod, 6.2 – 500 nM). Each data point represents mean ± SEM of three independent experiments. D, Five-day viability assay in Pa14C, PANC-1 and MIA PaCa-2 cell lines following increasing doses of G12Di (MRTX1133, 0.015 – 100 nM; Pa14C and PANC-1) or G12Ci (MRTX849, 0.05 – 333 nM; MIA PaCa-2) alone and in combination with PIKfyvei (apilimod, 6.2 – 500 nM Each data point represents mean ± SEM of three independent experiments. E, Five-day viability assay in Pa14C and PANC-1 cell lines infected with control guide (sgGFP) or two distinct small guide RNAs against PIKfyve (sgPIKfyve-1, sgPIKfyve-2) and treated with a dose response of RASi (RMC-7977, 0.005 – 33 nM). Each data point represents mean ± SEM of three independent experiments. F, Same as in E but sgRNA-expressing cells were treated with G12Di (MRTX1133, 0.015 – 100 nM) for five days. Each data point represents mean ± SEM of three independent experiments. G, Top, immunoblot of Pa14C and PANC-1 cell lines following PIKfyve knockout. Values denote levels of PIKfyve protein level as measured by densitometry and normalized to sgGFP sample. Blots are representative of two independent experiments. Bottom, densitometry of relative PIKfyve normalized to sgGFP control. Each data point represents mean ± SD of two independent experiments. H, Fourteen-day colony formation assay in a panel of PDAC cell lines treated with DMSO, a fixed dose of RASi (RMC-7977: Pa14C, 0.1 nM; Pa02C, 3 nM; PANC-1, 10 nM; MIA PaCa-2, 3 nM) alone and in combination with a range of concentrations of PIKfyvei (apilimod, 15.6 – 250 nM) or CQ (chloroquine, 390 – 6250 nM) (representative of three independent experiments). *, P < 0.05; **, P < 0.01; ***, P < 0.001; ****, P < 0.0001.
Figure 5.
Figure 5.
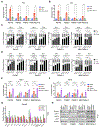
Combined inhibition of PIKfyve and the RAS ERK-MAPK pathway increases apoptosis and alters cell cycle regulation. A, Median values from flow cytometry analysis of GFP-LC3-RFP-LC3ΔG-expressing PDAC cell lines following treatment with DMSO (value denoted with dotted line), RASi (RMC-7977, 10 nM) or RASi in combination with PIKfyvei (apilimod, 100 nM) for 72 hours. Data representative of median ± SD of three independent replicates. Statistical significance was determined by performing unpaired student’s t test. B, Median values from flow cytometry analysis of GFP-LC3-RFP-LC3ΔG-expressing PDAC cell lines following treatment with DMSO, MEKi (mirdametinib, 100 nM) or MEKi in combination with PIKfyvei (apilimod, 100 nM) for 72 hours. Analysis was performed as in A. C, Flow cytometry analysis of propidium iodide-stained cells to determine the percentage of cells in specific phases of the cell cycle. Indicated cell lines were treated with DMSO, PIKfyvei (apilimod, 100 nM), and RASi (RMC-7977, 10 nM) alone or in combination for 24 and 72 hours, each data point represents mean ± SD of three independent experiments. Statistical significance was determined by performing unpaired student’s t test. D, Flow cytometry analysis of propidium iodide-stained cells to determine the percentage of cells in specific phases of the cell cycle. Indicated cell lines were treated with DMSO, PIKfyvei (apilimod, 100 nM), MEKi (mirdametinib, 100 nM) alone or in combination for 24 and 72 hours, analysis as in C. E, Five-day apoptosis assay (Annexin V-FITC/propidium iodide) in indicated cell lines following treatment with DMSO, RASi (RMC-7977, 10 nM) alone, PIKfyvei (apilimod, 100 nM) alone, or combination. Each data point represents mean ± SD of three independent experiments. Statistical significance was determined by performing unpaired student’s t test. F, Five-day apoptosis assay (Annexin V-FITC/propidium iodide) in indicated cell lines following treatment with DMSO, MEKi (mirdametinib, 100 nM), and PIKfyvei (apilimod, 100 nM) alone or in combination. Cells were collected and analyzed as in E. G, Densitometry quantification of a subset of the Proteome Profiler Human Apoptosis Array which was performed with lysates from Pa14C cells treated with DMSO, MEKi (mirdametinib, 100 nM), or PIKfyvei (apilimod,100 nM), alone or in combination for 72 hours. Error bars denote mean ± SD of duplicate dots. H, Immunoblots of Pa14C, Pa02C, PANC-1, and MIA PaCa-2 cell lines treated for 72 hours with DMSO, MEKi (mirdametinib, 100 nM), and PIKfyvei (apilimod 100 nM) alone or in combination (representative of three independent experiments). *, P < 0.05; **, P < 0.01; ***, P < 0.001; ****, P < 0.0001.
Figure 6.
Figure 6.
Combined inhibition of PIKfyve and the RAS ERK-MAPK pathway synergistically impairs growth in PDAC organoids. A, Top, six-day viability assay in PT3, PT8, and hT105 PDAC patient-derived organoids following increasing doses of RASi (RMC-7977, 0.78 – 50 nM) alone or in combination with doses of PIKfyvei (apilimod, 0.625 – 10 μM). Each data point represents mean ± SD of three independent experiments. Bottom, BLISS synergy values calculated from data represented above. Tiles in heat map represent the BLISS synergy score for each combination (red = synergy, white = additivity, blue = antagonism). Heat maps represent mean BLISS synergy values of three independent experiments. B, Representative images of hT105 and PT6 human PDAC organoid cultures treated with DMSO, RASi (12.5 nM), PIKfyvei (apilimod, 5 μM), or the combination for six days. Scale bars, 50 μm. C, Top, six-day viability assay in PT3, PT8, and hT105 PDAC patient-derived organoids following increasing doses of MEKi (mirdametinib, 3.9 – 250 nM) alone or in combination with doses of PIKfyvei (apilimod, 0.625 – 10 μM). Each data point represents mean ± SD of three independent experiments. Bottom, BLISS synergy values calculated from data represented above. Tiles in heat map represent the BLISS synergy score for each combination. D, Representative images of hT105 human PDAC organoid cultures treated with DMSO, MEKi (mirdametinib, 2.5 μM), PIKfyvei (apilimod, 5 μM), or the combination and PT8 human PDAC organoids treated with DMSO, MEKi (mirdametinib, 125 nM), PIKfyvei (apilimod, 1.25 μM) or the combination for six days. Scale bars, 50 μm.

References

    1. Siegel RL, Giaquinto AN, Jemal A. Cancer statistics, 2024. CA Cancer J Clin 2024;74:12–49. - PubMed
    1. DeLiberty JM, Robb R, Gates CE, Bryant KL. Unraveling and targeting RAS-driven metabolic signaling for therapeutic gain. Adv Cancer Res 2022;153:267–304. - PubMed
    1. Yang S, Wang X, Contino G, Liesa M, Sahin E, Ying H, et al. Pancreatic cancers require autophagy for tumor growth. Genes Dev 2011;25:717–29. - PMC - PubMed
    1. Perera RM, Stoykova S, Nicolay BN, Ross KN, Fitamant J, Boukhali M, et al. Transcriptional control of autophagy–lysosome function drives pancreatic cancer metabolism. Nature 2015;524:361–5. - PMC - PubMed
    1. Guo JY, Chen HY, Mathew R, Fan J, Strohecker AM, Karsli-Uzunbas G, et al. Activated Ras requires autophagy to maintain oxidative metabolism and tumorigenesis. Genes Dev 2011;25:460–70. - PMC - PubMed

MeSH terms