. 2025 Feb 18;6(2):101964.
doi: 10.1016/j.xcrm.2025.101964. Epub 2025 Feb 10.

Unraveling AURKB as a potential therapeutic target in pulmonary hypertension using integrated transcriptomic analysis and pre-clinical studies

Affiliations

Unraveling AURKB as a potential therapeutic target in pulmonary hypertension using integrated transcriptomic analysis and pre-clinical studies

Sarah-Eve Lemay et al. Cell Rep Med. .

Abstract

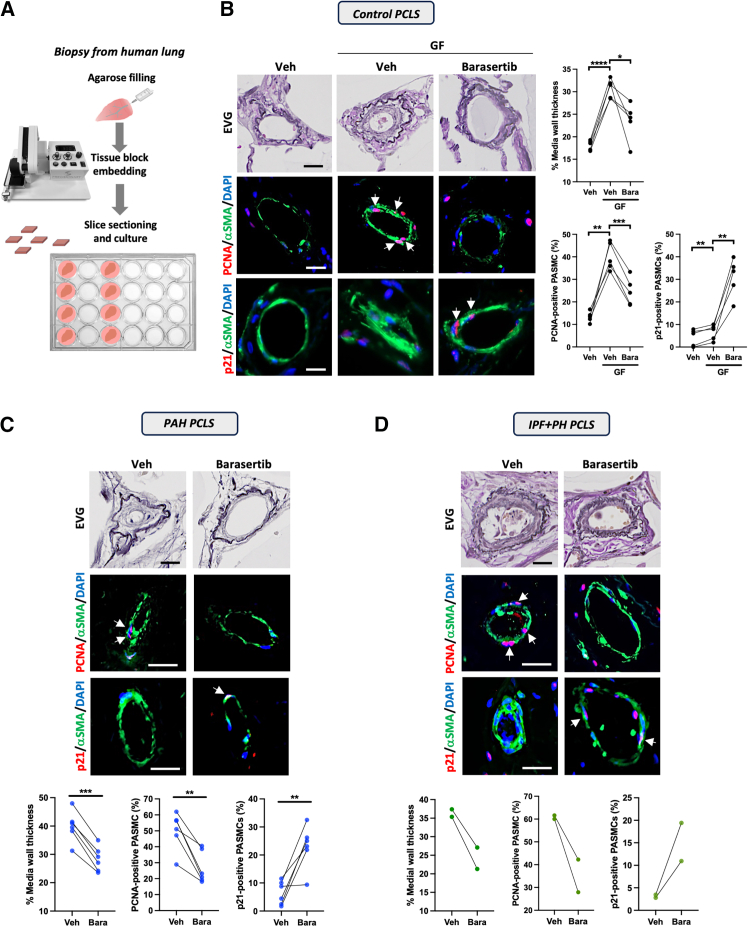
Despite advances in treatment, the prognosis for patients with pulmonary arterial hypertension (PAH) remains dismal, highlighting the need for further therapeutic advances. By using RNA sequencing on pulmonary artery smooth muscle cells (PASMCs), functional enrichment, and connectivity map analyses, we identify Aurora kinase B (AURKB) as a candidate therapeutic target. We show that AURKB inhibition blocks cell cycle progression and reverses the gene signature of PAH-PASMCs. We also report that PAH-PASMCs that escape apoptosis acquire a senescence-associated secretory phenotype. In vivo, AURKB inhibition using barasertib improves hemodynamics in two preclinical models of established PAH by attenuating pulmonary vascular remodeling. A therapeutic effect is also observed in human precision-cut lung slices. Finally, we demonstrate that the combination of barasertib with a p21 attenuator is more effective in reducing vascular remodeling than either drug alone. These findings provide insight into strategies for therapeutic manipulation.

Keywords: FOXM1; aurora kinase B; mitosis; pulmonary arterial hypertension; right ventricular failure; senescence; vascular remodeling.


Conflict of interest statement

Declaration of interests The authors declare no competing interests.

Figures

None
Graphical abstract
Figure 1
Figure 1
Integrated analysis of gene expression profiles of PAH-PASMCs revealing AURKB as potential actionable target (A) Volcano plot showing the differential expression analysis of the comparison PAH-PASMCs (n = 5) vs. control PASMCs (n = 4). The horizontal dashed line represents the adjusted p value cutoff (0.05) for the differentially expressed genes (DEGs). The vertical dashed lines represent the log2 fold change (FC) cutoff of DEGs in PAH-PASMCs vs. control cells. Orange circle: significantly upregulated genes; purple circles: significantly downregulated genes. Genes of interest are highlighted. (B) Gene set enrichment analysis (GSEA) charts showing the enrichment of genes related to G2M checkpoint and mitotic spindle in PAH-PASMCs. A positive normalized enrichment score (NES) value indicates enrichment in PAH-PASMCs. FDR, false discovery rate. (C) Overview of the approach used to identify a PAH-PASMC transcriptome signature. The diagram shows the number of studies screened, assessed for eligibility and included in our analysis, with reasons for exclusions at each stage. (D) Venn diagrams of overlapping down- and upregulated genes between the three transcriptomic datasets. (E) Chord diagram showing the top 12 most enriched biological processes (GO terms, determined using web-based DAVID tool) with their differentially expressed genes. On the left side of the circle, each differentially expressed gene is represented by a rectangle, with the color correlated to the value of the log2FC. Overlapping genes upregulated in PAH-PASMCs are displayed in red whereas downregulated genes are displayed in blue. Colored connecting lines determine gene involvement in the GO terms. (F) Reverser drugs obtained by CMap analysis of overlapping upregulated genes. Each bar label shows the corresponding drug name/code, treated cell line, and treatment time. (G) Representative western blots and corresponding quantification of AURKB in PASMCs isolated from control (n = 7) and patients with PAH (n = 13). Pearson’s correlation of AURKB and BIRC5 protein expression in control and PAH-PASMCs. Pearson’s correlation coefficient (R) and p value are shown. Protein expression was normalized to ponceau. Scatter dot plots show individual values and mean ± SEM. Assessment of the normality of the data was performed using Shapiro-Wilk test. Statistical analyses were performed using Student’s t test and Pearson correlation coefficient; ∗∗p < 0.01. See also Figures S1 and S2.
Figure 2
Figure 2
Impact of pharmacological and molecular inhibition of AURKB on PAH-PASMC proliferation and resistance to apoptosis (A) Representative fluorescent images and corresponding quantifications of EdU-labeled (green), Ki67-labeled (red), Annexin V-labeled (green), and TUNEL-labeled (green) PAH-PASMCs (n = 6) exposed or not to escalating doses of barasertib for 48 h. (B) Representative western blots and corresponding quantifications of phosphor-histone H3 (pHH3), p27, BIRC5, and PLK1 in PAH-PASMCs (n = 4; biological replicates) exposed or not to escalating concentrations of barasertib for 48 h. (C) Representative fluorescent images and corresponding quantifications of Ki67-labeled (red), Annexin V-labeled (green), and TUNEL-labeled (green) PAH-PASMCs (n = 4; biological replicates) subjected or not to AURKB knockdown using siRNA for 48 h. (D) Representative western blots and corresponding quantifications of AURKB, pHH3, p27, PLK1, and BIRC5 in PAH-PASMCs (n = 4–6; biological replicates) transfected with siAURKB (10 nM) or siRNA negative control (siSCRM) for 48 h. Protein expression was normalized to ponceau. Scale bars, 50 μm. Scatter dot plots show individual values and mean ± SEM. Assessment of the normality of the data was performed using Shapiro-Wilk test. Statistical analyses were performed using Student’s t test, Mann-Whitney, one-way ANOVA, or Kruskal-Wallis test followed by Dunnett’s post hoc test; ∗p < 0.05; ∗∗∗p < 0.01; ∗∗p < 0.001, and ∗∗∗∗p < 0.0001. See also Figures S3–S6.
Figure 3
Figure 3
Molecular confirmation of the predictive value of AURKB inhibition to reverse the transcriptomic signature of PAH-PASMCs (A) Volcano plot of differentially expressed genes in response to siAURKB treatment for 48 h across different PAH-PASMC cell lines (n = 4), with genes considered as differentially expressed (|log2FC| 1, adjusted p value 0.05), colored in brown (upregulated by siAURKB) or blue (downregulated by siAURKB). Genes of interest are highlighted. (B) Enrichment analysis performed by ShinyGO software v.0.77 showing the top GO biological processes (BP) in both down- and upregulated genes following AURKB depletion in PAH-PASMCs. (C) Gene set enrichment analysis (GSEA) charts showing the enrichment of genes related to G2/M checkpoint and p53 pathway. A positive and negative normalized enrichment score (NES) value indicates the up- and downregulation in siAURKB-treated PAH-PASMCs in relation to siSCRM, respectively. The heatmap depicts the expression levels of genes within the p53 pathways in response to siAURKB treatment. Expression values are represented as colors and range from brown (high expression) to blue (lowest expression). (D) Venn diagram of shared up- and downregulated transcripts between the indicated groups. (E) Representative western blots and corresponding quantifications of p21 and p53 in PAH-PASMCs treated or not with siAURKB for 48 h. (F) Representative western blots and corresponding quantifications of p21 and p53 in PAH-PASMCs (n = 5–6; biological replicates) exposed to various concentrations of barasertib for 48 h. Protein expression was normalized to ponceau. Scatter dot plots show individual values and mean ± SEM. Assessment of the normality of the data was performed using Shapiro-Wilk test. Statistical analyses were performed using Student’s t test and one-way ANOVA followed by Dunnett’s post hoc test; ∗p < 0.05 and ∗∗p < 0.01.
Figure 4
Figure 4
Senescence induction in AURKB-inhibited PAH-PASMCs (A) Schematic outline of the experimental procedures. Representative images of AURKB-inhibited PAH-PASMCs (n = 5) stained with X-gal for senescent-associated-β-galactosidase (SA-β-gal) activity. Quantifications showing the percentage of SA-β-gal-positive PAH-PASMCs are shown. (B) Representative western blots of p16, p21, p53, and LMNB1 expression in PAH-PASMCs (n = 5; biological replicates) exposed or not to barasertib (0.5 μM) or siAURKB for the indicated period. (C) Quantifications related to (B). (D) Volcano plot of differentially expressed genes in response to barasertib treatment for 24 h followed by drug washout for 2 days across different PAH-PASMC cell lines (n = 4; biological replicates), with genes considered as differentially expressed (FC > 2, adj. p < 0.05), colored in pink (upregulated by barasertib) or blue (downregulated by barasertib). Genes of interest are highlighted. (E) Gene set enrichment analysis (GSEA) charts showing the enrichment of genes related to tumor necrosis factor alpha (TNF-α) signaling and mitotic spindle. A positive and negative normalized enrichment score (NES) value indicates the up- and downregulation in barasertib-treated PAH-PASMCs in relation to vehicle, respectively. (F) Heatmap representing the mean log2 fold change value of genes found to be upregulated by barasertib (p adj. < 0.05) and encoding secreted proteins. (G) Balloon plot showing the fold change of gene expression of core SASP factors, IL-1β, IL-6, IL-8, GDF15, CCL2, and MMP3 in siAURKB- and barasertib-treated PAH-PASMCs (n = 5; biological replicates) as determined by qPCR. Scale bars, 50 μm. Scatter dot plots show individual values and mean ± SEM. Statistical analyses were performed using Student’s t test. #p < 0.05 (vs. siSCRM) and ∗p < 0.05 and ∗∗p < 0.01 (vs. Veh). See also Figure S7.
Figure 5
Figure 5
Therapeutic effects of barasertib in male rats exposed to Sugen/hypoxia (A) Study design using the Sugen/hypoxia (Su/Hx) rat model. (B) Pulmonary artery acceleration time (PAAT), right ventricular fractional area change (RVFAC), tricuspid annular plane systolic excursion (TAPSE), S wave, stroke volume (SV), and cardiac output (CO) determined by echocardiography at the end of the protocol in control, Su/Hx+Veh, and Su/Hx+barasertib male rats (n = 4–9/group). (C) Effect of AURKB inhibition on right ventricular systolic pressure (RVSP) and mean pulmonary artery pressure (mPAP), as assessed by right heart catheterization at the end of the protocol (n = 4–9/group). (D) Representative images of distal PAs stained with Elastica van Gieson (EVG) and quantification of vascular remodeling in control, Su/Hx+Veh, and Su/Hx+barasertib rats (n = 4–9/group). (E) Representative images of distal PAs labeled with proliferating cell nuclear antigen (PCNA, proliferative marker, red), p16, or p21 (n = 4–9/group). PASMCs were labeled with alpha smooth muscle actin (αSMA, green). The quantifications of the percentage of PASMCs positive for PCNA, p16, or p21 are shown. Scale bars, 20 μm. Scatter dot plots show individual values and mean ± SEM. Assessment of the normality of the data was performed using Shapiro-Wilk test. Statistical analyses were performed using one-way ANOVA or Kruskal-Wallis’s test followed by Dunnett’s post hoc test; ∗p < 0.05; ∗∗p < 0.01, and ∗∗∗p < 0.001. See also Figures S8 and S9.
Figure 6
Figure 6
Barasertib reduces vascular remodeling in human precision-cut lung slices (A) Experimental setup for precision-cut lung slices (PCLSs) from control, patients with PAH, and patients with idiopathic pulmonary fibrosis. (B) Representative images of distal PAs stained with Elastica van Gieson (EVG) or labeled with proliferating cell nuclear antigen (PCNA) or p21 in PCLSs prepared from control patients (n = 5) after exposure or not to a growth factor cocktail (GF, FGF2 + PDGF-BB + ET1) in presence or not to barasertib for 10 days. PASMCs were labeled with alpha smooth muscle actin (αSMA, green). The quantification of vascular remodeling and PASMCs positive for PCNA or p21 is shown. (C) Representative images of distal PAs stained with EVG or labeled with PCNA or p21 in PCLSs from patients with PAH (n = 6). (D) Representative images of distal PAs stained with EVG or labeled with PCNA or p21 in PCLSs from patients with IPF complicated with pulmonary hypertension (PH) (n = 2). For each experiment, the quantifications of vascular remodeling and PCNA- or p21-positive PASMCs (average of 40–45 arteries per patient) are shown. Scale bars, 25 μm. Values are represented as means ± SEM. Assessment of the normality of the data was performed using Shapiro-Wilk test. Statistical analyses were performed using repeated measures one-way ANOVA test followed by Dunnett’s post hoc test or paired Student’s t test; ∗p < 0.05; ∗∗p < 0.01, and ∗∗∗p < 0.001.
Figure 7
Figure 7
Barasertib combined with UC2288 attenuates pulmonary hypertension in Su/Hx-treated rats (A) Schematic illustrating the timelines for in vivo administration of barasertib and UC2288. (B) Effects of Su/Hx or treatments on body weight. #p < 0.05 (Bara+UC2288 vs. Bara). (C) Pulmonary artery acceleration time (PAAT), tricuspid annular plane systolic excursion (TAPSE), S wave, stroke volume (SV), cardiac output (CO), and right ventricular fractional area change (RVFAC), determined by echocardiography at the end of the protocol in control and Su/Hx rats treated with vehicle, barasertib, UC2288, or both drugs combined (n = 5–8/group). (D) Right ventricular systolic pressure (RVSP) and mean pulmonary artery pressure (mPAP) in control and Su/Hx rats treated with vehicle, barasertib, UC2288, or both drugs combined, as assessed by right heart catheterization at the end of the protocol (n = 4–9/group). (E) Right ventricular hypertrophy measured using the Fulton index. (F) Representative pulmonary histology from the Su/Hx-induced rat model of PH. Sections from all animals from treatment groups were stained with Elastica van Gieson (EVG) or labeled with cleaved caspase-3 and were digitally scanned using the Zeiss Axioscan 7 slide scanner. The quantifications of medial wall thickness and PASMCs positive for cleaved caspase-3 are shown. Scale bars, 50 μm. Scatter dot plots show individual values and mean ± SEM. Assessment of the normality of the data was performed using Shapiro-Wilk test. Statistical analyses were performed using one-way ANOVA or Kruskal-Wallis’s test followed by Tukey’s or Dunn’s post hoc test, respectively; ∗p < 0.05; ∗∗p < 0.01; ∗∗∗p < 0.001, and ∗∗∗∗p < 0.0001. See also Figures S10–S12.

References

    1. Simonneau G., Montani D., Celermajer D.S., Denton C.P., Gatzoulis M.A., Krowka M., Williams P.G., Souza R. Haemodynamic definitions and updated clinical classification of pulmonary hypertension. Eur. Respir. J. 2019;53 doi: 10.1183/13993003.01913-2018. - DOI - PMC - PubMed
    1. Schermuly R.T., Ghofrani H.A., Wilkins M.R., Grimminger F. Mechanisms of disease: pulmonary arterial hypertension. Nat. Rev. Cardiol. 2011;8:443–455. doi: 10.1038/nrcardio.2011.87. - DOI - PMC - PubMed
    1. Hoeper M.M., Badesch D.B., Ghofrani H.A., Gibbs J.S.R., Gomberg-Maitland M., McLaughlin V.V., Preston I.R., Souza R., Waxman A.B., Grünig E., et al. Phase 3 Trial of Sotatercept for Treatment of Pulmonary Arterial Hypertension. N. Engl. J. Med. 2023;388:1478–1490. doi: 10.1056/NEJMoa2213558. - DOI - PubMed
    1. Lajoie A.C., Lauzière G., Lega J.C., Lacasse Y., Martin S., Simard S., Bonnet S., Provencher S. Combination therapy versus monotherapy for pulmonary arterial hypertension: a meta-analysis. Lancet Respir. Med. 2016;4:291–305. doi: 10.1016/s2213-2600(16)00027-8. - DOI - PubMed
    1. Pullamsetti S.S., Savai R., Seeger W., Goncharova E.A. Translational Advances in the Field of Pulmonary Hypertension. From Cancer Biology to New Pulmonary Arterial Hypertension Therapeutics. Targeting Cell Growth and Proliferation Signaling Hubs. Am. J. Respir. Crit. Care Med. 2017;195:425–437. doi: 10.1164/rccm.201606-1226PP. - DOI - PMC - PubMed

MeSH terms

Substances