. 2025 Feb 11;13(2):e009574.
doi: 10.1136/jitc-2024-009574.

Pooled screening for CAR function identifies novel IL-13Rα2-targeted CARs for treatment of glioblastoma

Affiliations

Pooled screening for CAR function identifies novel IL-13Rα2-targeted CARs for treatment of glioblastoma

Khloe S Gordon et al. J Immunother Cancer. .

Abstract

Background: Chimeric antigen receptor (CAR) therapies have demonstrated potent efficacy in treating B-cell malignancies, but have yet to meaningfully translate to solid tumors. Nonetheless, they are of particular interest for the treatment of glioblastoma, which is an aggressive form of brain cancer with few effective therapeutic options, due to their ability to cross the highly selective blood-brain barrier.

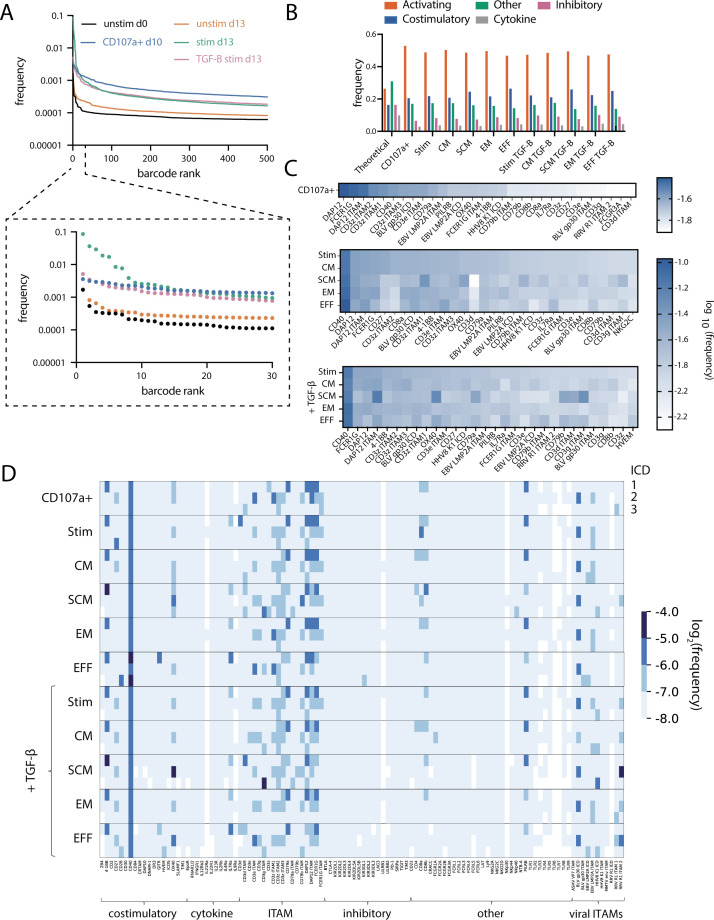
Methods: Here, we use our pooled screening platform, CARPOOL, to expedite the discovery of CARs with antitumor functions necessary for solid tumor efficacy. We performed selections in primary human T cells expressing a library of 1.3×10⁶ third generation CARs targeting IL-13Rα2, a cancer testis antigen commonly expressed in glioblastoma. Selections were performed for cytotoxicity, proliferation, memory formation, and persistence on repeated antigen challenge.

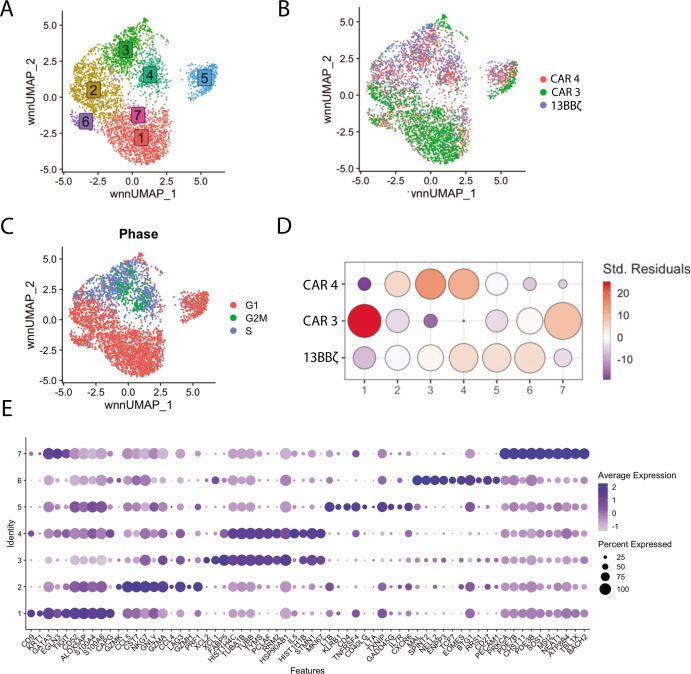
Results: Each enriched CAR robustly produced the phenotype for which it was selected, and one enriched CAR triggered potent cytotoxicity and long-term proliferation on in vitro tumor rechallenge. It also showed significantly improved persistence and comparable tumor control in a microphysiological human in vitro model and a xenograft model of human glioblastoma, but also demonstrated increased off-target recognition of IL-13Rα1.

Conclusion: Taken together, this work demonstrates the utility of extending CARPOOL to diseases beyond hematological malignancies and represents the largest exploration of signaling combinations in human primary cells to date.

Keywords: Chimeric antigen receptor - CAR; T cell.


Conflict of interest statement

Competing interests: The library approach described in this paper is the subject of a US patent application (PCT/US2020/017794) with MB as an inventor. AP is a member of the scientific advisory board and equity holder of AIM Biotech. MB is a founder, consultant, and equity holder of Kelonia Therapeutics and Abata Therapeutics. KSG is currently employed at Ginkgo Bioworks. The other authors declare no competing interests.

Figures

Figure 1
Figure 1. CARPOOL screening strategy. (A) Construct design for 1.3×10⁶-member library of IL-13Rα2 targeted third generation CARs. (B) Rechallenge and sorting timeline for CAR enrichment. CARs were stimulated at each time point with growth-arrested IL-13Rα2+ Jurkat T cells at a 1:1 effector to target ratio in 30 IU/mL IL-2 with or without 5 ng/mL TGF-β supplementation. Active CARs were sorted by collecting EGFP+ 4-1BB+ CAR-T cells, gated relative to unstimulated controls. Cytotoxic CARs were collected by sorting the top 5% of CD107a-expressing cells by MFI 6 hours after stimulation on day 4. Memory populations were sorted from the stimulated CAR library on day 13 via CD62L and CD45RA expression. FACS plots are shown for sorted CD4+ library populations, with and without antigen stimulation. Data shown for donor 1. CAR, chimeric antigen receptor; EGFP, enhanced green fluorescent protein; FACS, Fluorescence-activated cell sorting; ICD, intracellular domain; IL, interleukin; ITAMs, immunoreceptor tyrosine-based activating motifs; MFI, mean fluorescence intensity; TGF-β, transforming growth factor beta.
Figure 2
Figure 2. Sequencing analysis of enriched CD4+ library barcodes and signaling domains. (A) Barcode enrichment for unselected and selected populations, with barcode frequency on the y-axis and barcode rank (by frequency) on the x-axis. (B) Frequency of each family of signaling domain throughout different selected populations. (C) Heat maps showing bulk log10 frequencies of ICDs (irrespective of position) for CD107a sorted CARs and rechallenged CARs, with or without TGF-β. (D) Log2 frequencies of ICDs at each intracellular position relative to the transmembrane domain for selected populations. Data shown for donor 1. Barcode and ICD enrichment data can be found in online supplemental files 1 and 2. CAR, chimeric antigen receptor; CM, central memory; EFF, effector; EM, effector memory; ICD, intracellular domain; ITAM, immunoreceptor tyrosine-based activating motif; SCM, stem cell like memory; TGF-β, transforming growth factor beta.
Figure 3
Figure 3. Enriched CARs show antitumor functions in response to glioblastoma in vitro. (A) Composition of enriched CARs selected for characterization, along with the populations in which they were enriched. (B–C) Dose response curves following 24-hour co-culture of human primary CD4+ T cells with IL-13Rα2+ U87 cells at varying E:T ratios (n=3 technical replicates). Resulting (B) CD69 and 4-1BB upregulation in CD4+ T cells and (C) tumor cell killing in CD4+ and CD8+ T cells were measured after 24 hours. Data shown in (B,C) depicts means±SEM (n=3 technical replicates). P values were determined using two-way analysis of variance with Dunnett’s multiple comparisons test. For CD69 expression, p values were 0.0384 and <0.0001 for CAR 4 versus 13BB𝜁 at E:T ratios of 1:5 and 1:10 (n=3, df=60). For 4-1BB expression, both p values were <0.0001 for CAR 4 versus 13BB𝜁 at E:T ratios 1:5 and 1:10, respectively (n=3 technical replicates, df=59). Data in (B) is representative of two biological replicates, while data in (C) is representative of three biological replicates. CAR, chimeric antigen receptor; E:T, effector to target; ICD, intracellular domain; IL, interleukin; MFI, mean fluorescence intensity; TGF-β, transforming growth factor beta.
Figure 4
Figure 4. Selected CARs persist and proliferate in response to tumor rechallenge. (A) CAR fold-change following rechallenge with IL-13Rα2+ U87 cells at a 1:1 effector to target ratio on days 0, 4, 8, and 12. (B) Memory and (C) exhaustion phenotypes on day 14 of rechallenge. Data for (A–C) shows means±SEM (n=3 technical replicates). The p values in (A) were determined using two-way ANOVA with Dunnett’s multiple comparisons test and are 0.0129, 0.0153, and 0.0141 for CAR 4 versus 13BBζ on days 8, 12, and 14 (n=3, df=2). P values in (C) were determined using one-way ANOVA with Dunnett’s multiple comparisons test. In (C), the p values for PD-1 expression are 0.0024 for CAR 1 versus 13BBζ, 0.0015 for CAR 2 versus 13BBζ, 0.0004 for CAR 4 versus 13BBζ, and 0.0038 for CAR 5 versus 13BBζ. The p values for LAG-3 expression are 0.0466 for CAR 2 versus 13BBζ and 0.0002 for CAR 4 versus 13BBζ (n=3 technical replicates, df=12). Data is representative of two biological replicates. ANOVA, analysis of variance; CAR, chimeric antigen receptor; CM, central memory; EFF, effector; EM, effector memory; LAG-3, lymphocyte activation gene 3; MFI, mean fluorescence intensity; PD-1, programmed cell death protein 1; SCM, stem cell like memory; TIM3, T-cell immunoglobulin and mucin domain 3.
Figure 5
Figure 5. CAR 4 produces a cytotoxic gene signature that is associated with expansion within patient with glioma samples. (A) UMAP embeddings of merged scRNA-seq profiles colored by cell state, (B) CAR identity, and (C) proliferative state following rechallenge of human primary CD3+ CAR-T cells with IL-13Rα2+ U87 cells four times at an effector to target ratio of 1:1 (n=1,471, 1,471, and 1,194 cells for CARs 3, 4, and 13BBζ, respectively). (D) Χ2 enrichment values for each CAR candidate within each cluster, represented by the Pearson residuals measuring the difference between the observed and expected CAR frequencies within each cluster. (E) Average expression of top 10 differentially expressed genes by cluster. CAR, chimeric antigen receptor; scRNA-seq, single-cell RNA sequencing; UMAP, uniform manifold approximation and projection .
Figure 6
Figure 6. CAR 4 controls IL-13Rα2+ U87 cells and exhibits increased persistence in vitro. (A) Representative image of IL-13Rα2+ U87-RFP tumor spheroids (magenta) in microdevices at day 3 and day 9 after CAR-T (cyan) addition. (B) Illustration of radial plot analysis carried out in (C) and (D). (C) Increase in U87 cell signal intensity at day 9 relative to day 0. (D) CAR-T signal at day 9. Data shown in (C,D) are means±SEM. (E) Illustration of regions inside and outside the microtumors. (F) CAR-T cell counts inside and outside the microtumors. (G) Activation, (H) exhaustion and (I) memory phenotypes of CAR-T cells retrieved from inside and outside the microtumors. P values in (C) were determined by comparing the area under the curve with one-way analysis of variance with Tukey’s multiple comparisons test and are <0.0001 (n=5 for untreated, 13BB𝜁 and CAR 4, df=12). P value in (D) were determined by comparing the area under the curve with two-way unpaired t-test and are <0.0001 (n=5 for 13BB𝜁 and CAR 4, df=4). Data in (F–I) are pooled from three technical replicates. CAR, chimeric antigen receptor; CM, central memory; EFF, effector; EM, effector memory; IFN, interferon; LAG-3, lymphocyte activation gene 3; MFI, mean fluorescence intensity; PD-1, programmed cell death protein 1; SCM, stem cell like memory; TIM3, T-cell immunoglobulin and mucin domain 3.
Figure 7
Figure 7. CAR 4 controls IL-13Rα2+ U87 cells in vivo. (A) Experimental timeline. (B) Tumor flux of Flag+ IL-13Rα2+ FLuc+ U87 cells implanted subcutaneously in NSG mice. Data shown are for individual mice (n=6 for mock, CAR 4, and 13BB𝜁). (C) CD4+ and CD8+ CAR abundance in the spleen and (D) tumor. (E) Antigen-positive tumor cell abundances. Data shown in (C–E) are means±SEM The p values in (B) were determined using two-way ANOVA with Dunnett’s multiple comparisons test and are 0.0272, 0.0453, and <0.0001 for CAR 4 versus 13BB𝜁 on days 15, 17, and 20, respectively (n=6 mice each, df=180). P values in (C) and (D) were also determined by two-way ANOVA and are <0.0001 and 0.0003 for CD4+ CAR 4 versus 13BB𝜁 in the spleen and tumor, respectively (n=6 each, df=36). The p value in (E) is 0.0039 for CAR 4 versus 13BB𝜁 (n=6 each, df=5) as determined by an unpaired t-test. Data is representative of three biological replicates from donor 3. ACT, Adoptive cell therapy; ANOVA, analysis of variance; CAR, chimeric antigen receptor; FLuc, firefly luciferase; NSG, NOD/SCID/IL-­ 2Rnull; s.c., subcutaneous.

Update of

References

    1. Lim M, Xia Y, Bettegowda C, et al. Current state of immunotherapy for glioblastoma. Nat Rev Clin Oncol. 2018;15:422–42. doi: 10.1038/s41571-018-0003-5. - DOI - PubMed
    1. Abbott NJ, Rönnbäck L, Hansson E. Astrocyte-endothelial interactions at the blood-brain barrier. Nat Rev Neurosci. 2006;7:41–53. doi: 10.1038/nrn1824. - DOI - PubMed
    1. Terstappen GC, Meyer AH, Bell RD, et al. Strategies for delivering therapeutics across the blood-brain barrier. Nat Rev Drug Discov. 2021;20:362–83. doi: 10.1038/s41573-021-00139-y. - DOI - PubMed
    1. Nance E, Pun SH, Saigal R, et al. Drug delivery to the central nervous system. Nat Rev Mater. 2022;7:314–31. doi: 10.1038/s41578-021-00394-w. - DOI - PMC - PubMed
    1. Galea I, Bernardes-Silva M, Forse PA, et al. An antigen-specific pathway for CD8 T cells across the blood-brain barrier. J Exp Med. 2007;204:2023–30. doi: 10.1084/jem.20070064. - DOI - PMC - PubMed

MeSH terms

Substances

LinkOut - more resources