. 2025 Feb 11;16(1):1540.
doi: 10.1038/s41467-024-52223-7.

The spatiotemporal transcriptional profiling of murine brain during cerebral malaria progression and after artemisinin treatment

Affiliations

The spatiotemporal transcriptional profiling of murine brain during cerebral malaria progression and after artemisinin treatment

Jiayun Chen et al. Nat Commun. .

Abstract

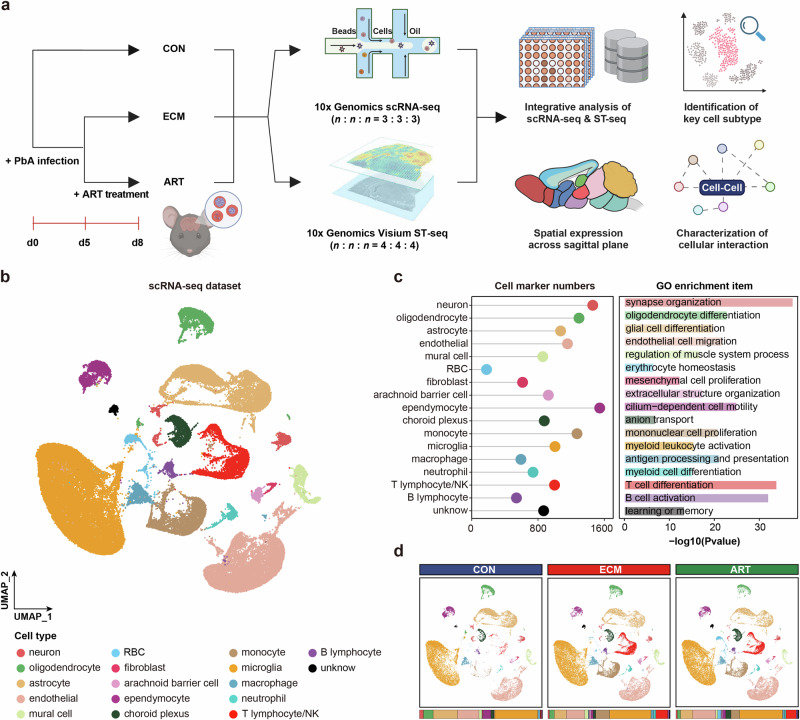
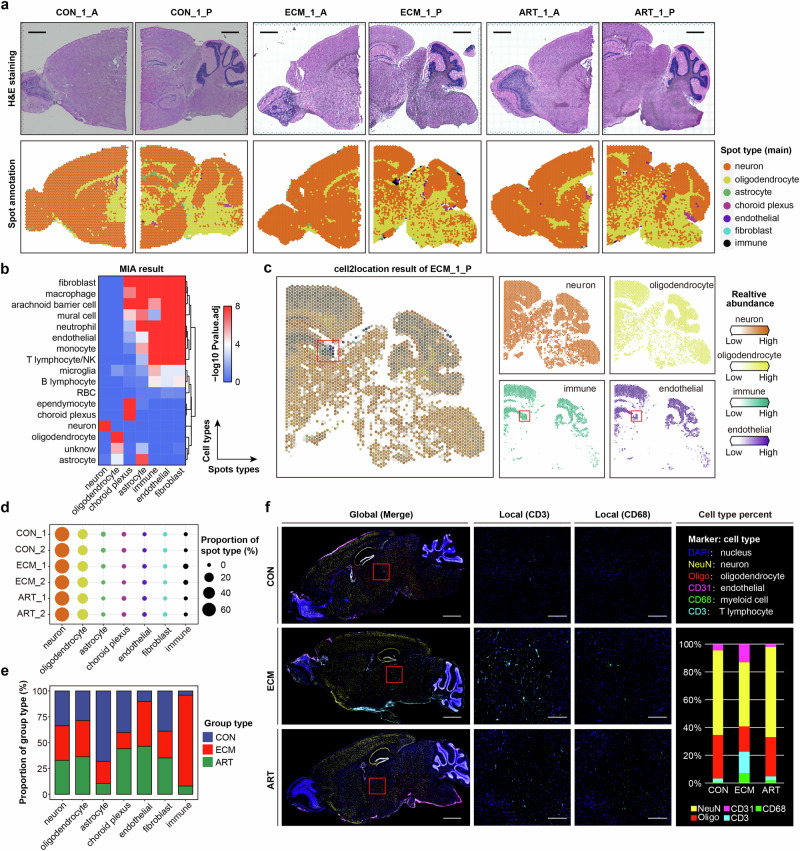
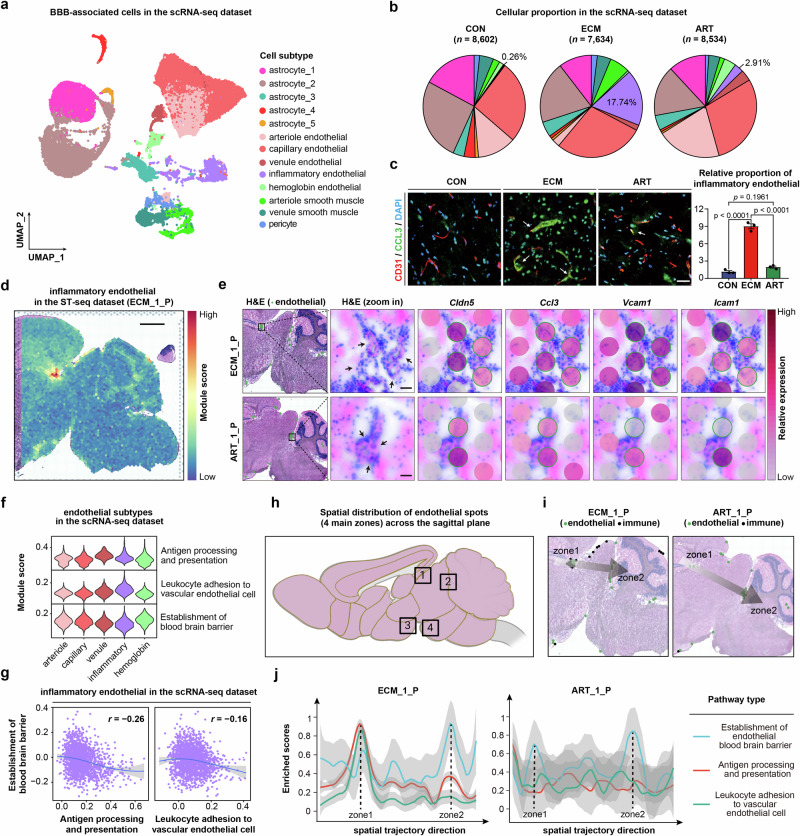
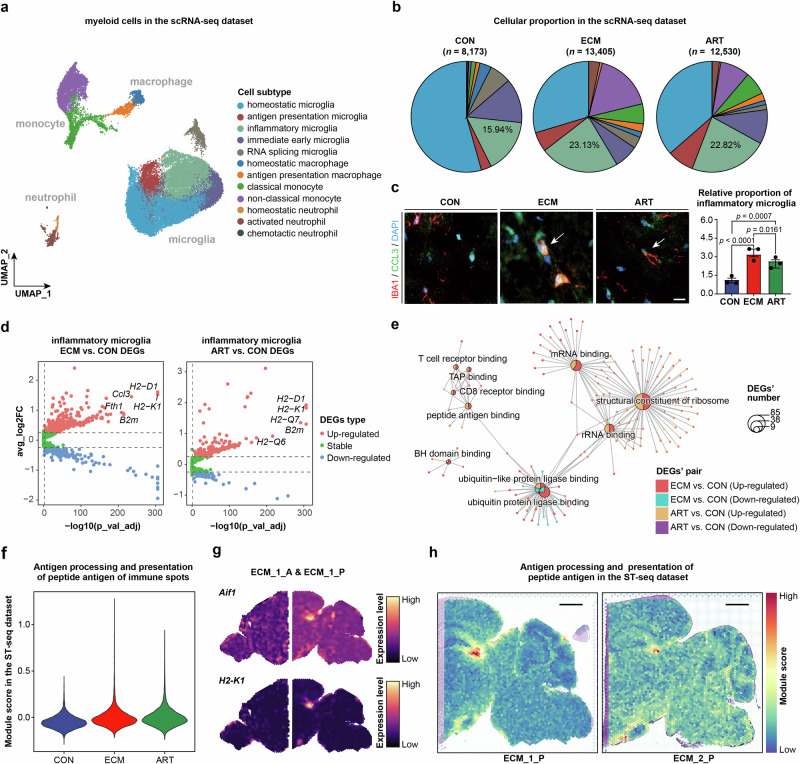
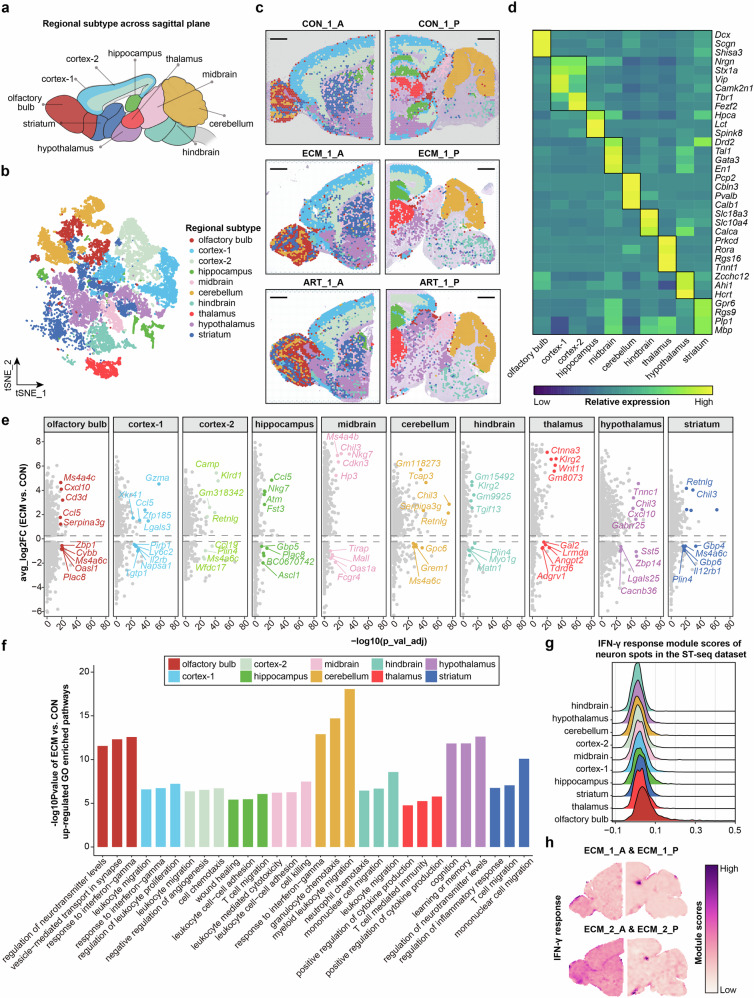
Cerebral malaria (CM) is a severe encephalopathy caused by Plasmodium parasite infection, resulting in thousands of annual deaths and neuro-cognitive sequelae even after anti-malarial drugs treatment. Despite efforts to dissect the mechanism, the cellular transcriptomic reprogramming within the spatial context remains elusive. Here, we constructed single-cell and spatial transcriptome atlases of experimental CM (ECM) male murine brain tissues with or without artesunate (ART) treatment. We identified activated inflammatory endothelial cells during ECM, characterized by a disrupted blood-brain barrier, increased antigen presentation, and leukocyte adhesion. We also observed that inflammatory microglia enhance antigen presentation pathway such as MHC-I to CD8+ cytotoxic T cells. The latter underwent an inflammatory state transition with up-regulated cytokine expression and cytotoxic activity. Multi-omics analysis revealed that the activated interferon-gamma response of injured neurons during ECM and persisted after ART treatment. Overall, our research provides valuable resources for understanding malaria parasite-host interaction mechanisms and adjuvant therapy development.


Conflict of interest statement

Competing interests: The authors declare no competing interests.

Figures

Fig. 1
Fig. 1. Profiling the single-cell transcriptomics of murine ECM brain.
a Scheme depicts the experimental process and analytical workflow of murine brain tissues from CON, ECM and ART groups on d8 via integrating scRNA-seq and ST-seq technologies (created with BioRender.com). b UMAP visualization shows 17 cell types of 77,296 single cells in the scRNA-seq dataset, colored by cell types. c Lollipop chart depicts the numbers of cell markers (left panel), and bar plot indicates the cellular-specific enriched biological pathway of each cell type (right panel), colored by cell types. Adjusted p-value (adj_p_val) of DEGs were calculated by Wilcoxon rank-sum test, and the GO enriched terms were chosen with adjusted p-value (corrected using the Benjamini-Hochberg procedure) < 0.05. d UMAP plots (top panel) show the annotated cell types in CON (left panel, n = 21,684), ECM (middle panel, n = 27,443) and ART groups (right panel, n = 28,169). Bar plots (bottom panel) show the relative cellular proportions in each group, colored by cell types. Source data are provided as a Source Data file. a Created with BioRender.com released under a Creative Commons Attribution-NonCommercial-NoDerivs 4.0 International license. CON control, ECM experimental cerebral malaria, ART artesunate treatment, d days, UMAP uniform manifold approximation and projection, GO Gene Ontology.
Fig. 2
Fig. 2. The spatial transcriptomic landscape of ECM murine brain tissues.
a The H&E staining (top panel) and the corresponding spatial annotation (bottom panel) of CON_1, ECM_1, and ART_1 samples (each sample contained A and P slides, n = 2 biologically independent samples per group), colored by spot types, scale bar = 1 mm. b The heatmap indicates the correlation significance between cell types in the scRNA-seq and spot types in the ST-seq dataset using MIA method. c The visualization indicates the estimated cell abundances (color intensity) of key cell types (neuron, oligodendrocyte, endothelial, and immune) in ECM_1_P slide using cell2location method. d The bubble plot shows the relative proportion of the main spot types across 6 samples, colored by spot types. e The bar plot shows the relative proportions of different groups of each main spot type, colored by group types. f Six-plex mIHC staining panels show the cellular components and spatial distribution of the sagittal planes (left panel, scale bar = 1 mm), CD3 and CD68 markers (middle panel, scale bar = 100 μm), and cellular proportions (right panel) among 3 groups, colored by cell types. Source data are provided as a Source Data file. H&E hematoxylin and eosin; MIA multimodal intersection analysis; P value.adj adjusted p-alue; mIHC multiplex immunohistochemistry.
Fig. 3
Fig. 3. Identification of activated inflammatory endothelial cells with BBB injury.
a UMAP visualization shows 13 subtypes based on 24,770 BBB-associated cells in the scRNA-seq dataset, colored by cellular subtypes. b Pie charts depict the relative proportion of cellular subtypes among three groups, colored by cellular subtypes shown in the Fig. 3a. Source data are provided as a Source Data file. c IF staining of inflammatory endothelial markers (left panel, CD31, red; CCL3, green; DAPI, blue) and the statistical analysis (right panel) among three groups (n = 3 biologically independent samples per group), scale bar = 25 μm. Values are summarized as mean ± SEM and analyzed using a Tukey’s multiple comparisons test. Source data are provided as a Source Data file. d Spatial distribution of inflammatory endothelial subtype’s module score in the ECM_1_P slide of the ST-seq dataset, scale bar = 1 mm. e The slides highlight the spatial distribution of endothelial spots (column1, colored by green), the zoom in H&E staining panels show the tubular structure of the blood vessels (column2, indicated by arrows), and dotplots show the spatial expression level of Cldn5, Ccl3, Vcam1, and Icam1 (column3-6) of endothelial spots (outline colored by green) from ECM_1_P (top panel) and ART_1_P (bottom panel) in the ST-seq dataset, respectively. n = 2 biologically independent samples per group. f Violin plots show the module scores of antigen processing and presentation, leukocyte adhesion to vascular endothelial cell, and establishment of blood brain barrier among 5 endothelial subtypes in the scRNA-seq dataset, colored by endothelial subtypes. g The scatter plots show the module scores’ correlation coefficient (Pearson’s r) between establishment of blood brain barrier and antigen processing and presentation (left panel), and leukocyte adhesion to vascular endothelial cell (right panel) of inflammatory endothelial subtype in the scRNA-seq dataset, respectively. h The schematic diagram indicates the main distributed location (zone1-4) of endothelial spots in the ST-seq dataset (created with BioRender.com). i The direction arrows indicate the spatial trajectory from zone1 to zone2 in the ECM_1_P and ART_1_P slides, respectively. j The line charts indicate the geneset scores along the trajectory from zone1 to zone2 in ECM_1_P (left panel) and ART_1_P (right panel) slides, colored by pathway items. The trajectory direction agrees with the direction in (i).  h Created with BioRender.com released under a Creative Commons Attribution-NonCommercial-NoDerivs 4.0 International license. BBB blood-brain barrier, IF Immunofluorescence.
Fig. 4
Fig. 4. Enhanced antigen presentation activity of inflammatory microglia subtype.
a UMAP visualization shows 12 subtypes of 34,108 myeloid cells in the scRNA-seq dataset, colored by cellular subtypes. b Pie charts depict the relative proportion of myeloid subtypes among three groups, colored by cellular subtypes shown in the Fig. 4a. Source data are provided as a Source Data file. c IF staining of inflammatory microglia markers (IBA1, red; CCL3, green; DAPI, blue) among three groups (n = 3 biologically independent samples per group), scale bar = 10 μm. Values are summarized as mean ± SEM and analyzed using a Tukey’s multiple comparisons test. Source data are provided as a Source Data file. d Volcano plots show the DEGs patterns of ECM vs. CON groups and ART vs. CON groups in inflammatory microglia subtype, labeled by top 5 up-regulated DEGs. adj_p_val of DEGs were calculated by Wilcoxon rank-sum test. e Centplot shows the enriched biological processes pathways of up- and down-regulated DEGs of ECM vs. CON as well as ART vs. CON groups, colored by DEGs’ pairs, sized by the enriched DEGs’ numbers. The GO enriched terms were chosen with adjusted p-value (corrected using the Benjamini-Hochberg procedure) < 0.05. f Violin plot shows the module scores of antigen processing and presentation of peptide antigen of immune spots in the ST-seq dataset, colored by group types. g Spatial expression of Aif1 (top panel) and H2-K1 (bottom panel) of the ECM_1_A and ECM_1_P slides in the ST-seq dataset. h Spatial featureplots show the distribution of module scores of antigen processing and presentation of peptide antigen in ECM_1_P and ECM_2_P slides in the ST-seq dataset, scale bar = 1 mm. DEGs differentially expressed genes; ECM vs. CON ECM versus CON groups; ART vs. CON ART versus CON groups.
Fig. 5
Fig. 5. Characterizing the activated CD8+ cytotoxic T cells in mice with ECM.
a UMAP visualization shows 9 subtypes based on 5,088 lymphocytes in the scRNA-seq dataset, colored by cellular subtypes. b Heatmap shows the expression of cluster-specific markers among lymphocyte subtypes. c Pie charts depict the relative proportion of lymphocyte subtypes among three groups, colored by cellular subtypes shown in the Fig. 5a. Source data are provided as a Source Data file. d IF staining of CD8+ cytotoxic T markers (CD8, red; KLRD1, green; DAPI, blue) among three groups (n = 3 biologically independent samples per group), scale bar = 25 μm. Values are summarized as mean ± SEM and analyzed using a Tukey’s multiple comparisons test. Source data are provided as a Source Data file. e Pseudotemporal inference suggests trajectory path of CD8+ cytotoxic T subtype based on the pseudotime (top panel) and group types (bottom panel), respectively. f Pseudotemporal expression pattern analysis shows the representative DEGs in 3 clusters, along with the inferred trajectory and enriched biological processes terms, colored by cluster types. adj_p_val of DEGs were calculated by Wilcoxon rank-sum test, and the GO enriched terms were chosen with adjusted p-value (corrected using the Benjamini-Hochberg procedure) < 0.05. g Relative expression levels of p-Stat3/Stat3 and Gzmk proteins among three groups (n = 3 biologically independent samples per group). Values are summarized as mean ± SEM and analyzed using a Tukey’s multiple comparisons test. Source data are provided as a Source Data file. h Spatial distribution of T cell migration, and T cell mediated cytotoxicity’s module scores of the ECM_1 (left panel) and ART_1 (right panel) slides in the ST-seq dataset.
Fig. 6
Fig. 6. Integrative analysis revealed consistent cell-cell crosstalk in ECM brain.
a Heatmaps show the differential interaction numbers between ECM vs. CON as well as ART vs. CON groups in the scRNA-seq dataset. b Heatmaps show the differential interaction numbers between ECM vs. CON as well as ART vs. CON groups in the ST-seq dataset. c Venn diagram shows the overlapping pathways of ECM vs. CON and ART vs. CON groups among the scRNA-seq and ST-seq datasets. d The representative IHC stainings of MHC-I in brain tissues among three groups (n = 3 biologically independent samples per group), scale bar = 20 μm. Values are summarized as mean ± SEM and analyzed using a Tukey’s multiple comparisons test. Source data are provided as a Source Data file. e Bubble plot indicates the significant MHC-I relevant ligand-receptor pairs among various sender-receiver cell types among 3 groups of scRNA-seq dataset. f The ligand and receptor signal scores of H2-K1 − Cd8a pair in the ECM_1_P, ECM_2_P, and ART_2_P slides, scale bar = 1 mm. g The visualization indicates the estimated cell abundances (color intensity) of key cell subtypes (inflammatory endothelial, inflammatory microglia, and CD8+ cytotoxic T subtypes) in special region of ECM_1_P slide using cell2location method. h IF staining shows the co-location of CD8+ T cell, microglia, and vascular endothelial cells (DAPI, blue; CD31, pink; CD8a, green; IBA1, red) among three groups, the interactions were highlight in yellow arrow, scale bar = 20 μm.
Fig. 7
Fig. 7. Unremitting interferon responses in neurons during ECM and after ART treatment.
a Schematic representation of various regional types in the sagittal plane of the murine brain (created with BioRender.com). b t-SNE visualization shows 10 regional subtypes of 26,762 neuron spots, colored by regional subtypes shown in Fig. 7a. c Neuron spots overlay of different region in CON (top panel, CON_1), ECM (middle panel, ECM_1) and ART (bottom panel, ART_1) groups, colored by regional subtypes, scale bar = 1 mm. d Heatmap shows expression of regional-specific markers of neuron spots across various regional subtypes. e Volcano plots show the DEGs of ECM vs. CON in each neuron region. The representative up-regulated and down-regulated genes were labeled. adj_p_val of DEGs were calculated by Wilcoxon rank-sum test. f Bar plots indicate up-regulated biological processes of ECM vs. CON in neuron spots across different regions, colored by regional subtypes. The GO enriched terms were chosen with adjusted p-value (corrected using the Benjamini-Hochberg procedure) < 0.05. g The module scores of IFN-γ response in neuron spots across various region of the ECM group in the ST-seq dataset, colored by regional types. h The spatial module scores of IFN-γ response in ECM_1 (top panel) and ECM_2 (bottom panel) slides, respectively. a Created with BioRender.com released under a Creative Commons Attribution-NonCommercial-NoDerivs 4.0 International license. t-SNE t-Distributed Stochastic Neighbor Embedding.

References

    1. Ashley, E. A. et al. Malaria. Lancet391, 1608–1621 (2018). - PubMed
    1. Glennon, E. K. K. et al. Opportunities for host-targeted therapies for malaria. Trends Parasitol.34, 843–860 (2018). - PMC - PubMed
    1. Ghazanfari, N. et al. Cerebral malaria in mouse and man. Front Immunol.9, 2016 (2018). - PMC - PubMed
    1. Coban, C. et al. Tissue-specific immunopathology during malaria infection. Nat. Rev. Immunol.18, 266–278 (2018). - PMC - PubMed
    1. Miller, L. H. et al. The pathogenic basis of malaria. Nature415, 673–679 (2002). - PubMed

MeSH terms

LinkOut - more resources