

SIBES: Long-term and large-scale monitoring of intertidal macrozoobenthos and sediment in the Dutch Wadden Sea
- PMID: 39934128
- PMCID: PMC11814293
- DOI: 10.1038/s41597-025-04540-9
SIBES: Long-term and large-scale monitoring of intertidal macrozoobenthos and sediment in the Dutch Wadden Sea
Abstract
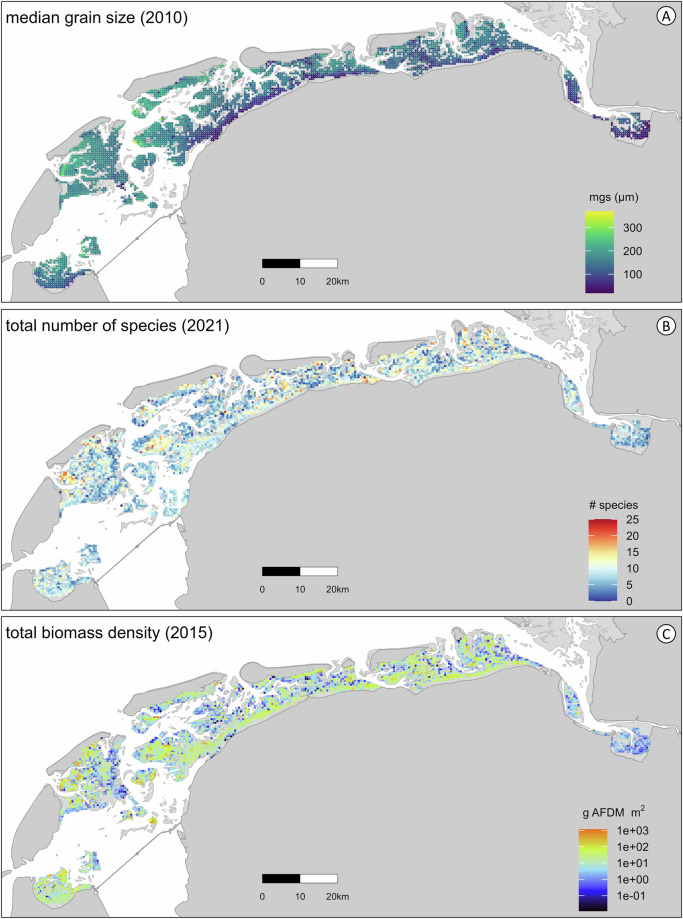
The Wadden Sea is the world's largest intertidal area and a UNESCO World Heritage Site. Macrozoobenthic invertebrates perform key ecological functions within intertidal areas by regulating nutrient cycles, decomposing organic matter, and providing food for fish, birds and humans. To understand ecological processes and human impacts on biodiversity, the Synoptic Intertidal BEnthic Survey (SIBES) has sampled intertidal macrozoobenthos since 2008. On average 4,109 stations across 1,200 km² of Dutch Wadden Sea mudflats are sampled from June to October to quantify the benthic invertebrate community and sediment composition, including species abundance and biomass, and grain size and mud content. The dataset published now contains 51,851 sampled stations with 3,034,760 individuals of 177 species. This paper details data collection, validation and processing methods. SIBES is ongoing and data will be updated yearly. In sharing these data, we hope to enhance collaborations and understanding of the impact of various pressures on macrozoobenthic invertebrates, sediment composition, food webs, the ecosystem, and biodiversity in the Wadden Sea and other intertidal habitats.
© 2025. The Author(s).
Conflict of interest statement
Competing interests: The authors declare no competing interests.
Figures


Similar articles
-
Abundance, biomass and species richness of macrozoobenthos along an intertidal elevation gradient.Ecol Evol. 2023 Dec 14;13(12):e10815. doi: 10.1002/ece3.10815. eCollection 2023 Dec. Ecol Evol. 2023. PMID: 38107424 Free PMC article.
-
Effects of Zostera marina on the patterns of spatial distribution of sediments and macrozoobenthos in the boreal lagoon of Furen (Hokkaido, Japan).Mar Environ Res. 2017 Oct;131:90-102. doi: 10.1016/j.marenvres.2017.09.013. Epub 2017 Sep 20. Mar Environ Res. 2017. PMID: 28967507
-
Spatiotemporal variations in macrofaunal assemblages linked to site-specific environmental factors in two contrasting nearshore habitats.Environ Pollut. 2018 Oct;241:596-606. doi: 10.1016/j.envpol.2018.05.098. Epub 2018 Jun 7. Environ Pollut. 2018. PMID: 29886380
-
A review of subtidal benthic habitats and invertebrate biota of the Strait of Georgia, British Columbia.Mar Environ Res. 2008 Dec;66 Suppl:S3-38. doi: 10.1016/j.marenvres.2008.09.004. Epub 2008 Oct 10. Mar Environ Res. 2008. PMID: 19036427 Review.
-
Ecological variables for developing a global deep-ocean monitoring and conservation strategy.Nat Ecol Evol. 2020 Feb;4(2):181-192. doi: 10.1038/s41559-019-1091-z. Epub 2020 Feb 3. Nat Ecol Evol. 2020. PMID: 32015428 Review.
References
-
- Levin, L. A. et al. The function of marine critical transition zones and the importance of sediment biodiversity. Ecosyst. 4, 430–451, 10.1007/s10021-001-0021-4 (2001).
-
- Dissanayake, N. G., Frid, C. L. J., Drylie, T. P. & Caswell, B. A. Ecological functioning of mudflats: global analysis reveals both regional differences and widespread conservation of functioning. Mar. Ecol. Prog. Ser. 604, 1–20, 10.3354/meps12728 (2018).
-
- Lotze, H. K. et al. Human transformations of the Wadden Sea ecosystem through time: a synthesis. Helgol. Mar. Res.59, 84–95, 10.1007/s10152-004-0209-z (2005).
-
- Lotze, H. K. et al. Depletion, degradation, and recovery potential of estuaries and coastal seas. Science312, 1806–1809, 10.1126/science.1128035 (2006). - PubMed
-
- Murray, N. J. et al. The global distribution and trajectory of tidal flats. Nature565, 222–225, 10.1038/s41586-018-0805-8 (2019). - PubMed
Publication types
MeSH terms
LinkOut - more resources
Full Text Sources
