. 2025 Feb 11;16(1):1533.
doi: 10.1038/s41467-025-56853-3.

Human and mouse proteomics reveals the shared pathways in Alzheimer's disease and delayed protein turnover in the amyloidome

Affiliations

Human and mouse proteomics reveals the shared pathways in Alzheimer's disease and delayed protein turnover in the amyloidome

Jay M Yarbro et al. Nat Commun. .

Abstract

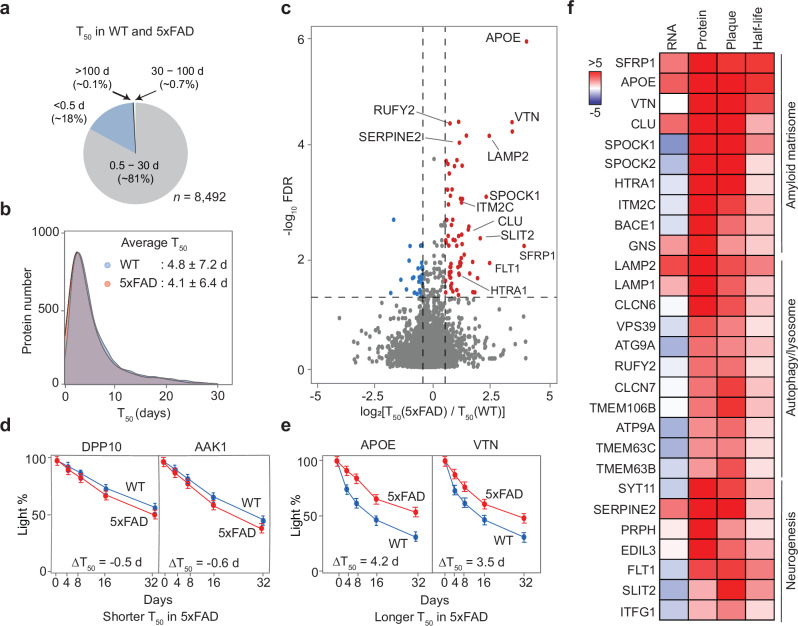
Murine models of Alzheimer's disease (AD) are crucial for elucidating disease mechanisms but have limitations in fully representing AD molecular complexities. Here we present the comprehensive, age-dependent brain proteome and phosphoproteome across multiple mouse models of amyloidosis. We identified shared pathways by integrating with human metadata and prioritized components by multi-omics analysis. Collectively, two commonly used models (5xFAD and APP-KI) replicate 30% of the human protein alterations; additional genetic incorporation of tau and splicing pathologies increases this similarity to 42%. We dissected the proteome-transcriptome inconsistency in AD and 5xFAD mouse brains, revealing that inconsistent proteins are enriched within amyloid plaque microenvironment (amyloidome). Our analysis of the 5xFAD proteome turnover demonstrates that amyloid formation delays the degradation of amyloidome components, including Aβ-binding proteins and autophagy/lysosomal proteins. Our proteomic strategy defines shared AD pathways, identifies potential targets, and underscores that protein turnover contributes to proteome-transcriptome discrepancies during AD progression.


Conflict of interest statement

Competing interests: The authors declare no competing interests.

Figures

Fig. 1
Fig. 1. Brain MS analysis reveals proteomic changes that are shared in AD mouse models.
a Schematic plan of this study. Mouse cortical tissues from AD models of amyloidosis (5xFAD, NLF, NLGF, and matched WT, total n = 66 for 16 conditions, averaged n = ~4 per condition) were analyzed by TMT-LC/LC-MS/MS and compared with human metadata. b Proteins quantified at different ages (3-18 months). c Aβ levels quantified by MS using the peptide HDSGYEVHHQK (Average value ± SD, n = 2, 5, 6, 2, 2, 2, 3, 2, 3, for each group, left to right). The values were averaged for each age and model, then normalized to 12-month-old 5xFAD (100%). d DEPs between AD mice and WT controls at increasing ages, defined by moderated t-test with statistical cutoffs (FDR < 0.05, |log2FC | > 2 SD). e Representative volcano plot for NLGF-WT comparison (moderated t-test). Individual proteins correspond to data points and are color coded red or blue if up- or down-regulated as defined by statistical cutoffs, respectively (FDR < 0.05, |log2FC | > 2 SD, dashed lines). f Heatmap of DEPs identified in AD mice at any age or genotype, including the proteins enriched in 5xFAD or NLGF and those shared by both mice. g Pathway analysis of shared DEPs in 5xFAD and NLGF. FDR was derived from p values (Fisher’s exact test) by the Benjamini-Hochberg procedure. h, Enriched PPI modules from biological processes using the shared DEPs. Brain images created in BioRender. Yarbro, J. (2025) https://BioRender.com/a05v379.
Fig. 2
Fig. 2. Tissue phosphoproteomics defines a new layer of regulation beyond whole proteome.
a Phosphoproteome profiling was performed across 36 5xFAD and NLGF mice and their age-matched controls. We quantified 12,096 phosphopeptides (peptide FDR < 0.01) shared in all mice and performed statistical comparisons by moderated t-test. 122 DE phosphopeptides (80 proteins) were identified (FDR < 0.05, |log2FC | > 2 SD). b Distribution of phospho-Ser/Thr/Tyr in identified phosphosites. c Volcano plot of phosphoproteome data for 12-month-old 5xFAD compared to WT. Dashed lines indicate cutoffs. d Volcano plot of phosphoproteome data for 12-month-old NLGF compared to WT. e Heatmap of DE phosphoproteins in 5xFAD and NLGF mice, with protein subcellular location shown. f PPI modules of DE phosphoproteins. g The overlap of DEPs in phosphoproteomics and whole proteome analysis. Only consistent DEPs in both AD models were counted. h Bioinformatics method for identifying altered kinase activities. Kinase-substrate linkages were extracted to infer kinase activities by the KSEA algorithm. An example of MAPK activation is based on KSEA. Phosphopeptide levels are displayed using the accompanying gradients. i Heatmap of derived kinase activities. The fold change of 5xFAD and NLGF was calculated by comparison with WT.
Fig. 3
Fig. 3. Comparison of mouse proteomics to human metadata identifies shared proteomic changes.
a We identified 866 proteins that are consistently altered in more than 30 human AD proteomics studies, 654 of which were quantified in the proteomic analysis of the AD mice. Of these, 196 (30%) are differentially expressed in at least one mouse model (FDR < 0.05, |log2FC | > 2 SD). b Number of overlapping DEPs between human AD and different mouse models. c DEPs shared by human AD, 5xFAD, and NLGF mice. d Scatter plot comparisons between Z scores of log2fold change values (log2FC-Z) of human AD/control cases and mouse models/WT at 12-month ages. Each dot represents one protein, and the color shows the dot density. Pearson correlation (R) values and associated p values are shown. e Heatmap showing log2FC values of human-mouse shared AD proteins, classified by biological pathways (moderated t-test, FDR < 0.05). f Workflow for deriving pathway activities. The FC of proteins in each pathway are integrated to calculate the pathway activity. g Heatmap of pathway activities in AD and mouse models.
Fig. 4
Fig. 4. Mouse models with additional pathologies beyond amyloidosis increase the similarity to AD.
a Proteomic profiling of two more mouse models that express additional AD pathologies: WT (n = 8) and 3xTG (Aβ and tau pathologies, n = 19), as well as WT (n = 4) and BiG (Aβ and U1 splicing pathologies, n = 4). All mice were ~6 months old. The proteomic data were subjected to DE analysis and comparison with human AD data. b, c Volcano plots of log2FC and FDR in 3xTG and BiG mice, compared to WT, with DEPs highlighted in colors and cutoffs indicated by dashed lines. d, e Selected protein-protein interactions of significantly altered DEPs found exclusively in individual mice, such as MAPT interactome in 3xTG, and splicing/synaptic interactome in BiG. f Numbers of DEPs in AD mouse models that were consistently altered in AD. The percentage was calculated using a denominator of 654 AD DEPs that were detectable by MS in mice. g Strategy for ranking individual proteins by multi-omics using order statistics. (i) All age-dependent proteomic data from 5xFAD and NLGF were initially consolidated into two datasets for the amyloidosis proteome and phosphoproteome. (ii) These datasets were then integrated with 10 additional datasets, which include the mouse transcriptome (5xFAD), 3xTG/BiG proteomes, human genetic data from GWAS, human transcriptomes, proteomes (MCI and two independent AD studies, n = 3), phosphoproteome, and interactome datasets. h Protein integrative rankings defined by combining 12 datasets. The entire datasets were ranked based on all identified genes/proteins. Subsequently, we extracted the rankings for the AD-mouse shared proteins (n = 275). The top 20 proteins are displayed, with missing values represented by white boxes.
Fig. 5
Fig. 5. AD and the mouse model show transcriptome-proteome inconsistencies which include RNA-independent upregulated proteins enriched in the amyloidome.
a Workflow for comparison of protein/RNA data to define protein-RNA consistencies. b, c Scatterplots of protein-RNA comparisons of log2FC-Z in human (n = 10,781) and 5xFAD mice (n = 8840). Density is indicated by color gradients. Pearson correlation (R) values are shown. d Percentage of protein-RNA consistency in the population of z-score altered proteins. e Overlap of RNA-independent protein changes between human and mouse. f Workflow of LCM-MS to compare proteomes in plaque and non-plaque regions, quantifying 5364 proteins. A Venn diagram illustrated the overlap of 31 shared, RNA-independent, upregulated proteins in both humans and mice with proteins enriched in either plaque or non-plaque regions. g Volcano plot showing proteins enriched in plaque or non-plaque regions.
Fig. 6
Fig. 6. The analysis of AD mouse proteome turnover confirms distinctly different turnover rates for human APP full-length protein and Aβ peptides.
a Whole proteome turnover analysis in 5xFAD and WT mice was performed using pulsed SILAC labeling (~9-month-old, 5 data points, 3 replicates, totaling 30 mice), TMT-LC/LC-MS/MS (2 batches), and the JUMPt program. The analysis covered a comprehensive set of 8492 unique proteins. b Diagram illustrating the 12 identified peptides in the human and mouse APP or Aβ regions. c PSM counts for the hAPP-specific peptide (peptide 2) and the hAβ surrogate peptide (peptide 10). Average PSM values are reported across 2 batches each, ±SD. d Apparent T50 values were directly determined from turnover curves for the hAPP- or hAβ-specific peptides (Average ± SD, n = 2). e The curve of free Lys amino acid (Average ± SD, n = 2). f Corrected T50 values were calculated based on the distance between the protein curve and free Lys curve, using the JUMPt program, which incorporates a mathematical model to account for delays caused by Lys recycling (Average ± SD, n = 2). g Summary table of hAPP and hAβ T50 values. The corrected T50 values were much smaller than the apparent T50 values.
Fig. 7
Fig. 7. The analysis of AD mouse proteome turnover reveals slow half-lives in amyloidome proteins.
a Pie chart displaying the average proportions of corrected protein T50 values categorized as very short (<0.5 days), intermediate (0.5–30 days), long (30–100 days), and very long (>100 days) for WT and 5xFAD mice. b Distribution graphs of T50 values in both genotypes, showing the average values and standard deviations. c Volcano plots of the log2 fold change and FDR for T50 in 5xFAD compared to WT, with proteins exhibiting changed T50 highlighted in colors and thresholds marked by dashed lines. d, e Examples of proteins that have shortened or extended T50 in 5xFAD (Average ± SD, n = 2 batches per genotype). f Heatmap illustrating how some proteins with longer T50 may be explained by their localization in plaques, contributing to RNA-protein discrepancies. The side bar indicates log2FC-Z values for the first three columns or log2FC values for the last column.

Update of

References

    1. Alzheimer’s_Association. 2024 Alzheimer’s disease facts and figures. Alzheimers Dement.20, 3708–3821 (2024). - PMC - PubMed
    1. Hyman, B. T. et al. National Institute on Aging-Alzheimer’s Association guidelines for the neuropathologic assessment of Alzheimer’s disease. Alzheimers Dement.8, 1–13 (2012). - PMC - PubMed
    1. Polanco, J. C. et al. Amyloid-beta and tau complexity - towards improved biomarkers and targeted therapies. Nat. Rev. Neurol.14, 22–39 (2018). - PubMed
    1. DeTure, M. A. & Dickson, D. W. The neuropathological diagnosis of Alzheimer’s disease. Mol. Neurodegener.14, 32 (2019). - PMC - PubMed
    1. Robinson, J. L. et al. The development and convergence of co-pathologies in Alzheimer’s disease. Brain144, 953–962 (2021). - PMC - PubMed

MeSH terms

LinkOut - more resources