. 2025 Feb 11;16(1):1543.
doi: 10.1038/s41467-025-56955-y.

BBOX1 restrains TBK1-mTORC1 oncogenic signaling in clear cell renal cell carcinoma

Affiliations

BBOX1 restrains TBK1-mTORC1 oncogenic signaling in clear cell renal cell carcinoma

Chengheng Liao et al. Nat Commun. .

Abstract

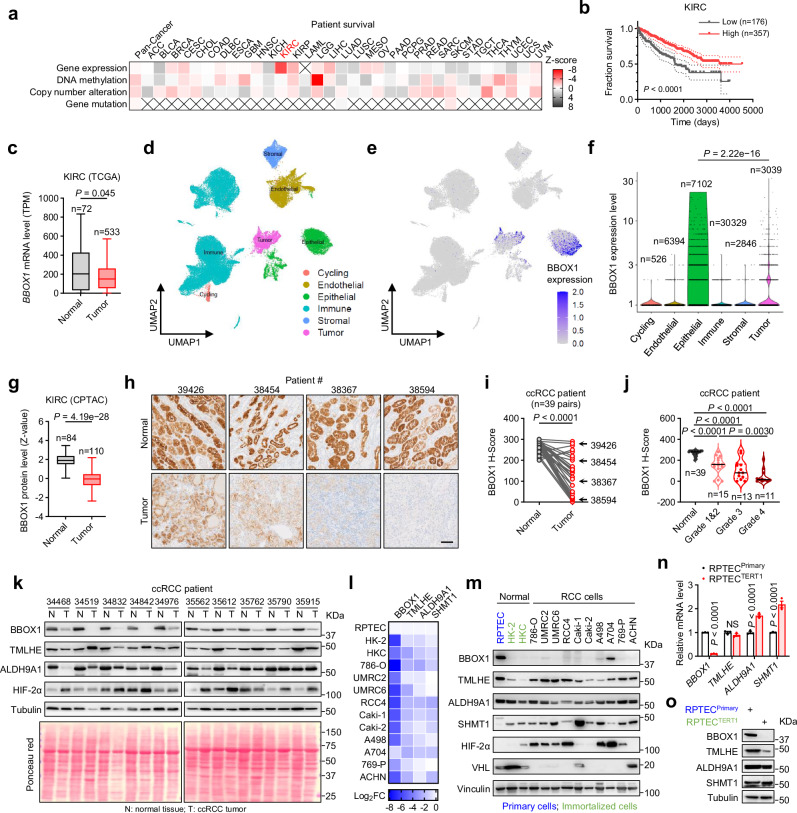
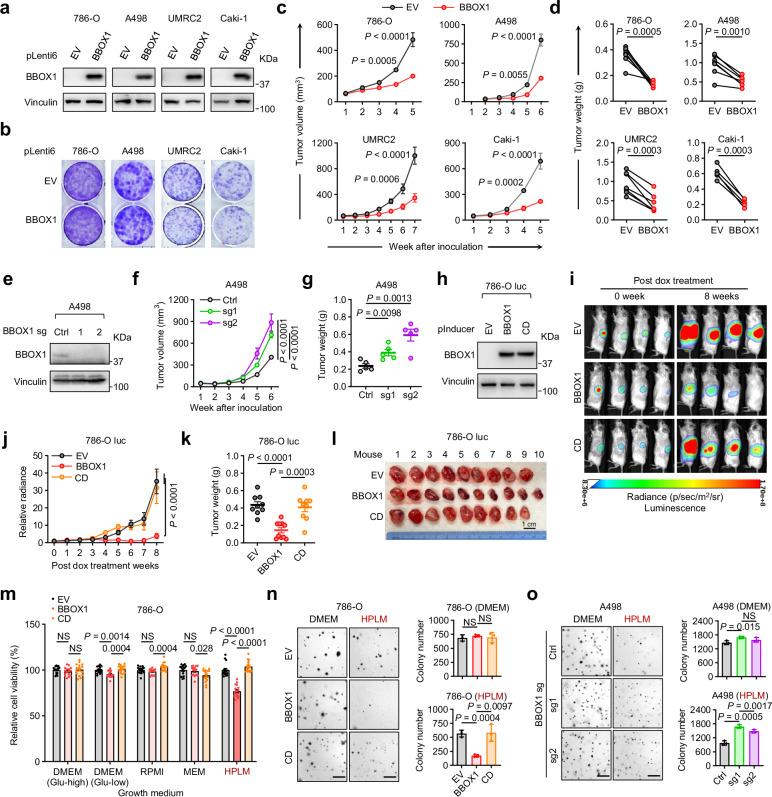
Clear cell renal cell carcinoma (ccRCC), a metabolic disease originating from renal proximal convoluted tubule (PCT) epithelial cells, remains incompletely understood in terms of its initiating signaling events. Here, we identify γ-butyrobetaine hydroxylase 1 (BBOX1), a key enzyme in carnitine synthesis predominantly expressed in PCT cells, as a tumor suppressor in ccRCC. BBOX1 expression is lost during ccRCC malignant transformation, and its restoration reduces cell viability in physiological medium and inhibits xenograft tumor growth. Transcriptomic analyses reveal that BBOX1 suppresses critical metabolic pathways including mTORC1 signaling and glycolysis in ccRCC. Further, we identify TANK-binding kinase 1 (TBK1) as an essential mediator of mTORC1 and glycolysis activation and as a target of BBOX1-mediated tumor suppression. Mechanistically, BBOX1 disrupts TBK1 activation by preventing its interaction with the upstream activator doublecortin-like kinase 2 (DCLK2). This BBOX1-DCLK2-TBK1 axis unveils an important mechanism in ccRCC metabolic dysregulation and highlights potential therapeutic strategies.


Conflict of interest statement

Competing interests: Q.Z. received the consultation fee from Exelixis. Other authors declare no competing interests.

Figures

Fig. 1
Fig. 1. BBOX1 is significantly downregulated in ccRCC.
a Comprehensive analysis of genetic features of BBOX1 linked with cancer patient outcome in The Cancer Genome Atlas (TCGA). Z scores were calculated to indicate the directions of outcomes, Z score <0: favorable, red color, Z score >0: unfavorable, gray color. KIRC: Kidney Renal Clear Cell Carcinoma. Other TCGA cancer type abbreviations are listed in Supplementary Table 1. b The overall survival of patients with high/low BBOX1 expression in KIRC subtypes from the TCGA dataset. The number of patients is indicated. c BBOX1 mRNA level of normal kidney tissues and primary tumor tissues in KIRC subtypes from the TCGA dataset. The number of patients is indicated. The median value (center line), lower quartile and upper quartile (box edges) and maximum and minimum value whiskers are indicated in the boxplot. Global single cell transcriptional map of ccRCC (d), and BBOX1 expression pattern from the RNA-seq of primary ccRCC tumors (e, f) obtained from Zvirblyte et al.. Number of cells analyzed for each category: Cycling n = 526, Endothelial n = 6394, Epithelial n = 7102, Immune n = 30329, Stromal n = 2846, Tumor n = 3039. g BBOX1 expression level of ccRCC patients in normal kidney/primary tumor tissues in the CPTAC database. The median value (center line), lower quartile and upper quartile (box edges) and maximum and minimum value whiskers are indicated in the boxplot. Representative immunohistochemistry staining images of BBOX1 (h) and H-score quantification stratified by adjacent normal kidney/primary tumor tissues (i), or tumor grade (j) of 39 paired ccRCC patient samples. Scale bar, 100 μm. k Immunoblot analysis of BBOX1 protein level in 10 pairs of adjacent normal kidney/primary tumor tissues from ccRCC patients. A heatmap illustrated the log2 fold mRNA level quantified by qRT-PCR (n = 3 technical replicates) (l) and immunoblot (m) of BBOX1 and related carnitine synthesis enzymes in a panel of normal and RCC cells. qRT-PCR (n = 3 biological cell samples, this experiment has been performed twice with similar results) (n) and immunoblot (o) of BBOX1 and related carnitine synthesis enzymes expression level in primary or hTERT1 immortalized RPTEC cells. Statistical analysis was conducted by log-rank test (b) or two-tailed Student’s t test (c, f, g, j, and n, unpaired; i, paired). Error bars represent SEM, NS denotes no significance. Representative immunoblots and gels shown in figures were repeated at least two times independently with similar results. Source data are provided as a Source Data file.
Fig. 2
Fig. 2. BBOX1 re-expression suppresses ccRCC tumorigenesis and cell growth in physiological growth conditions.
a Immunoblots of BBOX1 re-expression in multiple ccRCC cell lines. Colony formation assay in DMEM (b), subcutaneous tumor growth (c), and tumor weight (d) of ccRCC cells expressing empty vector (EV) or BBOX1. 786-O, n = 7 mice; A498, n = 7 mice; UMRC2, n = 7 mice; Caki-1, n = 5 mice. Each mouse was inoculated with EV and BBOX1 cells at both flanks. Immunoblots of cell lysates (e), subcutaneous tumor growth (f), and tumor weight (g) of A498 cells with shRNA control (Ctrl) or BBOX1 depletion by two individual sgRNAs. Ctrl, n = 5 mice; sg1, n = 5 mice; sg2, n = 5 mice. Immunoblots of cells with doxycycline (dox) induction (h), representative bioluminescence images (i), corresponding quantification data (j), tumor weight (k), and image of tumors (l) from 786-O luciferase stable cells expressing EV, BBOX1, or catalytic dead (CD) mutant injected orthotopically into the kidney of NSG mice. EV, n = 9 mice; BBOX1, n = 10 mice; CD, n = 9 mice. m Relative cell viability of 786-O cells expressing EV, BBOX1, or CD mutant grown in different growth media. n = 16 independent cell cultures. This experiment has been repeated at least two times with similar results. Representative soft agar growth with colony quantifications of 786-O cells expressing EV, BBOX1, or CD mutant (n = 3 biological cell cultures) (n), or A498 cells expressing Ctrl, BBOX1 sg1 or sg2 (n = 3 biological cell cultures) (o) in indicated growth media. Each experiment has been repeated at least two times with similar results. Scale bar, 1 mm. Statistical analysis was conducted by two-way ANOVA followed by Tukey’s multiple comparison test (c, f, and j) or two-tailed Student’s t test (d, paired; g, k, and mo, unpaired). Error bars represent SEM, NS denotes no significance. Representative immunoblots and gels shown in figures were repeated at least two times independently with similar results. Source data are provided as a Source Data file.
Fig. 3
Fig. 3. BBOX1 attenuates mTORC1 signaling in ccRCC.
Venn diagram for upregulated (a) or downregulated (b) differentially expressed genes (DEGs, BBOX1 vs EV log2FC > 0.5 or < −0.5, P < 0.05) in EV/BBOX1 786-O xenograft tumors or in vitro cells grown in DMEM. The number of unique or overlapped DEGs in each condition was indicated. cf Gene set enrichment analysis (GSEA) using normalized gene expression values of EV or BBOX1 samples from 786-O xenograft tumors (c) or in vitro cells grown in DMEM (e), n = 3 biological replicate samples per group. Hallmark gene sets were used. Downregulated or upregulated signaling pathways with FDR  <  0.05, P < 0.05 are shown. GSEA enrichment plot of the mTORC1 signaling from 786-O xenograft tumors (d) or in vitro cells grown in DMEM (f) were shown. NES, Normalized Enrichment Score. g Heatmap reveals gene expression of mTORC1 signaling related genes in EV/BBOX1 786-O xenograft tumors or in vitro cells grown in DMEM. n = 3 biological tumor or cell samples per group. Immunoblots and gel quantifications of tumor lysates from 786-O (h) or A498 (i) xenograft tumors expressing EV or BBOX1. n = 6 paired tumors, each mouse was inoculated with EV and BBOX1 cells at both flanks. j Immunoblots and gel quantifications of tumor lysates from A498 xenograft tumors expressing control sgRNA (Ctrl), or BBOX1 sgRNA 1 and 2. n = 4 mice. k Immunoblots of 786-O or UMRC2 cells expressing empty vector (EV), BBOX1, or catalytic dead (CD) mutant. l Immunoblots of A498 cells expressing Ctrl, or BBOX1 sgRNA 1 and 2. m Representative immunohistochemistry (IHC) staining images of BBOX1, phospho-S6 (at S240/244), and phospho-4EBP1 (at T37/46) in 39 ccRCC tumor samples. Scale bar, 100 μm. Spearman correlation between BBOX1 and phospho-S6 (n) or between BBOX1 and phospho-4EBP1 (o) in 39 ccRCC tumor tissues. p H-score of phosphor-S6 in ccRCC tumor thrombus samples stratified by low or high levels of BBOX1 mRNA expression from a previous study. Two-tailed Student’s t test (h, i paired and j, np unpaired), two-sided permutation test (cf). Error bars represent SEM. Representative immunoblots and gels shown in figures were repeated at least two times independently with similar results. Source data are provided as a Source Data file.
Fig. 4
Fig. 4. BBOX1 suppresses glycolysis in physiological conditions.
a Heatmap reveals gene expression of glycolysis related genes in 786-O xenograft tumors or in vitro cells grown in DMEM. n = 3 biological tumor or cell samples per group. qRT-PCR of glycolytic genes in EV/BBOX1 786-O xenograft tumors (n = 3 biological tumor samples per group) (b) or in vitro cells grown in DMEM (n = 3 biological cell samples per group) (c). Each experiment has been repeated two times with similar results. d Carbon flow of the isotopomer distribution of indicated metabolites derived from [1,2-13C]glucose. M2 isotopomer distribution of indicated glycolytic metabolites (e), TCA cycle (f), and amino acids (g) in 786-O xenograft tumors with EV or BBOX1 expression. n = 3 biological tumor samples per group. Measurement of extracellular acidification rate (ECAR) in 786-O (h) or UMRC2 (i) cells expressing EV or BBOX1 grown in DMEM or HPLM medium. n = 5 independent cell cultures for each group. The median value (center line), lower quartile and upper quartile (box edges) and maximum and minimum value whiskers are indicated in the boxplot. Each experiment has been repeated two times with similar results. j, k Measurement of ECAR in A498 cells control sgRNA (Ctrl) (n = 6 independent cell cultures) or BBOX1 sgRNA 1 and 2 (n = 7 independent cell cultures) grown in DMEM (j) or HPLM (k) medium. The median value (center line), lower quartile and upper quartile (box edges) and maximum and minimum value whiskers are indicated in the boxplot. Each experiment has been repeated two times with similar results. Two-tailed Student’s t test (b, c, eg, and hk, unpaired). Error bars represent SEM, NS denotes no significance. Source data are provided as a Source Data file.
Fig. 5
Fig. 5. Identification of TBK1 as a key mediator contributing to BBOX1 function in ccRCC.
a IP-mass spectrometry (MS) from 786-O and Caki-1 tumor lysates identified TBK1 as a top candidate protein interacting with BBOX1. b List of top BBOX1 binding proteins identified by IP-MS from 786-O and Caki-1 xenograft tumors. The full list of MS-identified proteins is provided in Supplementary Data 1. c Co-immunoprecipitation of endogenous TBK1 and endogenous BBOX1 in A498 xenograft tumors. d Co-immunoprecipitation of endogenous TBK1 and HA-tagged wild type BBOX1 or catalytic dead (CD) mutant in 786-O xenograft tumors or in vitro cells. eg Immunoblots (e), ECAR measurement (n = 5 independent cell cultures, The median value (center line), lower quartile and upper quartile (box edges) and maximum and minimum value whiskers are indicated in the boxplot.) (f), and soft agar growth (n = 3 biological cell cultures) (g) of A498 cells expressing indicated BBOX1 sgRNA and TBK1 shRNA grown in HPLM medium. Each experiment has been repeated at least two times with similar results. Scale bar, 1 mm. h, i Subcutaneous xenograft tumor growth (h) and tumor weight (i) of A498 cells expressing indicated BBOX1 sgRNA and TBK1 shRNA. n = 8 mice for each group. Immunoblots (j) and soft agar growth (n = 3 biological cell cultures) (k) of A498 cells expressing indicated BBOX1 expression vector and TBK1 shRNA grown in HPLM medium. Each experiment has been repeated at least two times with similar results. Scale bar, 1 mm. Subcutaneous xenograft tumor growth (l), and tumor weight (m) of A498 cells expressing indicated BBOX1 expression vector and TBK1 shRNA. n = 6 mice for each group. Statistical analysis was conducted by two-way ANOVA followed by Tukey’s multiple comparison test (h and l) or two-tailed Student’s t test (f, g, i, k, and m). Error bars represent SEM, NS denotes no significance. Representative immunoblots and gels shown in figures were repeated at least two times independently with similar results. Source data are provided as a Source Data file.
Fig. 6
Fig. 6. TBK1 is required for mTORC1 activation and glycolysis in physiological conditions.
a Immunoblots of 786-O or A498 cells expressing doxycycline-inducible control shRNA (Ctrl), or TBK1 shRNAs (82, 85) grown in DMEM or HPLM medium. b Immunoblots of 786-O or UMRC2 cells treated with TBK1 PROTAC grown in DMEM or HPLM medium. c Immunoblots of A498 cells expressing empty vector (EV), wild type TBK1, or S172D mutant grown in DMEM or HPLM medium. d Immunoblots of 786-O cells treated with TBK1 CMPD1 grown in DMEM or HPLM medium. e, f Measurement of extracellular acidification rate (ECAR) in A498 cells expressing doxycycline-inducible control (Ctrl) (n = 6 independent cell cultures) or TBK1 shRNAs (n = 7 independent cell cultures) (e) or expressing EV, S172D mutant (n = 7 independent cell cultures for each group) (f) grown in HPLM. The median value (center line), lower quartile and upper quartile (box edges) and maximum and minimum value whiskers are indicated in the boxplot. Each experiment has been repeated two times with similar results. g Representative soft agar images (left) and colony quantification (right) of A498 cells expressing Ctrl or TBK1 shRNA 85 grown in DMEM or HPLM medium. n = 4 biological cell cultures for each group. This experiment has been repeated two times with similar results. Scale bar, 1 mm. Subcutaneous xenograft tumor growth (n = 6 mice for each group) (h), immunoblot with corresponding gel quantifications (n = 6 paired tumors, each mouse was inoculated with Ctrl and sh85 cells at both flanks) (i) of A498 cells with TBK1 depletion by shRNA 85. Doxycycline (Dox) chow was treated at the indicated time point. qRT-PCR of glycolytic genes in A498 xenograft tumors (n = 4 biological tumor samples per group) (j) or in vitro cells grown in DMEM (n = 3 biological cell samples per group) (k) expressing Ctrl, or TBK1 shRNA 85. Each experiment has been repeated two times with similar results. Statistical analysis was conducted by two-way ANOVA followed by Tukey’s multiple comparison test (h) or two-tailed Student’s t test (e, f, g, j, and k, unpaired; i, paired). Error bars represent SEM, NS denotes no significance. Representative immunoblots and gels shown in figures were repeated at least two times independently with similar results. Source data are provided as a Source Data file.
Fig. 7
Fig. 7. BBOX1 negatively regulates TBK1 activation in ccRCC.
Immunoblots of A498 cells expressing empty vector (EV) or BBOX1 grown in DMEM or HPLM medium (a) or xenograft tumors with quantifications (n = 6 paired tumors, each mouse was inoculated with EV and BBOX1 cells at both flanks) (b). Immunoblots of A498 (c) or UMRC2 (d) cells grown in DMEM or HPLM medium, or A498 xenograft tumors (n = 4 individual tumors for each group) (e) with BBOX1 knockout by sgRNAs. f Immunoblot of phospho-TBK1 and total TBK1 in various normal and RCC cells. g Immunoblot of phospho-TBK1 and total TBK1 in primary and transformed RPTEC cells. h Representative immunohistochemistry (IHC) staining images of BBOX1, phospho-TBK1 (at S172), and total TBK1 in 39 ccRCC tumor samples. Scale bar, 200 μm. Spearman correlation between BBOX1 and phospho-TBK1 (i) or between BBOX1 and TBK1 (j) in 39 ccRCC tumor tissues. k Immunoprecipitation of endogenous DCLK2, TBK1, and HA-tagged wild type BBOX1 or catalytic dead (CD) mutant in 786-O cells. Arrows indicate DCLK2 201 and 203 isoforms. l Immunoprecipitation of endogenous DCLK2-203 isoform, TBK1, and HA-tagged BBOX1 in A498 cells treated with 2 mM BBOX1 inhibitor for 72 h. m Pull-down assay between recombinant GST-DCLK2 and His-BBOX1 protein. n Immunoprecipitation of V5-tagged DCLK2-203 and endogenous TBK1 with increased expression of HA-tagged BBOX1 in 293T cells grown in HPLM medium for 48 h. o Immunoblots of in vitro kinase assay samples incubated with in vitro translated (IVT) TBK1, recombinant DCLK2 and BBOX1 proteins, ATP, or BBOX1 inhibitor (4 mM) as indicated. p Schematic model of the mechanism proposed for this study. Two-tailed Student’s t test (b, paired; e, I, j, unpaired). Error bars represent SEM. Representative immunoblots and gels shown in figures were repeated at least two times independently with similar results. Source data are provided as a Source Data file.

References

    1. Siegel, R. L., Miller, K. D., Fuchs, H. E. & Jemal, A. Cancer statistics, 2022. CA Cancer J. Clin.72, 7–33 (2022). - PubMed
    1. Godwin, J. L., Zibelman, M., Plimack, E. R. & Geynisman, D. M. Immune checkpoint blockade as a novel immunotherapeutic strategy for renal cell carcinoma: a review of clinical trials. Discov. Med.18, 341–350 (2014). - PubMed
    1. Kaelin, W. G. Jr. Molecular basis of the VHL hereditary cancer syndrome. Nat. Rev. Cancer2, 673–682 (2002). - PubMed
    1. Kondo, K., Kim, W. Y., Lechpammer, M. & Kaelin, W. G. Jr. Inhibition of HIF2alpha is sufficient to suppress pVHL-defective tumor growth. PLoS Biol.1, E83 (2003). - PMC - PubMed
    1. Cho, H. et al. On-Target Efficacy of a HIF2alpha Antagonist in Preclinical Kidney Cancer Models. Nature, 10.1038/nature19795 (2016). - PMC - PubMed

MeSH terms