. 2025 Mar;44(6):1749-1773.
doi: 10.1038/s44318-025-00377-5. Epub 2025 Feb 11.

Mitochondrial DNA removal is essential for sperm development and activity

Affiliations

Mitochondrial DNA removal is essential for sperm development and activity

Zhe Chen et al. EMBO J. 2025 Mar.

Abstract

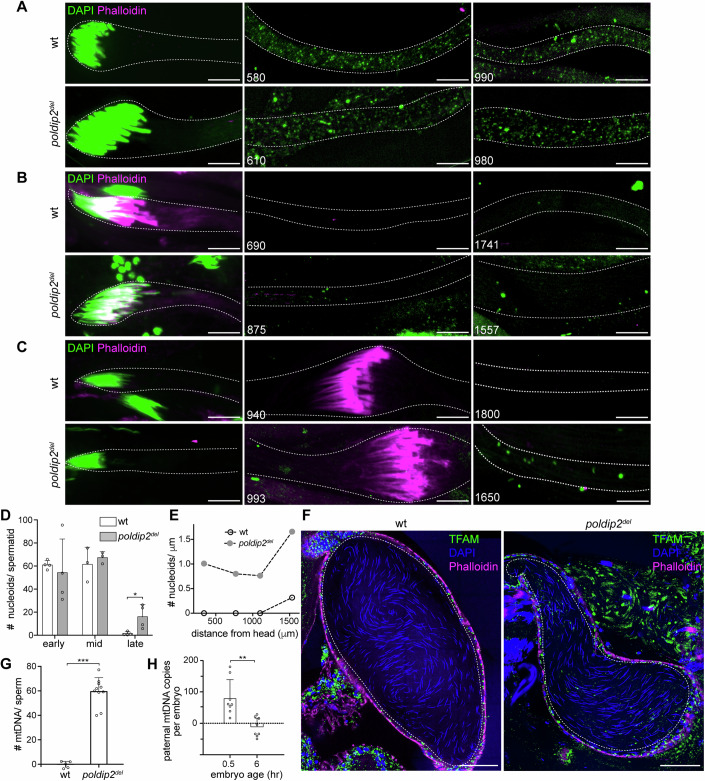
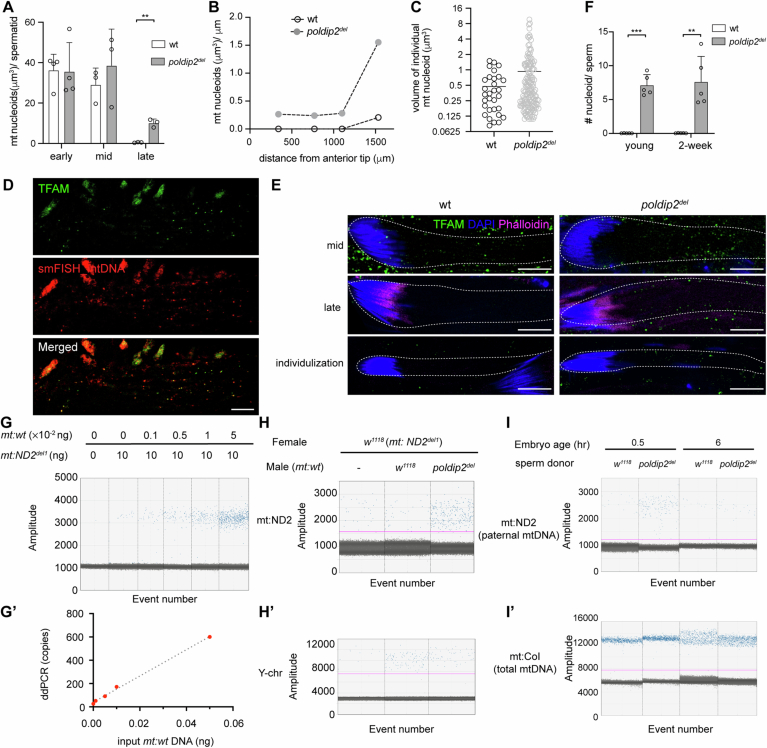
Active mitochondrial DNA (mtDNA) elimination during spermatogenesis has emerged as a conserved mechanism ensuring the uniparental mitochondrial inheritance in animals. However, given the existence of post-fertilization processes degrading sperm mitochondria, the physiological significance of mtDNA removal during spermatogenesis is not clear. Here we show that mtDNA clearance is indispensable for sperm development and activity. We uncover a previously unappreciated role of Poldip2 as a mitochondrial exonuclease that is specifically expressed in late spermatogenesis and required for sperm mtDNA elimination in Drosophila. Loss of Poldip2 impairs mtDNA clearance in elongated spermatids and impedes the progression of individualization complexes that strip away cytoplasmic materials and organelles. Over time, poldip2 mutant sperm exhibit marked nuclear genome fragmentation, and the flies become completely sterile. Notably, these phenotypes were rescued by expressing a mitochondrially targeted bacterial exonuclease, which ectopically removes mtDNA. Our work illustrates the developmental necessity of mtDNA clearance for effective cytoplasm removal at the end of spermatid morphogenesis, and for preventing potential nuclear-mitochondrial genome imbalance in mature sperm, in which nuclear genome activity is shut down.

Keywords: Drosophila spermatogenesis; EndoG; Exonuclease; Male Sterile; Maternal Inheritance.


Conflict of interest statement

Disclosure and competing interests statement. The authors declare no competing interests.

Figures

Figure 1
Figure 1. A mitochondrial nucleoid protein, Poldip2, is required for male fertility.
(A) A representative image of an S2 cell co-expressing Poldip2-mCherry-nGFP (red) and SOD2-cGFP. Two half-GFP molecules reconstitute into a functional whole GFP (green), demonstrating that Poldip2 co-localizes with SOD2 in the mitochondrial matrix. Bar, 5 μm. (B) Poldip2 concentrates on specific loci on mitochondria, which stain positively for Picogreen (arrows), indicating Poldip2 is associated with mitochondrial nucleoids. Bar, 5 μm. (C) Schematic representation of the CG12162 genomic locus, illustrating CG12162 transcripts, 5’- and 3’-UTR (gray bars), exons (blue bars), and the deleted region in poldip2del. Arrowheads illustrate the target sites of guide RNAs used for generating the poldip2 deletion, and for knocking in mNeonGreen. (D) Western blot confirms the deletion of the Poldip2 protein in poldip2del flies. (E) The poldip2del flies are male semi-sterile. The number of progeny produced per day is shown. Compared with wild-type, male poldip2del flies produce significantly fewer progeny at a young age and become completely sterile after two weeks. The semi-sterile phenotype can be rescued by expressing either Poldip2 or hPoldip2 protein in poldip2del flies (n ≥ 30). The data represent the mean± SD. Statistical analysis was performed using an unpaired t test. P values from left to right: ***P = 1.5 × 10−31, P = 8.0 × 10−40, P = 4.5 × 10−27, P = 4.2 × 10−34, P = 7.1 × 10−38, P = 1.4 × 10−18. (F) Poldip2 is highly expressed in fully elongated spermatids and all subsequent developmental stages within Drosophila testes. Polyglycylated tubulin marks fully elongated axonemal microtubules. Phalloidin stains actin cones and outlines the testis. Bar, 100 μm. (G) Representative image showing that Poldip2 aligns alongside microtubules and is absent from the nuclear head region in spermatozoa, demonstrating that Poldip2 exclusively localizes in mitochondria in mature spermatozoa (enlarged view outlined). Green: Poldip2-mNeon-Green; Red: Polyglycylated tubulin; Magenta: DAPI; bar, 5 μm. Source data are available online for this figure.
Figure 2
Figure 2. Mitochondrial DNA persists in the late stages of spermatogenesis in poldip2del flies.
(AC) Representative images of elongating (A), fully elongated (B), and individualization (C) spermatid bundles isolated from w1118 (wt) and poldip2del flies, and stained for DNA (DAPI, green) and actin cones (Phalloidin, magenta). Note that DAPI stains both nuclear DNA (nuDNA) and mitochondrial DNA (mtDNA) in isolated spermatid bundles. Dashed lines outline bundles. Numbers indicate the distance (μm) from the nuclear head. Bar, 10 μm. (D) Quantification of the total mitochondrial nucleoid numbers per spermatid at early-elongating (early), mid-elongating (mid) and fully elongated (late) stages. Each data point represents a spermatid (n = 3, 4). The data represent the mean± SD. Statistical analysis was performed using an unpaired t test. *P = 0.029. (E) The density of mitochondrial nucleoids (total numbers per μm) along the length of representative fully elongated spermatid bundles for w1118 (wt) and poldip2del flies, respectively. (F) Representative images showing many mitochondrial nucleoids labeled by TFAM-mNeonGreen in poldip2del, but not in wt mature sperm (dashed lines). Phalloidin stains actin (magenta); DAPI stains needle-shaped nuDNA (blue). Bar, 50 μm. (G) Droplet digital PCR (ddPCR) quantification of the average number of paternal mtDNA molecules per sperm in the female spermatheca. Crosses were performed between female w1118 (mt:ND2del1) flies and male w1118 (mt:wt) or poldip2del (mt:wt) flies. Each data point represents a biological replicate (n = 5, 10). The data represent the mean± SD. Statistical analysis was performed using an unpaired t test. ***P = 3.8 × 10−8. See also Fig. EV2H,H’. (H) Droplet digital PCR (ddPCR) quantification of the poldip2del sperm-derived mtDNA in embryos. Crosses were conducted between female w1118 (mt:ND2del1) and male poldip2del (mt:wt) flies. Embryos were collected 0–30 min post-laying and analyzed immediately (0.5 h, n = 8) or after 6 h (6 h, n = 8) of development. Crosses between female w1118 (mt:ND2del1) and male w1118 (mt:wt) were used as the negative control, as no sperm mtDNA is expected in this cross. Each data point represents a biological replicate (n = 8). The data represent the mean ± SD. Statistical analysis was performed using an unpaired t test. **P = 0.0014. See also Fig. EV2I,I’. Source data are available online for this figure.
Figure 3
Figure 3. Poldip2 is a mitochondrial DNA exonuclease.
(A) Genetic scheme of replacing the poldip2 coding sequence (CDS) with a mitochondrially targeted E. coli Exonuclease III (mitoExoIII) in developing spermatids. The SV40 transcription termination sequence (hexagon) flanked by two FRT sites (arrowheads) allows conditional expression of mitoExoIII induced by Flippase (FLP). (B) Expression of mitoExoIII in spermatids reduced mitochondrial nucleoid numbers in mature sperm of 3-day-old poldip2del flies. (1) wt: UAS-FLP/+; Bam-gal4, poldip2 del /+. (2) poldip2 del: +/+; Bam-gal4, poldip2 del/poldip2mitoExoIII; (3) poldip2 del/poldip2mitoExoIII: UAS-FLP/+; Bam-gal4, poldip2 del/ poldip2mitoExoIII. Each data point represents quantification from one seminal vesicle (n = 5). The data represent the mean± SD. Statistical analysis was performed using an unpaired t test. P values from left to right: ***P = 3.2 × 10−6, P = 4.8 × 10−5. (C) Expression of mitoExoIII in spermatids rescued the fertility of both young and 2-week-old male poldip2del flies. The number of progeny per day is shown. (1) wt: UAS-FLP/+; Bam-gal4, poldip2 del /+. (2) poldip2 del: +/+; Bam-gal4, poldip2 del/poldip2mitoExoIII; (3) poldip2 del/poldip2mitoExoIII: UAS-FLP/+; Bam-gal4, poldip2 del/ poldip2mitoExoIII. Each data point represents a biological replicate (n = 20). The data represent the mean± SD. Statistical analysis was performed using an unpaired t test. P values from left to right: ***P = 2.6 × 10−18, P = 3.2 × 10−8, P = 3.0 × 10−34, P = 4.9 × 10−9. (D) Poldip2 exhibits 3’–5’ exonuclease activity. A 5’-6-FAM-labeled 20-nt poly(dT) (100 nM) was incubated with the Poldip2 protein (200 nM) at 37 °C and analyzed at the indicated time points. A ladder-like pattern of oligonucleotides ranging from monomer (arrowhead) to 19-mer was generated. (E) Poldip2 displays 5’–3’ exonuclease activity. A 3’-6-FAM-labeled 20-nt poly(dT) (100 nM) was incubated with the Poldip2 protein (200 nM) at 37 °C and analyzed at the indicated time points. The resulting products showed a ladder pattern ranging from 3-mer (arrowhead) to 19-mer. (F) Poldip2 degrades dC less efficiently. The 5’-6-FAM-labeled 25-nt poly(dT) or 25-nt poly(dTdC) (100 nM) was incubated with the Poldip2 protein (400 nM) at 37 °C and analyzed at the indicated time points. The 5’-end five nucleotides were protected from degradation by incorporating the internucleotide phosphorothioate bonds (red). Note the smallest degradation product is 15-mer (arrowhead) in the reaction of poly(dTdC), suggesting the stretch of dC inhibits the progression of the exonuclease. (G) Poldip2 degrades double-stranded DNA (dsDNA) with breaks. Three types of dsDNA, including blunt-ended dsDNA (−), dsDNA with a single nick (nick), and dsDNA with a single gap (gap), were generated using a 5’-6-FAM-labeled, 32-nt long oligonucleotide. The dsDNA substrates (100 nM) were incubated with the Poldip2 protein (1200 nM) at 37 °C and analyzed after 40 min. The molecular markers in this figure are an equal molar mixture of 5’-6-FAM-labeled 32-nt, 20-nt, 10-nt and 5-nt oligonucleotides and were loaded at a concentration of 50 nM for each. See also Table EV3. Source data are available online for this figure.
Figure 4
Figure 4. Persistent mtDNA impedes spermatid individualization.
(A) Representative images showing the coiling region (white dashed line) and seminal vesicle (yellow dashed line) of w1118 (wt) and poldip2del testes. Bar, 100 μm. Inset, the coiling region of poldip2del testes accumulates many needle-shaped nuclei stained with DAPI (magenta), some of which remain bundled together. Phalloidin: green. Bar, 50 μm. (B) Fewer mature sperm are present in the seminal vesicles of both young and 2-week-old poldip2del flies compared with the wild-type control, a deficiency that can be rescued by expressing mitoExoIII in spermatids. The number of mature sperm nuclei was quantified in each seminal vesicle of the indicated genotypes. (1) wt: UAS-FLP/+; Bam-gal4, poldip2 del /+. (2) poldip2 del: +/+; Bam-gal4, poldip2 del/poldip2mitoExoIII; (3) poldip2 del/poldip2mitoExoIII: UAS-FLP/+; Bam-gal4, poldip2 del/ poldip2mitoExoIII. Each data point represents quantification from one seminal vesicle (n = 6, 4). The data represent the mean± SD. Statistical analysis was performed using an unpaired t test. P values from left to right: **P = 0.00068, **P = 0014, *P = 0.035, ***P = 0.0001. (C) Representative transmission electron microscopy (TEM) images of cross sections of Drosophila testes from 3-day-old flies showing individualized spermatid cysts. In poldip2del testes, red arrows denote spermatids with incomplete membrane contour; red arrowheads denote two connected spermatids; yellow arrow denotes abnormal mitochondrial derivate structures. Bar, 1 μm. Bar in insets, 500 nm. (D) The double mutant flies are completely sterile, in contrast to the normal fertility of the endoG mutant. The fertility of male poldip2del, endoG (endoGMB07150/KO) and double mutant (endoGMB07150/KO; poldip2del) was normalized to that of w1118 male flies and plotted (n = 10). The data represent the mean ± SD. Statistical analysis was performed using an unpaired t test. P values from left to right: **P = 0.005, ***P = 2.1 × 10−12, ***P = 4.0 × 10−19, ***P = 6.6 × 10−11, ***P = 6.2 × 10−11. (EG) Representative images showing the isolated spermatid bundles of the elongating (E), fully elongated (F), and individualization (G) stages stained for DNA (DAPI) and actin cones (Phalloidin) in endoG (endoGMB07150/KO) and double mutant (endoGMB07150/KO; poldip2del). DAPI stains both nuDNA and mtDNA in isolated spermatid bundles. Note the disorganized actin cone structures in the double mutant. Dashed lines mark bundles’ boundary. Numbers indicate the distance (μm) from the anterior tip of the spermatid. Bar, 10 μm. (H) Quantification of remaining mitochondrial nucleoids in fully elongated spermatids of w1118 (wt), poldip2del, endoG (endoGMB07150/KO) and double mutant (endoGMB07150/KO; poldip2del) flies. Total mitochondrial nucleoids measured in volumes per spermatid in the fully elongated stage were normalized to that of the elongating stage in each genotype. Each data point represents a spermatid (n = 3, 4). The data represent the mean ± SD. Statistical analysis was performed using an unpaired t test. P values from left to right: *P = 0.013, **P = 0.0018, **P = 0.0042, **P = 0.0045. Source data are available online for this figure.
Figure 5
Figure 5. Persistent mtDNA in mature sperm damages the nuclear genome.
(A) Representative images of a TUNEL assay showing nuDNA breaks/fragmentation in 2-week-old poldip2del mature sperm. TFAM-mNeonGreen labels mitochondrial nucleoids (green), and DAPI (blue) stains nuDNA of mature sperm in seminal vesicles. Red: TUNEL signal. Bar, 10 μm. (B) Expression of mitoExoIII in spermatids reduces nuDNA breaks/fragmentation in poldip2del mature sperm. Quantification was performed by normalizing the nuDNA breaks/fragmentation stained with the TUNEL assay to the total sperm numbers stained by DAPI in a seminal vesicle. (1) wt: UAS-FLP/+; Bam-gal4, poldip2 del /+. (2) poldip2 del: +/+; Bam-gal4, poldip2 del/poldip2mitoExoIII; (3) poldip2 del/poldip2mitoExoIII: UAS-FLP/+; Bam-gal4, poldip2 del/ poldip2mitoExoIII. Each data point represents quantification from one seminal vesicle (n = 10). The data represent the mean± SD. Statistical analysis was performed using an unpaired t test. P values from left to right: **P = 0.00017, P = 0.00031. (C) Representative images of CellROX Deep Red staining of seminal vesicles from 2-week-old wt, poldip2del and poldip2del /poldip2mitoExoIII flies. Red: CellROX Deep Red; Blue: nuDNA stained by DAPI. Bar, 20 μm. (D) Quantification of CellROX intensity, as the measure of ROS levels in both young and 2-week-old flies with indicated genotypes. (1) wt: UAS-FLP/+; Bam-gal4, poldip2 del /+. (2) poldip2 del: +/+; Bam-gal4, poldip2 del/poldip2mitoExoIII; (3) poldip2 del/poldip2mitoExoIII: UAS-FLP/+; Bam-gal4, poldip2 del/ poldip2mitoExoIII. A.U., arbitrary unit. Each data point represents quantification from one seminal vesicle (n = 6). The data represent the mean± SD. Statistical analysis was performed using an unpaired t test. ***P = 3.6 × 10−5, **P = 0.0002. (E) Proposed model of pre-fertilization mtDNA removal. In elongating spermatids, mitochondria undergo dramatic structural changes, potentially sensitizing mitochondrial nucleoids. This may trigger the EndoG-dependent mtDNA nicking or DNA breaks through other unknown mechanisms, initiating the clearance of mtDNA. In the final stage of spermatid elongation, the abrupt expression of Poldip2 leads to the complete degradation of mtDNA. During individualization, the individualization complexes (ICs) progress down the spermatids, gathering any remaining oligonucleotides, and ultimately discarding them in waste bags. Consequently, mature sperm are devoid of mtDNA. Source data are available online for this figure.
Figure EV1
Figure EV1. Tissue expression profile of Drosophila mitochondrial nucleoid-associated proteins.
The heatmap was generated with RNA-seq data from FlyAtlas2 (the Drosophila gene expression atlas). Color codes indicate the scaled RPKM (reads per kilobase per million mapped reads) folds over tissues. Note that the mRNA level of Poldip2 is significantly higher in Drosophila testes compared to other tissues. A, adult; L3, third instar larva; F, female; M, male.
Figure EV2
Figure EV2. Mitochondrial DNA persists in late spermatogenesis stages and mature sperm of poldip2del flies.
(A) Total mitochondrial nucleoids measured in volumes per spermatid at early-elongating (early), mid-elongating (mid) and fully elongated (late) stages. Each data point represents a spermatid (n = 3, 4). The data represent the mean± SD. Statistical analysis was performed using an unpaired t test. **P = 0.0012. (B) The density of mitochondrial nucleoids (total volumes per μm) along the length of a representative fully elongated spermatid bundle for w1118 (wt) and poldip2del flies, respectively. (C) A scatter dot plot displaying the individual mitochondrial nucleoid volumes from the fully elongated spermatids of w1118 (wt) and poldip2del flies. Each data point represents an individual nucleoid (wt, n = 31; poldip2del, n = 153). The solid lines indicate the mean volume. (D) TFAM-mNeonGreen can be used as a mitochondrial nucleoid marker in Drosophila testis. Single-molecule fluorescent in situ hybridization (smFISH) signals using fluorescently labeled DNA probes specific for mtDNA (red), are colocalized with TFAM-mNeonGreen in Drosophila testis. Bar, 10 μm. (E) Mitochondrial nucleoids labeled by TFAM-mNeonGreen demonstrate a consistent pattern of mtDNA elimination during spermatogenesis in both w1118 (wt) and poldip2del flies, compared with DNA dye (DAPI) staining. In elongating spermatids of both wt and poldip2del testis, intense TFAM-mNeonGreen puncta signals were detected. The signals were rare in fully elongated and individualization stage spermatids of wt flies. Conversely, persistent mtDNA was frequently observed in the same stages of poldip2del spermatids. Phalloidin (magenta) stains actin; DAPI (blue) stains nuDNA. Bar, 10 μm. (F) Quantification of mitochondrial nucleoid numbers in mature sperm of young and 2-week-old flies. Each data point represents quantification from one seminal vesicle (n = 5). The data represent the mean± SD. Statistical analysis was performed using an unpaired t test. ***P = 7.0 × 10−6, **P = 0.0019. (G) Evaluating the specificity of the primers/probe set targeting mtDNA-encoded ND2 locus (mt:ND2) using droplet digital PCR (ddPCR) assay. A reaction containing 10 ng of total DNA from w1118 (mt:ND2del1), a fly strain carrying a 9-base pair deletion on the mtDNA-encoded ND2 locus, mixed with 0, 0.001, 0.005, 0.01 or 0.05 ng of total DNA from w1118 (mt:wt, wild-type mtDNA) flies, was performed. The ddPCR primers/probe were designed to target the mt:wt while excluding mt:ND2del1 mtDNA. (G’) Correlation of the amount of input w1118 (mt:wt) DNA with the resulting mtDNA copy numbers using ddPCR. Simple linear regression was carried out and the coefficient of correlation R2 = 0.9947. (HH’) Quantification of mtDNA copy numbers per sperm in w1118 and poldip2del flies using ddPCR. Crosses were conducted between female w1118 (mt:ND2del1) and male w1118 (mt:wt) or poldip2del (mt:wt) flies. Then the total DNA from the female spermatheca was extracted and analyzed. Virgin female w1118 (mt:ND2del1) flies were used as the negative control. The primers/probe sets were designed to target mt:ND2 (H) and Y-chromosome gene kl-2 (H’), respectively. The input total DNA for detecting mt:ND2 gene is 5 ng for each reaction. The input total DNA for detecting the Y-chromosome gene is 125 ng for each reaction. (II’) Analysis of sperm-derived mtDNA in embryos using ddPCR. Crosses were performed between female w1118 (mt:ND2del1) and male w1118 (mt:wt) or poldip2del (mt:wt) flies. Embryos were collected 0–30 min post-laying and analyzed immediately (0.5 h) or after 6 h (6 h) of development. Primers/probe sets targeting mt:ND2 (I) and mt:CoI (I’) were used to quantify paternal mtDNA and total mtDNA, respectively. Total mtDNA levels in embryos remain constant up to 10 h after egg-laying (Rubenstein et al, 1977), averaging 2.5 × 106 copies per embryo (Appendix Fig. S1E). Input maternal mtDNA for detecting mt:ND2 and mt:CoI was 2.5 × 106 and 2 × 103 copies per reaction, respectively.
Figure EV3
Figure EV3. Poldip2 is a mitochondrial DNA exonuclease.
(A) SDS-PAGE of the purified Poldip2 protein. M, molecular weight marker. (B, C) Degradation pattern of 5’-6-FAM and 3’-6-FAM-labeled 20-nt poly (dA) single-stranded (ssDNA) substrates. The 100 nM 5’-6-FAM (B) or 3’-6-FAM (C) labeled 20-nt poly (dA) was incubated with Poldip2 protein (200 nM) at 37 °C and analyzed at the indicated time points. (D) Degradation pattern of a 5’-6-FAM-labeled ssDNA substrate consisting of mixed dA, dT, dC and dG. The 100 nM 5’-6-FAM-labeled 32-nt ssDNA was incubated with Poldip2 protein (200 nM) at 37 °C and analyzed at the indicated time points. (E, F) Degradation pattern of 5’-6-FAM and 3’-6-FAM-labeled 20-nt poly (dC) ssDNA substrates. The 100 nM 5’-6-FAM (E) or 3’-6-FAM (F) labeled 20-nt poly(dC) was incubated with Poldip2 protein (200 nM) at 37 °C and analyzed at the indicated time points. (G, H) Quantification of the remaining full-length substrates, including 5’-6-FAM (G) or 3’-6-FAM (H) labeled 20-nt poly (dT), poly (dA) and poly (dC), at each time point. Data are normalized to the initial level of the full-length substrates and plotted (n = 3). The molecular markers in this figure are an equal molar mixture of 5’-6-FAM-labeled 32-nt, 20-nt, 10-nt and 5-nt oligonucleotides and were loaded at a concentration of 50 nM for each. The data represent the mean± SD.
Figure EV4
Figure EV4. Persistent mtDNA impedes spermatid individualization.
(AJ) Representative images showing the whole testis (A, F), individualization complexes (ICs) formation next to the nuclear head in the testis basal region (B, G), actin cone structures in progressing ICs (C, H), waste bags (D, I), and seminal vesicles (E, J, yellow dashed line) in w1118 (wt) and poldip2del flies. Phalloidin stains actin; DAPI stains nuDNA. Bar, 100 μm in (A) and (F); 10 μm in (BD) and (GI); 50 μm in (E) and (J). (K) Representative images showing the coiling region (white dashed line) and seminal vesicle (yellow dashed line) of w1118 (wt) and poldip2del flies. DJ-MTS-Red stains the mitochondria derivatives; Polyglycylated tubulin stains fully elongated axonemal microtubules; Phalloidin stains actin; DAPI stains nuDNA. Bar, 50 μm. (L) The coiling region in both young and 2-week-old poldip2del flies is enlarged compared to wt control. Each data point represents quantification from one testis (n = 4, 5). The data represent the mean± SD. Statistical analysis was performed using an unpaired t test. P values from left to right: **P = 0.00042, P = 0.0012. (M) A scatter dot plot displaying the individual mitochondrial nucleoid volumes from the elongated spermatids of endoG (endoGMB07150/KO) and double mutants (endoGMB07150/KO; poldip2del). Each data point represents an individual nucleoid (endoG, n = 58; double mutant, n = 248). The solid lines indicate the mean volume. Statistical analysis was performed using an unpaired t test. *P = 0.0058.
Figure EV5
Figure EV5. Persistent mtDNA in mature sperm causes nuclear DNA fragmentation.
(A) Representative images showing nuDNA breaks labeled by TUNEL assay in the process of chromatin remodeling during spermatogenesis. The highest abundance of TUNEL signal (white) was observed in the late canoe stage, which corresponds to the histone-to-protamine transition phase. The nuDNA breaks subsequently disappeared in needle-shaped nuclei during late elongation and individualization stages, indicating the repair of nuDNA breaks after the transition. No significant differences were observed between wt and poldip2del flies throughout this process. The developmental stages were distinguished by the morphology of nuclear heads stained with DAPI (blue), and the positioning of actin cones stained with Phalloidin (magenta). Bar, 10 μm. (B) Compromised mitochondrial membrane potential of poldip2del sperm. Mature sperm from w1118 (wt) and poldip2del seminal vesicles were stained with TMRM (red), a dye sensitive to mitochondrial membrane potential, in combination with MitoTracker Green (green) as a reference. Bar, 10 μm. (C) Quantification of TMRM/MitoTracker Green ratios in both young and 2-week-old flies. Each data point represents quantification from one seminal vesicle (n = 4, 6). The data represent the mean± SD. Statistical analysis was performed using an unpaired t test. *P = 0.019, **P = 0.00039. (D) Representative images of TUNEL assay in endoG (endoGMB07150/KO) and double mutant (endoGMB07150/KO; poldip2del) seminal vesicles. The nuDNA breaks/fragmentation was observed in 2-week-old double mutant mature sperm. DAPI (blue) stains the nuDNA of mature sperm. Red: TUNEL signal. Bar, 10 μm. (E) Quantification of CellROX intensity, as a measure of ROS levels in both young and 2-week-old flies with indicated genotypes. (1) endoGMB07150/+; poldip2 del/+. (2) endoGMB07150/+; poldip2 del. (3) endoGMB07150/KO; poldip2 del/+. (4) endoGMB07150/KO; poldip2del. A.U., arbitrary unit. Each data point represents quantification from one seminal vesicle (n = 6). The data represent the mean± SD. Statistical analysis was performed using an unpaired t test. P values from left to right: ***P = 0.000038, ***P = 0.000032, **P = 0.00016, **P = 0.00018.

References

    1. Barratt CL, Kay V, Oxenham SK (2009) The human spermatozoon—a stripped down but refined machine. J Biol 8:63 - PMC - PubMed
    1. Bittrich S, Segura J, Duarte JM, Burley SK, Rose Y (2024) RCSB Protein Data Bank: exploring protein 3D similarities via comprehensive structural alignments. Bioinformatics 40:btae370 - PMC - PubMed
    1. Bogenhagen DF, Rousseau D, Burke S (2008) The layered structure of human mitochondrial DNA nucleoids. J Biol Chem 283:3665–3675 - PubMed
    1. Chen D, McKearin DM (2003) A discrete transcriptional silencer in the bam gene determines asymmetric division of the Drosophila germline stem cell. Development 130:1159–1170 - PubMed
    1. Chen Z, Zhang F, Xu H (2019) Human mitochondrial DNA diseases and Drosophila models. J Genet Genomics 46:201–212 - PubMed

LinkOut - more resources