. 2025 Feb 11;22(1):38.
doi: 10.1186/s12974-025-03359-w.

α-Synuclein orchestrates Th17 responses as antigen and adjuvant in Parkinson's disease

Affiliations

α-Synuclein orchestrates Th17 responses as antigen and adjuvant in Parkinson's disease

Emi Furusawa-Nishii et al. J Neuroinflammation. .

Abstract

Recently, the role of T cells in the pathology of α-synuclein (αS)-mediated neurodegenerative disorders called synucleinopathies, including Parkinson's disease (PD), dementia with Lewy bodies (DLB), and multiple system atrophy, has attracted increasing attention. Although the existence of αS-specific T cells and the immunogenicity of the post-translationally modified αS fragment have been reported in PD and DLB, the key cellular subset associated with disease progression and its induction mechanism remain largely unknown.Peripheral blood mononuclear cells (PBMCs) from synucleinopathy patients and healthy controls were cultured in the presence of the αS peptide pools. Cytokine analysis using culture supernatants revealed that C-terminal αS peptides with a phosphorylated serine 129 residue (pS129), a feature of pathological αS aggregates, promoted the production of IL-17A, IL-17F, IL-22, IFN-γ and IL-13 in PD patients compared with that in controls. In pS129 peptide-reactive PD cases, Ki67 expression was increased in CD4 T cells but not in CD8 T cells, and intracellular cytokine staining assay revealed the existence of pS129 peptide-specific Th1 and Th17 cells. The pS129 peptide-specific Th17 responses, but not Th1 responses, demonstrated a positive correlation with the Movement Disorder Society-Unified Parkinson's Disease Rating Scale (MDS-UPDRS) Part III scores. A similar correlation was observed for IL-17A levels in the culture supernatant of PBMCs from PD patients with disease duration < 10 years. Interestingly, enhanced Th17 responses to pS129 peptides were uniquely found in PD patients among the synucleinopathies, suggesting that Th17 responses are amplified by certain mechanisms in PD patients. To investigate such mechanisms, we analyzed Th17-inducible capacity of αS-exposed dendritic cells (DCs). In vitro stimulation with αS aggregates generated Th17-inducible DCs with IL-6 and IL-23 production through the signaling of TLR4 and spliced X-box binding protein-1 (XBP1s). In fact, the levels of IL-6 and IL-23 in plasma, and the XBP1s ratio in type 2 conventional DCs were increased in PD patients compared with those in controls.Here, we propose the importance of αS-specific Th17 responses in the progression of PD and the underlying mechanisms inducing Th17 responses. These findings may provide novel therapeutic strategies to prevent disease development through the suppression of TLR4-XBP1s-IL-23 signaling in DCs.

Keywords: IL-23; TLR 4; spliced X-box binding protein; synucleinopathy; α-synuclein specific T cells.


Conflict of interest statement

Declarations. Ethics approval and consent to participate: This study was approved by the Ethics Committee of Juntendo University (no. 2021100). Written informed consent was obtained from all participants before enrollment. Consent for publication: Not applicable. Competing interests: Outside of the submitted work, NH received grants from Asahi Kasei Medical Co., Ltd., SNBL, Ltd., FP Corp., and Eisai Co., Ltd.; funds for contract research from Cell Source Co., Ltd., MJFF, and MDS; and reports donations to the department, endowed research departments, and joint collaborative research departments from Sumitomo Pharma Co., Ltd., Otsuka Pharmaceutical, Co., Ltd., Takeda Pharmaceutical Co., Ltd., Kyowa Kirin Co., Ltd., Sunwels Co., Ltd., Eisai Co., Ltd., Nihon Medi-physics Co., Ltd., Abbott Japan LLC, AbbVie GK, Medtronic, Inc., Boston Scientific Japan K.K., Ono Pharmaceutical Co., Ltd., Mitsubishi Tanabe Pharma Co., Zebra Co., Ltd., Kowa Co., Ltd., Parkinson Laboratories Co., Ltd., and Ohara Pharmaceutical Co., Ltd.

Figures

Fig. 1
Fig. 1
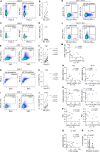
Stimulation with C-terminal α-synuclein peptides with phosphorylated 129 serine residue increases T cell-related cytokine production in PD patients. PBMCs from PD patients and age-matched controls were cultured for 7 days in the presence or absence of α-synuclein (αS) peptide pools [controls: n = 15, PD: n = 33 for S129 p( +) peptides, controls: n = 15, PD: n = 31 for other αS peptides]. Clinical information is shown in Supplementary Table 1. IL-17A, IL-17F, IL-22, IFN-γ, and IL-13 concentrations in the culture supernatant were measured. The fold change in cytokine production upon αS peptide stimulation was calculated relative to cytokine production in medium alone. (A) The fold change in cytokine production by the indicated αS peptide stimulation. The line represents the median. (B) Comparison between aa116–140 S129 p( −) peptide stimulation and aa116–140 S129 p( +) peptide stimulation (PD: n = 31). HC, healthy control; p( −), without phosphorylation; p( +), with phosphorylation. Each dot indicates the value of one individual. *p < 0.05, **p < 0.01, ***p < 0.001, ****p < 0.0001. P-values were determined by the Mann–Whitney U-test (A), or the Wilcoxon matched-pairs signed-rank test (B)
Fig. 2
Fig. 2
Evaluation of pS129 αS peptide-specific T cells in PD patients. PBMCs from PD patients were cultured in the presence or absence of C-terminal pS129 peptides (Supplementary Table 2). (AD) PBMCs (n = 6) cultured for 7 days were subjected to Ki67 staining assay. Gating strategies are shown in Supplementary Fig. 3A. Representative dot plots and Ki67+ ratio in CD8 T cells (A, B) or CD4 T cells (C, D) are shown. (EJ) PBMCs (n = 14) cultured for 14 days were subjected to intracellular cytokine staining assay. Gating strategies are shown in Supplementary Fig. 5. Representative dot plots and ratios of IFN-γ-expressing CD4 T cells (E, F), IL-4-expressing CD4 T cells (G, H), and IL-17A-expressing CD4 T cells (I, J) are shown. In graphs (F), (H), and (J), solid lines indicate differences in cytokine expression ≥ 0.1% between pS129 peptide stimulation and no stimulation. Dotted lines indicate < 0.1%. (KP) Intracellular cytokine staining data (n = 14) were analyzed. Representative dot plots of IL-17A and IFN-γ expression in CD4 T cells from a Th1 > Th17 patient (K) or a Th17 > Th1 patient (L) are shown. (M, P) The ratio of IFN-γ- or IL-17A-expressing CD4 T cells after pS129 peptide stimulation minus the ratio under unstimulated conditions (Δ) was calculated. Then, the indicated correlation was evaluated. (Q, R) The pS129 peptide-mediated fold change of IL-17A levels in culture supernatant of PBMCs from PD patients (n = 33) was analyzed. These data sets were from Fig. 1. The correlation of IL-17A fold change in PD with disease duration ≤ 10 years and MDS-UPDRS Part III scores is shown in (Q) (n = 21). The difference of IL-17A fold change between patients with disease duration ≤ 10 years (n = 21) and ≥ 11 years (n = 12) is shown in (R). No, no stimulation; p( +), pS129 peptides. Each dot indicates the value of one individual. *p < 0.05, **p < 0.01, ***p < 0.001, ****p < 0.0001. P-values were determined by the Wilcoxon matched-pairs signed-rank test (B, D), or the Mann–Whitney U-test (R). Correlations were analyzed using Spearman’s correlation analysis (MQ)
Fig. 3
Fig. 3
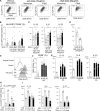
Functional alterations of α-synuclein-stimulated DCs. Monocyte-derived DCs (mDCs) generated from healthy subjects (Table 1) were used for the following assays. (AD) mDCs were cultured in the presence or absence of the indicated concentrations of αS monomers or fibrils for 24 h. (A, B) The HLA-DRhighCD86+ ratio in CD209+ mDCs was analyzed. Gating strategies are shown in Supplementary Fig. 7. A representative contour plot is shown in (A) and the HLA-DRhighCD86+ ratio in CD209+ mDCs (n = 8) is shown in (B). (C, D) IL-1β, IL-6, and IL-23 concentrations in culture supernatants stimulated as indicated (n = 8) are shown in (C) and a comparison of IL-23 and IL-12 levels after high-dose αS fibril stimulation (n = 8) is shown in (D). (EG) mDCs (n = 4) were cultured for 48 h in the presence of 1000-fold diluted αS seeds. Three αS seeds derived from PD patients (#1–#3) and one control product derived from a healthy donor (control) were used for stimulation. (E, F) CD86 expression in CD209+ mDCs was analyzed. A representative histogram is shown in (E) and the CD86+ ratio in CD209+ mDCs is shown in (F). (G) IL-1β, IL-6, and IL-23 concentrations in culture supernatants were measured. (H, I) mDCs were treated with a TLR4 inhibitor, TAK-242 (60 µM), or control vehicle for 2 h prior to 24 h stimulation with high-dose (50 µg/ml) αS fibrils (n = 6) or LPS (n = 4–5). The HLA-DRhighCD86+ ratio in CD209+ mDCs is shown in (H), and IL-1β, IL-6, and IL-23 concentrations in culture supernatants are shown in (I). stimu, stimulation; mono, monomer; TAK, TAK-242. Each dot indicates the value of one individual. Data represent the mean ± SD (B–D, F–I). *p < 0.05, **p < 0.01, ***p < 0.001, ****p < 0.0001. P-values were determined by the Friedman test (B, C, F, G) or Wilcoxon’s matched-pairs signed-rank test (D, H, I)
Fig. 4
Fig. 4
XBP-1s expression in α-synuclein-stimulated DCs. (A, B) mDCs generated from healthy subjects (Table 1) were cultured in the presence or absence of high-dose (50 µg/ml) αS monomers or fibrils for 24 h. XBP-1s expression in CD209+ mDCs was analyzed. Gating strategies are shown in Supplementary Fig. 7. A representative histogram is shown in (A) and the XBP-1 s+ ratio in CD209+ mDCs (n = 7) is shown in (B). (C) Cryopreserved PBMCs from PD patients (n = 8) and age-matched controls (n = 5) were subjected to flow cytometric analysis (Supplementary Table 4). Gating strategies are shown in Supplementary Fig. 12. The XBP-1 s+ ratio in CD1c+ type 2 conventional DCs (cDC2s) is shown. (DG) mDCs generated from healthy subjects (Table 1, n = 6) were treated with a TLR4 inhibitor, TAK-242 (60 µM) (D, E), or an IRE1-XBP-1s inhibitor, STF-083010 (120 µM) (F, G), for 2 h prior to 24 h stimulation with high-dose (50 µg/ml) αS fibrils. Vehicle containing the same concentration of DMSO was used as a control. (DF) XBP-1s expression in CD209+ mDCs was analyzed. A representative histogram is shown in (D), and the XBP-1s+ ratio in CD209+ mDCs is shown in (E, F). (G) IL-6 and IL-23 concentrations in the culture supernatants were measured. mono, monomer; TAK, TAK-242; STF, STF-083010; XBP-1s, spliced X-box binding protein-1. Each dot indicates the value of one individual. Data represent the mean ± SD. *p < 0.05, **p < 0.01, ***p < 0.001, ****p < 0.0001. P-values were determined by the Friedman test (B), the Mann–Whitney U-test (C), or Wilcoxon’s matched-pairs signed-rank test (EG)
Fig. 5
Fig. 5
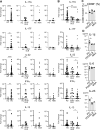
Differential responses to C-terminal phosphorylated S129 peptides among synucleinopathies. (A, B) PBMCs from patients or controls were cultured in the presence or absence of C-terminal phosphorylated S129 peptide pools (aa116–140) for 7 days. PBMCs were isolated from the following participants: PD (n = 33), dementia with Lewy bodies or PD with dementia (PDD/DLB, n = 8), multiple system atrophy (MSA, n = 28), rapid eye movement sleep disorder (RBD, n = 16), and healthy controls (n = 15). The data sets of PD and HC were from Fig. 1. The indicated cytokine concentrations in the culture supernatants were measured, and the fold change was calculated. Each dot indicates the value of one individual. The line represents the median. (A) Comparisons between patients and age-matched controls. The following numbers of age-matched controls were used: vs. PD: n = 15, vs. PDD/DLB: n = 5, vs. MSA: n = 15, and vs. RBD: n = 8 (Supplementary Tables 1, 5–7). (B) Comparisons between PD, PDD/DLB, and MSA. (C, D) mDCs derived from healthy donors (n = 3) were cultured in the presence of 1000-fold diluted αS seeds for 48 h. Individual values are shown in Supplementary Fig. 16. The representative value of each seed was determined by averaging values obtained from three donor-derived mDCs. Comparisons were conducted between PD seeds (#1–#3), PDD/DLB seeds (#1–#3), and MSA seeds (#1–#3). The CD86+ ratio in CD209+ mDCs is shown in (C). IL-1β, IL-6, and IL-23 concentrations in culture supernatants are shown in (D). Data represent the mean ± SD. HC, healthy control. *p < 0.05, **p < 0.01, ***p < 0.001, ****p < 0.0001. P-values were determined by the Mann–Whitney U-test, in (A) and the Kruskal–Wallis test in (BD)

References

    1. Zhang W, Xiao D, Mao Q, Xia H. Role of neuroinflammation in neurodegeneration development. Signal Transduct Target Ther. 2023;8(1):267. 10.1038/s41392-023-01486-5. - PMC - PubMed
    1. Kempuraj D, Thangavel R, Natteru PA, et al. Neuroinflammation induces neurodegeneration. J Neurol Neurosurg Spine. 2016;1(1):1003. - PMC - PubMed
    1. Kwon HS, Koh S-H. Neuroinflammation in neurodegenerative disorders: the roles of microglia and astrocytes. Transl Neurodegener. 2020;9(1):42. 10.1186/s40035-020-00221-2. - PMC - PubMed
    1. Brochard V, Combadière B, Prigent A, et al. Infiltration of CD4+ lymphocytes into the brain contributes to neurodegeneration in a mouse model of Parkinson disease. J Clin Invest. 2009;119(1):182–92. 10.1172/jci36470. - PMC - PubMed
    1. McGeer PL, Itagaki S, Akiyama H, McGeer EG. Rate of cell death in parkinsonism indicates active neuropathological process. Ann Neurol. 1988;24(4):574–6. 10.1002/ana.410240415. - PubMed