. 2025 Feb 11;13(1):26.
doi: 10.1186/s40478-025-01943-y.

Small molecule treatment alleviates photoreceptor cilia defects in LCA5-deficient human retinal organoids

Affiliations

Small molecule treatment alleviates photoreceptor cilia defects in LCA5-deficient human retinal organoids

Dimitra Athanasiou et al. Acta Neuropathol Commun. .

Erratum in

Abstract

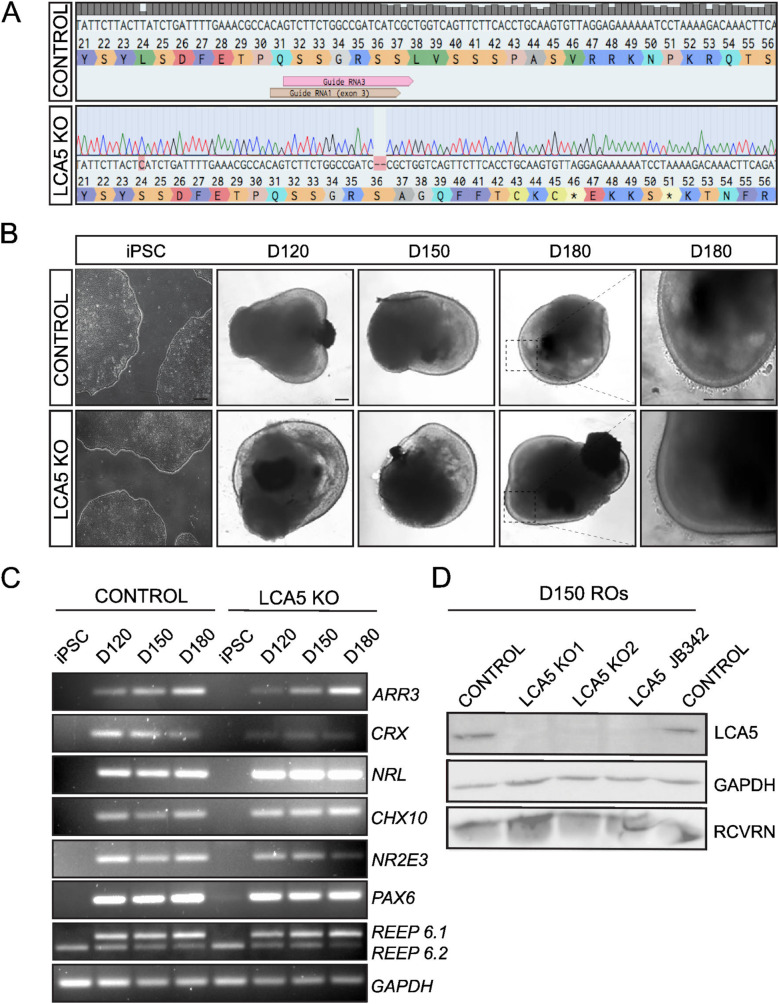
Bialleleic pathogenic variants in LCA5 cause one of the most severe forms of Leber congenital amaurosis, an early-onset retinal disease that results in severe visual impairment. Here, we report the use of gene editing to generate isogenic LCA5 knock-out (LCA5 KO) induced pluripotent stem cells (iPSC) and their differentiation to retinal organoids. The molecular and cellular phenotype of the LCA5 KO retinal organoids was studied in detail and compared to isogenic controls as well as patient-derived retinal organoids. The absence of LCA5 was confirmed in retinal organoids by immunohistochemistry and western blotting. There were no major changes in retinal organoid differentiation or ciliation, however, the localisation of CEP290 and IFT88 was significantly altered in LCA5 KO and patient photoreceptor cilia with extension along the axoneme. The LCA5-deficient organoids also had shorter outer segments and rhodopsin was mislocalised to the outer nuclear layer. We also identified transcriptomic and proteomic changes associated with the loss of LCA5. Importantly, treatment with the small molecules eupatilin, fasudil or a combination of both drugs reduced CEP290 and IFT88 accumulation along the cilia. The treatments also improved rhodopsin traffic to the outer segment and reduced mislocalisation of rhodopsin in the outer nuclear layer (ONL). The improvements in cilia-associated protein localisation and traffic were accompanied by significant changes in the transcriptome towards control gene expression levels in many of the differentially expressed genes. In summary, iPSC-derived retinal organoids are a powerful model for investigating the molecular and cellular changes associated with loss of LCA5 function and highlight the therapeutic potential of small molecules to treat retinal ciliopathies.

Keywords: Cilia; Gene editing; LCA; LCA5; Organoid; Photoreceptor; Retina; Retinal dystrophy; Stem cell; Therapy.


Conflict of interest statement

Declarations. Ethics approval and consent to participate: The control and JB342 patient iPSC lines used in this study are established lines that have been published previously and were obtained with appropriate consent and ethical approval. Consent for publication: Not applicable. Competing interests: The authors declare no competing interests.

Figures

Fig. 1
Fig. 1
Generation of LCA5 KO and isogenic control iPSCs and differentiation to retinal organoids. A) Sanger sequence trace of LCA5 KO iPSC (LCA5 KO1) showing a 2-bp deletion in exon 3 of LCA5 gene generated by CRISPR/Cas9 and NHEJ gene editing. B) Bright-field images of iPSC-derived LCA5 KO and isogenic control retinal organoids at D120, D150 and D180 of retinal development. Inset boxes showing the development of photoreceptor brush borders which start to emerge at D180. Scale bars 250 μm. C) RT-PCR of isogenic control and LCA5 KO iPSC and retinal organoids (n = 2 per condition from one differentiation) at D120, D150 and D180 for retinal differentiation markers ARR3, CRX, NRL, CHX10, NR2E3, PAX6, REEP6.1 (upper band), REEP6.2 (lower band). GAPDH was used as a reference transcript. D) Western blot of control, LCA5 KO (KO1 and KO2) and LCA5 JB342 patient retinal organoids at D150 showing successful knockdown of LCA5 protein. Recoverin (RCVRN) was used as a photoreceptor-specific marker and GAPDH as a loading control. Results are from pooling together n = 3 retinal organoids per condition from two differentiations per line
Fig. 2
Fig. 2
Loss of LCA5 causes a distinctive ciliary phenotype in LCA5 KO retinal organoids. Representative images of isogenic control and LCA5 KO unfixed retinal organoids at D200, as indicated, stained for A) LCA5 (magenta) and the basal body marker PCN (yellow) B) LCA5 (magenta) and axoneme marker Arl13b (yellow) C) CEP290 (magenta) and Arl13b (yellow); D) IFT88 (magenta) and PCN (yellow). DAPI was used as nuclear staining marker (cyan). Scale bars 10 μm. Inset boxes show cilia at higher magnification. Scale bar 5 μm
Fig. 3
Fig. 3
Significant accumulation of CEP290 and IFT88 in LCA5-deficient retinal organoids. (A) Representative images of control, LCA5 KO and LCA5 JB342 unfixed retinal organoids (ROs) at D200 stained for CEP290 (magenta) and the basal body marker PCN (yellow). DAPI was used as nuclear staining marker (cyan); Scale bars 10 μm. Inset boxes show cilia at higher magnification; Scale bar 5 μm. (B) Box and whisker plots represents quantification of CEP290 distance (µm) from the basal body. Control n = 4 ROs (460 cilia), LCA5 KO n = 5 ROs (196 cilia), LCA5 JB342 n = 3 ROs (287 cilia). LCA5 KO ROs are from two different lines. All ROs are from two differentiations and were treated with DMSO (vehicle). Error bars represent mean ± SD, one-way ANOVA, Kruskal-Wallis test, ****p < 0.0001. C) Representative images of control, LCA5 KO and LCA5 JB342 unfixed retinal organoids at D200 stained for IFT88 (magenta) and the basal body marker PCN (yellow). DAPI was used as nuclear staining marker (cyan); Scale bars 10 μm. Inset boxes show cilia at higher magnification; Scale bar 5 μm. D) Box and whiskers plot represents quantification of IFT88 distance (µm) from the basal body. Control n = 3 ROs (457 cilia), LCA5 KO n = 5 ROs (329 cilia), LCA5 JB342 n = 3 ROs (260 cilia). LCA5 KO ROs are from two different lines. All ROs are from two differentiations and were treated with DMSO (vehicle). Error bars represent mean ± SD, one-way ANOVA, Kruskal-Wallis test, ****p < 0.0001
Fig. 4
Fig. 4
Significant rhodopsin retention in the ONL and shorter OS in LCA5-deficient ROs. (A) Bright field images of isogenic control, LCA5 KO and LCA5 JB342 mature retinal organoids (ROs) at D200. Magnified images show retinal morphology and the layers of OS (with the distinctive brush borders), IS and ONL. Scale bars 100 μm. (B) Representative images of Control, LCA5 KO and LCA5 JB342 ROs at D220 stained with the photoreceptor OS and IS marker WGA (magenta). DAPI was used as nuclear staining marker (cyan). Scale bar 50 μm. (C) Quantification of WGA extracellular matrix OS length of control, LCA5 KO and LCA5 JB342 ROs at D220. Control n = 5 ROs (31 images), LCA5 KO n = 8 ROs (54 images), LCA5 JB342 n = 3 ROs (15 images). LCA5 KO ROs from two different lines. All ROs are from two differentiations and were treated with DMSO (vehicle). One-way ANOVA, Kruskal-Wallis test, **p < 0.01, ****p < 0.0001. (D) Representative images of unfixed control, LCA5 KO and LCA5 JB342 retinal organoids at D220 stained with rhodopsin. Dashed lines mark the ONL. Scale bars 50 μm. (E) Quantification of rhodopsin immunofluorescence intensity (Integrated density) in photoreceptor OS relative to the intensity in the ONL. Graph represents average OS/ONL integrated density of images taken from the whole section of each retinal organoid. Control n = 5 ROs (33 images), LCA5 KO n = 8 ROs (68 images), LCA5 JB342 n = 3 ROs (15 images). LCA5 KO ROs are from two different lines. All ROs are from two differentiations and were treated with DMSO (vehicle). Error bars represent mean ± SD, one-way ANOVA, Kruskal-Wallis test, ****p < 0.0001
Fig. 5
Fig. 5
Eupatilin and fasudil reduce CEP290 and IFT88 accumulation along the cilium. (A, C) Representative images of unfixed LCA5 KO retinal organoids (ROs) (A) or unfixed LCA5 JB342 patient ROs (C) at D220 treated with vehicle (DMSO), eupatilin (10 µM), fasudil (5 µM) or eupatilin (10 µM) and fasudil (5 µM) (FAS/EUP) for 30 days (from D190) and stained for CEP290 (magenda) and PCN (yellow). DAPI was used as nuclear staining marker (cyan); Scale bars 10 μm. Inset boxes show cilia at higher magnification; Scale bar 5 μm. (B, D) Graph represents average CEP290 distance (µm) from the basal body. (B) Control vehicle n = 4 ROs (460 cilia), LCA5 KO vehicle n = 5 ROs (196 cilia), LCA5 KO + 10 µM EUP n = 4 ROs (172 cilia), LCA5 KO + 5 µM FAS n = 4 ROs (191 cilia), LCA5 KO + FAS/EUP n = 4 ROs (113 cilia). LCA5 KO organoids are from two different lines. D) Control vehicle n = 4 ROs (460 cilia), LCA5 JB342 vehicle n = 3 ROs (284 cilia), LCA5 JB342 + 10 µM EUP n = 2 ROs (137 cilia), LCA5 JB342 + 5 µM FAS n = 2 ROs (149 cilia), LCA5 JB342 + FAS/EUP n = 2 ROs (179 cilia). (B, D) All ROs are from two differentiations. One-way ANOVA, Kruskal-Wallis test, **p < 0.01, ***p < 0.001, ****p < 0.0001. (E, G) Representative images of unfixed LCA5 KO ROs (E) or unfixed LCA5 JB342 patient ROs (G) at D220 treated with vehicle (DMSO), eupatilin (10 µM), fasudil (5 µM) or eupatilin (10 µM) and fasudil (5 µM) (FAS/EUP) for 30 days (from D190) and stained for IFT88 (magenta) and PCN (yellow). DAPI was used as nuclear staining marker (cyan); Scale bars 10 μm. Inset boxes show cilia at higher magnification; Scale bar 5 μm. (F, H) Graph represents average IFT88 distance (µm) from the basal body. (F) Control vehicle n = 3 ROs (457 cilia), LCA5 KO vehicle n = 4 ROs (329 cilia), LCA5 KO + 10 µM EUP n = 4 ROs (605 cilia), LCA5 KO + 5 µM FAS n = 4 ROs (576 cilia), LCA5 KO + FAS/EUP n = 4 ROs (557 cilia). LCA5 KO organoids are from two different lines. H) Control vehicle n = 4 ROs (460 cilia), LCA5 JB342 vehicle n = 3 ROs (260 cilia), LCA5 JB342 + 10 µM EUP n = 2 ROs (239 cilia), LCA5 JB342 + 5 µM FAS n = 2 ROs (140 cilia), LCA5 JB342 + FAS/EUP n = 2 ROs (192 cilia). (F, H) All ROs are from two differentiations. Error bars represent mean ± SD, one-way ANOVA, Kruskal-Wallis test, **p < 0.01, ***p < 0.001, ****p < 0.0001
Fig. 6
Fig. 6
Eupatilin and fasudil can enhance rhodopsin traffic to the OS. (A) Representative images of LCA5 KO retinal organoids (ROs) at D220 treated with vehicle (DMSO), eupatilin (10 µM), fasudil (5 µM) or eupatilin (10 µM) and fasudil (5 µM) (Fas/Eup) for 30 days (from D190) and stained for rhodopsin. Dashed lines mark the ONL. Scale bars 50 μm. (B) Quantification of rhodopsin immunofluorescence intensity (Integrated density) in photoreceptor OS relative to the intensity in the ONL. Graph represents average OS/ONL integrated density. Control vehicle n = 5 ROs (33 images), LCA5 KO vehicle n = 8 ROs (68 images), LCA5 KO + 10 µM EUP n = 4 ROs (27 images), LCA5 KO + 5 µM FAS n = 4 ROs (28 images), LCA5 KO + FAS/EUP n = 4 ROs (26 images). LCA5 KO ROs are from the two different lines. All ROs are from two differentiations. Error bars represent mean ± SD, one-way ANOVA, Kruskal-Wallis test, *p < 0.05, **p < 0.01.****p < 0.0001. (C) Quantification of WGA extracellular matrix OS length of vehicle and treated LCA5 KO ROs. Control vehicle n = 5 ROs (31 images), LCA5 KO vehicle n = 8 ROs (54 images), LCA5 KO + 10 µM EUP n = 4 ROs (27 images), LCA5 KO + 5 µM FAS n = 4 ROs (28 images), LCA5 KO + FAS/EUP n = 4 ROs (26 images). LCA5 KO ROs are from two different lines and two differentiations per line. Error bars represent mean ± SD, one-way ANOVA, Kruskal-Wallis test, *p < 0.05, **p < 0.01, ****p < 0.0001. (D) Representative images of LCA5 JB342 ROs at D220 treated with vehicle, eupatilin (10 µM), fasudil (5 µM) or eupatilin (10 µM) and fasudil (5 µM) (FAS/EUP) for 30 days (from D190) and stained for rhodopsin. Dashed lines mark the ONL. Scale bar 50 μm. (E) Quantification of rhodopsin immunofluorescence intensity (Integrated density) in photoreceptor OS relative to the intensity in the ONL. Graph represents average OS/ONL integrated density. Control vehicle n = 5 ROs (33 images), LCA5 JB342 vehicle n = 3 ROs (15 images), LCA5 JB342 + 10 µM EUP n = 2 ROs (16 images), LCA5 KO + 5 µM FAS n = 2 ROs (12 images), LCA5 KO + FAS/EUP n = 2 ROs (11 images). LCA5 JB342 ROs are from two different lines. All ROs are from two differentiations. Error bars represent mean ± SD, one-way ANOVA, Kruskal-Wallis test, *p < 0.05, ****p < 0.0001. (F) Quantification of WGA extracellular matrix OS length of vehicle and treated LCA5 JB342 retinal organoids. Control vehicle n = 5 ROs (31 images), LCA5 JB342 vehicle n = 3 ROs (15 images), LCA5 JB342 + 10 µM EUP n = 2 ROs (16 images), LCA5 KO + 5 µM FAS n = 2 ROs (11 images), LCA5 KO + FAS/EUP n = 2 ROs (12 images). LCA5 JB342 ROs are from two different lines. All ROs are from two differentiations. Error bars represent mean ± SD, one-way ANOVA, Kruskal-Wallis test, ***p < 0.001
Fig. 7
Fig. 7
Transcriptomic and proteomic changes in LCA5 retinal organoids. (A-D) Transcript changes in LCA5 KO retinal organoids (ROs) compared to isogenic control (WT) ROs. (A-C) Volcano plots showing the significant DE genes in (A)WT to LCA5 KO D200 ROs, (B) eupatilin treated, and (C) fasudil treated ROs compared to WT following removal of vehicle-associated changes, significant genes highlighted in red. (D) Heatmap of top 50 DE genes from WT vs. LCA5 KO and their expression in treated organoids, * indicates changes that are significantly different to untreated comparisons. (F-G) Proteomic analyses of LCA5 ROs. Comparison of DE proteins between WT and LCA5 KO (E) and WT and LCA5 JB342 (F). (G) Correlation of DE proteins between control and LCA5 KO (y-axis) and LCA5 JB342 (x-axis), significantly DE proteins highlighted in green

References

    1. den Hollander AI, Roepman R, Koenekoop RK, Cremers FPM (2008) Leber congenital amaurosis: genes, proteins and disease mechanisms. Prog Retin Eye Res 27:391–419. 10.1016/j.preteyeres.2008.05.003 - PubMed
    1. Kumaran N, Moore AT, Weleber RG, Michaelides M (2017) Leber congenital amaurosis/early-onset severe retinal dystrophy: clinical features, molecular genetics and therapeutic interventions. Br J Ophthalmol 101:1147–1154. 10.1136/bjophthalmol-2016-309975 - PMC - PubMed
    1. Kumaran N, Pennesi ME, Yang P, Trzupek KM, Schlechter C, Moore AT, Weleber RG, Michaelides M (1993) Leber Congenital Amaurosis / early-onset severe retinal dystrophy overview. In: Adam MP, Feldman J, Mirzaa GM, Pagon RA, Wallace SE, Amemiya A (eds) GeneReviews®. University of Washington, Seattle, Seattle (WA) - PubMed
    1. Huang C-H, Yang C-M, Yang C-H, Hou Y-C, Chen T-C (2021) Leber’s congenital amaurosis: current concepts of genotype-phenotype correlations. Genes 12:1261. 10.3390/genes12081261 - PMC - PubMed
    1. Kondkar AA, Abu-Amero KK (2019) Leber congenital amaurosis: current genetic basis, scope for genetic testing and personalized medicine. Exp Eye Res 189:107834. 10.1016/j.exer.2019.107834 - PubMed

Publication types

MeSH terms

LinkOut - more resources