. 2025 May;292(9):2306-2322.
doi: 10.1111/febs.70002. Epub 2025 Feb 11.

Intercellular mitochondrial transfer contributes to microenvironmental redirection of cancer cell fate

Affiliations

Intercellular mitochondrial transfer contributes to microenvironmental redirection of cancer cell fate

Julie Sofie Bjerring et al. FEBS J. 2025 May.

Abstract

The mammary microenvironment has been shown to suppress tumor progression by redirecting cancer cells to adopt a normal mammary epithelial progenitor fate in vivo. However, the mechanism(s) by which this alteration occurs has yet to be defined. Here, we test the hypothesis that mitochondrial transfer from normal mammary epithelial cells to breast cancer cells plays a role in this redirection process. We evaluate mitochondrial transfer in 2D and 3D organoids using our unique 3D bioprinting system to produce chimeric organoids containing normal and cancer cells. We demonstrate that breast cancer tumoroid growth is hindered following interaction with mammary epithelial cells in both 2D and 3D environments. Furthermore, we show mitochondrial transfer occurs between donor mammary epithelial cells and recipient cancer cells primarily through tunneling nanotubes (TNTs) with minimal amounts seen from extracellular transfer of mitochondria, likely via extracellular vesicles (EVs). This organelle exchange results in various cellular and metabolic alterations within cancer cells, reducing their proliferative potential, and making them susceptible to microenvironmental control. Our results demonstrate that mitochondrial transfer contributes to microenvironmental redirection of cancer cells through alteration of metabolic and molecular functions of the recipient cancer cells. To the best of our knowledge, this is the first description of a 3D bioprinter-assisted organoid system for studying mitochondrial transfer. These studies are also the first mechanistic insights into the process of mammary microenvironmental redirection of cancer and provide a framework for new therapeutic strategies to control cancer.

Keywords: 3D bioprinting; breast cancer; cellular redirection; microenvironment; mitochondrial transfer.


Conflict of interest statement

The authors declare that the research was conducted in the absence of any commercial or financial relationships that could be construed as a potential conflict of interest.

Figures

Fig. 1
Fig. 1
3D bioprinter. (A) Image of laboratory low‐cost 3D bioprinter setup. (B, C) Visual representation of instructional GCODE for printing procedure of 10 wells (B) and a singular well (C) in 3D hydrogels.
Fig. 2
Fig. 2
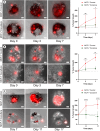
Tumoroid growth of MCF‐7 mammary cancer cells following interaction with MCF‐12a cells. (A) MCF‐7 RFP cells were cocultured with unlabeled MCF‐12a cells or unlabeled MCF‐7 cells (controls). The MCF‐12a and MCF‐7 cells were killed off by 48‐h puromycin selection treatment. Surviving MCF‐7 RFP cells were bioprinted into rat tail collagen hydrogels. Left: Representative image of 3D printed MCF‐7 (red) mammary tumoroids on days 0, 3, and 7 after initial 7‐day tumoroid formation. Right: Graph of the mean percentage of tumoroid growth demonstrating significant decrease in growth rate when MCF‐7 cells are isolated from MCF‐12a cocultures (*P < 0.05; n = 11). (B) MCF‐7 RFP cells were 3D printed with MCF‐12a cells or unlabeled MCF‐7 cells (control) in rat tail collagen. Organoids/tumoroids formed over a 7‐day period followed by an additional 7 days of puromycin treatment. Left: Representative images captured on day 0, 3, and 7 postpuromycin treatment. Right: Graph of the mean percentage of tumoroid formation demonstrating significant decrease in growth rate following 3D coculture with MCF‐12a cells (**P < 0.01; n = 11). (C) MCF‐7 RFP cells were cocultured with MCF‐12a cells or unlabeled MCF‐7 cells (controls) and then isolated by fluorescence‐activated cell sorting (FACS) and 3D printed into rat tail collagen hydrogels. Left: Representative images of tumoroids captured on day 7, 11, and 17 postprint. Right: Graph of the mean percentage of tumoroid growth demonstrating significant decrease in tumoroid growth rate when MCF‐7 cells are isolated from MCF‐12a cocultures (****P < 0.0001; n = 10). All statistical data were analyzed using a two‐way analysis of variance (ANOVA) with a Tukey multiple comparison test. Error bars represent standard deviation (SD). Scale bars = 20 μm.
Fig. 3
Fig. 3
Cell proliferation of MCF‐7 mammary cancer cells decreases following interactions with MCF‐12a cells. (A, B) Immunofluorescence staining of Ki67 (blue) on control MCF‐7 RFP cells (red) (A), and cocultured MCF‐12a‐Mito‐GFP (green) and MCF‐7 RFP (red) (B). (C) Quantification of the mean fluorescent intensity of Ki67 comparing MCF‐7 control (n = 55) and MCF‐12a/MCF‐7 coculture populations (n = 40) (****P < 0.0001). (D, E) Annexin V Conjugates for apoptosis analysis displaying green (apoptotic) and red (live) cells from MCF‐7/MCF‐7 RFP (control) (A) and MCF‐12a/MCF‐7 RFP cocultures. (F) Quantification of the mean percent of live (*P = 0.0429) and apoptotic cells (*P = 0.0353) (n = 540) in control MCF‐7/MCF‐7 RFP and MCF‐12a/MCF‐7 RFP cocultures. Error bars display standard deviation (SD) of the mean. All statistical data were analyzed using an unpaired t‐test. Scale bars = 20 μm.
Fig. 4
Fig. 4
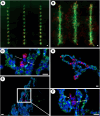
Mitochondrial transfer within 3D bioprinted chimeric organoids. (A, B) Example of 3D printed chimeric organoid in rat tail collagen containing 100 cells per injection in a 5:1 ratio of MCF‐12a‐Mito‐GFP (green) and MCF‐7 RFP (red) cells printed in a three column (1.5 mm), 12 row (300 μm) formation at day 1 (A), and day 10 (B). (C) Immunofluorescence staining of a 5 μm cross‐section of bioprinted chimera. White arrows showing MCF‐12a‐derived mitochondria integrated into MCF‐7 RFP cells. Figure representative of 45 cells from 8 slides obtained over 5 independent experiments. (D, E) Immunofluorescence staining of 5 μm cross‐section of bioprinted chimeras showing MCF‐12a Mito‐GFP‐mammary epithelial and MCF‐7 RFP cancer cells forming integrated luminal organoids mimicking in vivo mammary structures. Figure representative of (D) 98 cells (E) 567 cells from 8 slides obtained over 5 independent experiments. (F) Centralized image of (E) using white arrows to show immunofluorescence staining of 5 μm cross‐section of bioprinted chimera showing MCF‐12a‐derived mitochondria integrated into MCF‐7 RFP (red) cells. Figure representative of 68 cells from 8 slides obtained over 5 independent experiments. All sections are counterstained with DAPI (blue). All samples were analyzed 10‐day postprint. Scale bars: a, b = 100 μm; c–f = 20 μm.
Fig. 5
Fig. 5
Mitochondrial transfer from epithelial to cancer cells in 2D. (A, B) Human mammary epithelial MCF‐12a‐Mito‐GFP derived mitochondria (green) integrated into MCF‐7 RFP (A) and MDA‐MB‐231 RFP (B) cells when cocultured in a 2:1 ratio. Figure representative of 25 cells (A) and 88 cells (B) obtained from 15 (A) and 3 (B) independent experiments. (C) Mouse mammary epithelial EpH4 Mito‐GFP derived mitochondria (green) integrated into mouse MMTV‐neu RFP cancer cells when cocultured in a 2:1 ratio. Figure representative of 75 cells obtained from 3 independent experiments. White arrows showing GFP‐labeled mitochondrial (green) integrated into RFP‐labeled (red) recipient cell types. Scale bars = 20 μm.
Fig. 6
Fig. 6
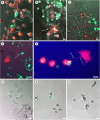
Mitochondria are transferred from MCF‐12a to cancer cells by tunneling nanotubes and extracellular vesicles (A, B) White arrows showing example of tunneling nanotube formation between MCF‐12a Mito‐GFP (green) and MCF‐7 RFP (red) cells in 2D (A) and 3D (B) microenvironments. Images captured 24 h postinitial coculturing. Figure representative of 38 cells (A) and 29 cells (B) obtained from 15 (A) and 4 (B) independent experiments. (C) White arrows showing example of tunneling nanotube formation between mitochondrial‐labeled EpH4 Mito‐GFP (green) and MMTV‐neu RFP (red) cells in 2D coculture. Image captured 48 h post initial coculturing. Figure representative of 72 cells obtained from 3 independent experiments. (D) White arrow showing example of tunneling nanotube formation between MCF‐12a Mito‐GFP and MDA‐MB‐231 RFP (red) cells in 2D culture. Image captured 72 h after initial coculturing. Figure representative of 57 cells obtained from 3 independent experiments (E) Image of phalloidin staining of 2D formalin‐fixed culture. White arrows showing F‐actin (red) tunnel formation between MCF‐7 BFP (blue) and MCF‐12a‐Mito‐GFP (green). Figure representative of 6 cells obtained from 2 independent experiments. (F–H) MCF‐7 (F), MMTV‐neu (G), and MDA‐MB‐231 (H) cells were treated with filtered conditioned medium from MCF‐12a Mito‐GFP (F, H) and EpH4 Mito‐GFP (G) cultured cells. White arrows showing GFP‐labeled (green) mitochondria integrated in recipient cells. Figure representative of 48 cells (F) 7 cells(G) 13 cells (H) obtained from 6 (F) 3 (G, H) independent experiments. Scale bar = 20 μm.
Fig. 7
Fig. 7
Indirect transfer of mitochondria from MCF‐12a cells to cancer cells, likely mediated by EVs. (A) 20× fluorescent image. White arrows indicating RFP‐labeled extracellular vesicles isolated from MCF‐12a Mito‐GFP media. (B) 20× fluorescent image. White arrows indicating integrated RFP‐labeled EV and GFP mitochondrial transfer in recipient MCF‐7 cell. (C) Quantification of the mean quantity of DiI‐RFP EVs detected in recipient MCF‐7 cells with and without addition of 10 μm of ROCK inhibitor (***P < 0.001; n = 1024) (D) Quantification of the mean quantity of GFP mitochondrial transfer detected in recipient MCF‐7 cells with and without addition of 10 μm of ROCK inhibitor (***P < 0.001; n = 1024). Error bars display standard deviation (SD) of the mean. All statistical data were analyzed using an unpaired t‐test. Scale bar = 20 μm.
Fig. 8
Fig. 8
Mitochondrial transfer causes metabolic changes in mammary cancer cells. (A, B) Representative image (left) and fluorescence quantification (right) of 2D MCF‐7‐BFP (blue) (A) and MDA‐MB‐231‐BFP (blue) (B) from control and MCF‐12a Mito‐GFP cocultures live stained with ATPBiotracker Red‐1 (red). Figure representative of 11 cells (control) 10 cells (coculture) (A) and 3 cells (control) 39 cells (coculture) (B) obtained from 3 independent experiments. (C) Quantification of the mean fluorescent intensity of ATP production in 3D bioprinted cultures comparing MCF‐7 control and MCF‐12a/MCF‐7 coculture populations. (D, E) Representative image (left) and fluorescence quantification (right) of 2D MCF‐7 (blue) (D) and MDA‐MB‐231 (blue) (E) from control and MCF‐12a Mito‐GFP (green) cocultures live stained with CellRox™ (red). Figure representative of 15 cells (control) 8 cells (coculture) (D) and 5 cells (control) 27 cells (coculture) (E) from 3 independent experiments. (F) Gene expression analysis of significantly altered mitochondrial genes between FACS‐isolated populations of MCF‐7 cells with Mito‐GFP from MCF‐12a donors and MCF‐7 cells that lacked Mito‐GFP. Figure obtained from 3 independent experiments of both MCF‐7 RFP and MCF‐7 RFP/GFP. Error bars display standard deviation (SD) of the mean. Statistical data were analyzed using one‐way analysis of variance (ANOVA) with Tukey's multiple comparisons test. Additionally, an unpaired t‐test was used for 3D data analysis. Scale bars = 20 μm. *P < 0.05; **P < 0.01; ***P < 0.001; ****P < 0.0001; ns, nonsignificant.

References

    1. Sachs PC, Mollica PA & Bruno RD (2017) Tissue specific microenvironments: a key tool for tissue engineering and regenerative medicine. J Biol Eng 11, 34. - PMC - PubMed
    1. Quail DF & Joyce JA (2013) Microenvironmental regulation of tumor progression and metastasis. Nat Med 19, 1423–1437. - PMC - PubMed
    1. Weigelt B & Bissell MJ (2008) Unraveling the microenvironmental influences on the normal mammary gland and breast cancer. Semin Cancer Biol 18, 311–321. - PMC - PubMed
    1. Frank‐Kamenetskii A, Mook J, Reeves M, Boulanger CA, Meyer TJ, Ragle L, Jordan HC, Smith GH & Booth BW (2023) Correction: induction of phenotypic changes in HER2‐postive breast cancer cells in vivo and in vitro. Oncotarget 14, 842. - PMC - PubMed
    1. Bruno RD & Smith GH (2012) Reprogramming non‐mammary and cancer cells in the developing mouse mammary gland. Semin Cell Dev Biol 23, 591–598. - PMC - PubMed