. 2025 Jan 28:16:1497402.
doi: 10.3389/fmicb.2025.1497402. eCollection 2025.

The prevalence and antimicrobial resistance of respiratory pathogens isolated from feedlot cattle in Canada

Affiliations

The prevalence and antimicrobial resistance of respiratory pathogens isolated from feedlot cattle in Canada

Porjai Rattanapanadda et al. Front Microbiol. .

Abstract

Objectives: The purpose of this study was to characterize the prevalence of antimicrobial resistance in Mannheimia haemolytica, Pasteurella multocida, and Histophilus somni isolated from healthy feedlot cattle over 2 years, and investigate factors potentially associated with recovery of resistant isolates.

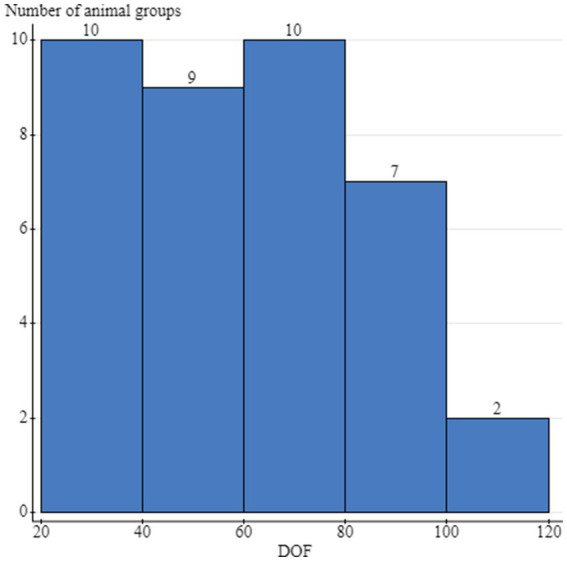
Methods: Deep-guarded nasopharyngeal (NP) swabs were used to sample feedlot cattle in multiple randomly selected feedlots (2019 n = 21, 2020 n = 26) at 2 timepoints. NP swabs were collected from 16 animals in each enrolled group upon entry processing and later in the feeding period. Cattle from the same groups (not necessarily the same animals) were sampled at both timepoints. Susceptibility testing was performed using the broth microdilution.

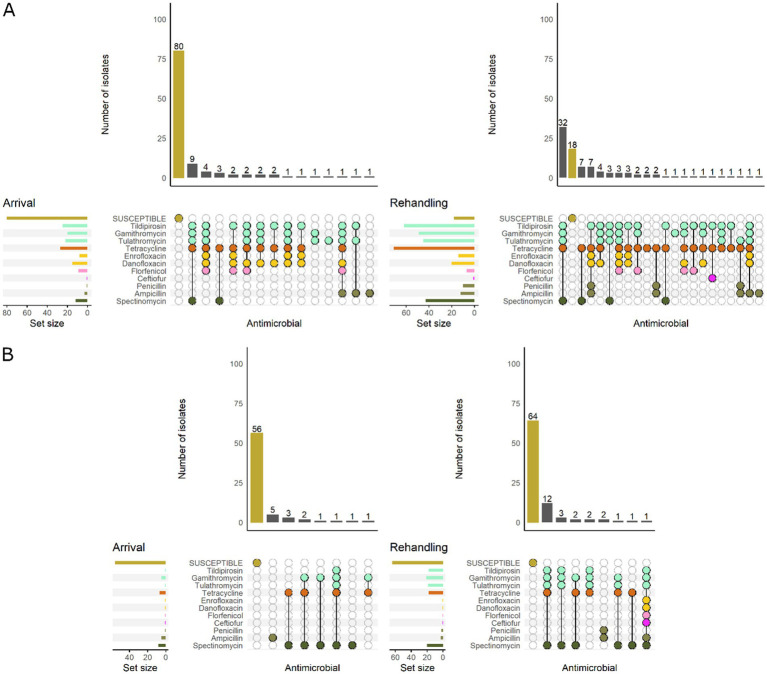
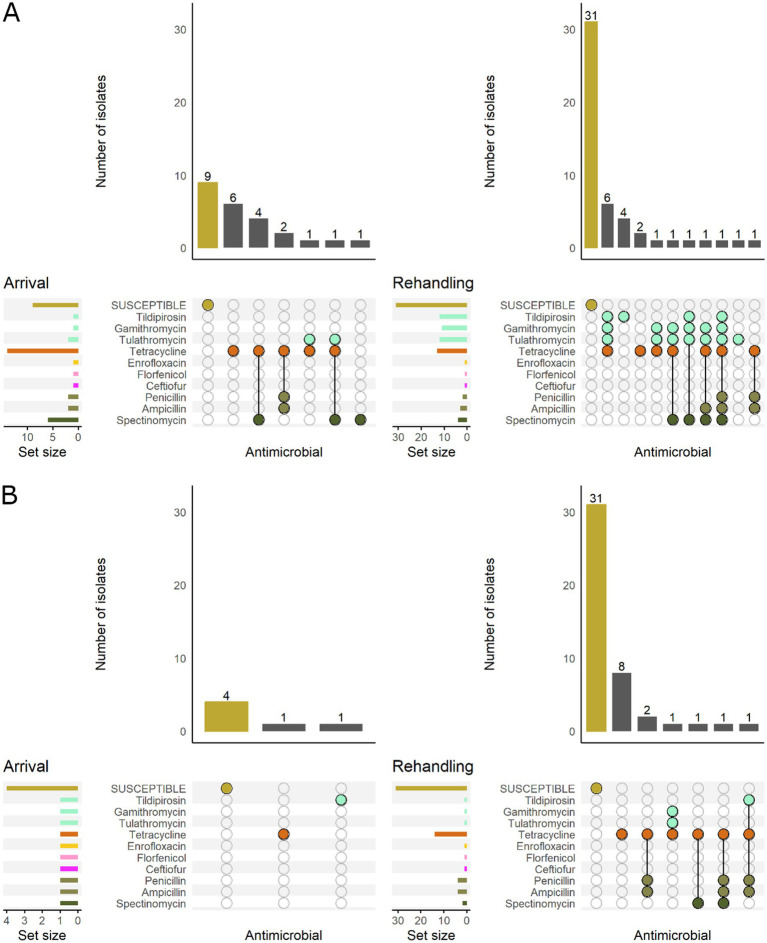
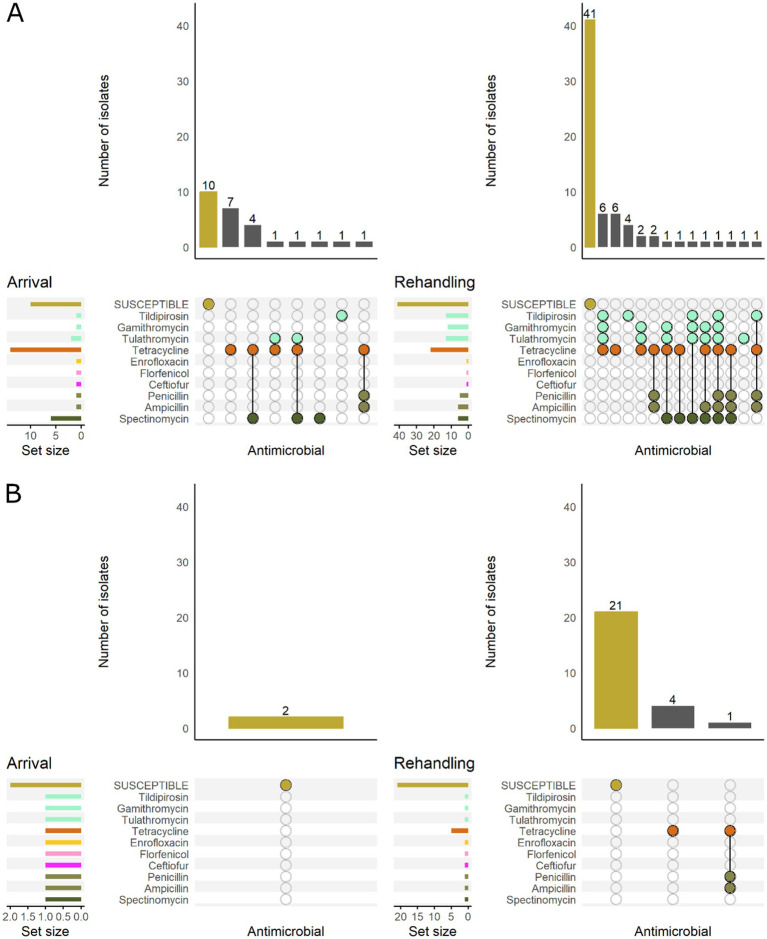
Results: A total of 1,392 cattle within 47 housing groups were sampled over 2 years, providing 625 bacterial isolates for investigation. Pasteurella multocida (27.4%) was the most frequently isolated BRD organism, followed by H. somni (9%) and M. haemolytica (8.5%). Resistance to ≥3 antimicrobial classes was detected in 2.4% of M. haemolytica, 3.4% of H. somni, and 21.3% of P. multocida isolates. Potential associations were investigated between recovery of resistant organisms and time of year at sampling (quarter), sampling timepoint (arrival or second sample), days on feed (DOF) at sampling, animal age categories, and BRD risk categories. There was a significant (p < 0.05) increase in resistance prevalence after arrival for macrolide drugs in M. haemolytica, and for ampicillin, danofloxacin, enrofloxacin, spectinomycin, gamithromycin, tildipirosin, tulathromycin and tetracycline in P. multocida isolates. Resistance was higher in calves than in yearlings for tulathromycin in H. somni, and for gamithromycin, spectinomycin, tulathromycin, tildipirosin, and tetracycline for P. multocida (p < 0.05) Resistance to tetracycline, tildipirosin, and tulathromycin decreased between 61-80 DOF and 81-100 DOF when compared to 20-40 DOF, whereas for spectinomycin, resistance was lower in cattle sampled between 61-80 DOF than those sampled at 20-40 DOF for P. multocida.

Discussion: The diversity of AMR profiles and associated risk factors between the BRD pathogens studied, underscores the importance of including all three organisms in future AMR studies in beef cattle.

Keywords: Histophilus somni; Mannheimia haemolytica; Pasteurella multocida; antimicrobial resistance; bovine respiratory disease.


Conflict of interest statement

JD was employed by Dr. Joyce Van Donkersgoed Inc. The remaining authors declare that the research was conducted in the absence of any commercial or financial relationships that could be construed as a potential conflict of interest.

Figures

Figure 1
Figure 1
Distribution of the days on feed (DOF) at the time of the rehandling sampling and the number of cattle groups sampled per stratum. Cattle groups included the individual animals that were sampled at either arrival processing or the second rehandling timepoint, and were housed together during this timeframe. The same group of cattle was sampled at both timepoints, but not necessarily the same animals.
Figure 2
Figure 2
Prevalence of antimicrobial resistance in Mannheimia haemolytica isolates, by sampling timepoint (arrival and rehandling) in 2020 and 2021. Point estimates and 95% confidence intervals were obtained from GEE modeling, accounting for the hierarchical population structures.
Figure 3
Figure 3
UpSet plots characterizing the intersection of antimicrobial resistance in M. haemolytica isolates collected from feedlot cattle and numbers of isolates with specific resistance patterns, by age and sampling timepoint. The horizontal bars at the left represent the total number of isolates within each set, and vertical bars represent the size of the intersections between the sets with resistance patterns denoted by the dots. Dots of the same color represent drugs in the same antimicrobial drug class. (A) Isolates from cattle <1 yr. old (n = 35 isolated from arrival samples and n = 35 isolates from rehandling). (B) Isolates from yearling cattle (n = 18 arrival, n = 27 at rehandling).
Figure 4
Figure 4
UpSet plots characterizing the intersection of antimicrobial resistance in M. haemolytica isolates collected from feedlot cattle and numbers of isolates with specific resistance patterns, by bovine respiratory disease (BRD) risk category and sampling timepoint. The horizontal bars at the left represent the total number of isolates within each set, and vertical bars represent the size of the intersections between the sets with resistance patterns denoted by the dots. Dots of the same color represent drugs in the same antimicrobial drug class. (A) Isolates from cattle with BRD risk (n = 33 isolated from arrival samples and n = 30 isolates from rehandling). (B) Isolates from cattle with Low BRD risk (n = 20 arrival, n = 32 at rehandling).
Figure 5
Figure 5
Prevalence of antimicrobial resistance in Pasteurella multocida isolates, by sampling timepoint (arrival and rehandling) in 2020 and 2021. Point estimates and 95% confidence intervals were obtained from GEE modeling, accounting for the hierarchical population structures.
Figure 6
Figure 6
UpSet plots characterizing the intersection of antimicrobial resistance in P. multocida isolates collected from feedlot cattle and numbers of isolates with specific resistance patterns, by age and sampling timepoint. The horizontal bars at the left represent the total number of isolates within each set, and vertical bars represent the size of the intersections between the sets with resistance patterns denoted by the dots. Dots of the same color represent drugs in the same antimicrobial drug class. (A) Isolates from cattle <1 yr. old (n = 141 isolated from arrival samples and n = 89 isolates from rehandling). (B) Isolates from yearling cattle (n = 53 arrival, n = 93 at rehandling).
Figure 7
Figure 7
UpSet plots characterizing the intersection of antimicrobial resistance in P. multocida isolates collected from feedlot cattle and numbers of isolates with specific resistance patterns, by bovine respiratory disease (BRD) risk category and sampling timepoint. The horizontal bars at the left represent the total number of isolates within each set, and vertical bars represent the size of the intersections between the sets with resistance patterns denoted by the dots. Dots of the same color represent drugs in the same antimicrobial drug class. (A) Isolates from cattle with High BRD risk (n = 111 isolated from arrival samples and n = 94 isolates from rehandling). (B) Isolates from cattle with Low BRD risk (n = 70 arrival, n = 88 at rehandling).
Figure 8
Figure 8
Prevalence of antimicrobial resistance in Histophilus somni isolates, by sampling timepoint (arrival and rehandling) in 2020 and 2021. Point estimates and 95% confidence intervals were obtained from GEE modeling, accounting for the hierarchical population structures.
Figure 9
Figure 9
UpSet plots characterizing the intersection of antimicrobial resistance in H. somni isolates collected from feedlot cattle and numbers of isolates with specific resistance patterns, by age and sampling timepoint. The horizontal bars at the left represent the total number of isolates within each set, and vertical bars represent the size of the intersections between the sets with resistance patterns denoted by the dots. Dots of the same color represent drugs in the same antimicrobial drug class. (A) Isolates from cattle <1 yr old (n = 24 isolated from arrival samples and n = 50 isolates from rehandling). (B) Isolates from yearling cattle (n = 6 arrival, n = 45 at rehandling).
Figure 10
Figure 10
UpSet plots characterizing the intersection of antimicrobial resistance in H. somni isolates collected from feedlot cattle and numbers of isolates with specific resistance patterns, by bovine respiratory disease (BRD) risk category and sampling timepoint. The horizontal bars at the left represent the total number of isolates within each set, and vertical bars represent the size of the intersections between the sets with resistance patterns denoted by the dots. Dots of the same color represent drugs in the same antimicrobial drug class. (A) Isolates from cattle with High BRD risk (n = 26 isolated from arrival samples and n = 69 isolates from rehandling). (B) Isolates from cattle with Low BRD risk (n = 2 arrival, n = 26 at rehandling).

References

    1. Abi Younes J., Ramsay D. E., Lacoste S., Deschner D., Hill J. E., Campbell J., et al. . (2022). Changes in the phenotypic susceptibility of Mannheimia haemolytica isolates to macrolide antimicrobials during the early feeding period following metaphylactic tulathromycin use in western Canadian feedlot calves. Can. Vet. J. 63, 920–928. - PMC - PubMed
    1. Andres-Lasheras S., Ha R., Zaheer R., Lee C., Booker C. W., Dorin C., et al. . (2021). Prevalence and risk factors associated with antimicrobial resistance in bacteria related to bovine respiratory disease-a broad cross-sectional study of beef cattle at entry into Canadian feedlots. Front. Vet. Sci. 8:692646. doi: 10.3389/fvets.2021.692646, PMID: - DOI - PMC - PubMed
    1. Anholt R. M., Klima C., Allan N., Matheson-Bird H., Schatz C., Ajitkumar P., et al. . (2017). Antimicrobial susceptibility of Bacteria that cause bovine respiratory disease complex in Alberta, Canada. Front. Vet. Sci. 4:207. doi: 10.3389/fvets.2017.00207, PMID: - DOI - PMC - PubMed
    1. Beker M., Rose S., Lykkebo C. A., Douthwaite S. (2018). Integrative and conjugative elements (ices) in Pasteurellaceae species and their detection by multiplex Pcr. Front. Microbiol. 9:1329. doi: 10.3389/fmicb.2018.01329, PMID: - DOI - PMC - PubMed
    1. Bhatt K., Timsit E., Rawlyk N., Potter A., Liljebjelke K. (2018). Integrative conjugative element Icehs1 encodes for antimicrobial resistance and metal tolerance in Histophilus somni. Front. Vet. Sci. 5:153. doi: 10.3389/fvets.2018.00153, PMID: - DOI - PMC - PubMed

LinkOut - more resources