. 2025 Feb 11:29:0144.
doi: 10.34133/bmr.0144. eCollection 2025.

Lipid Nanoparticle Delivery System for Normalization of Tumor Microenvironment and Tumor Vascular Structure

Affiliations

Lipid Nanoparticle Delivery System for Normalization of Tumor Microenvironment and Tumor Vascular Structure

Heejin Ha et al. Biomater Res. .

Abstract

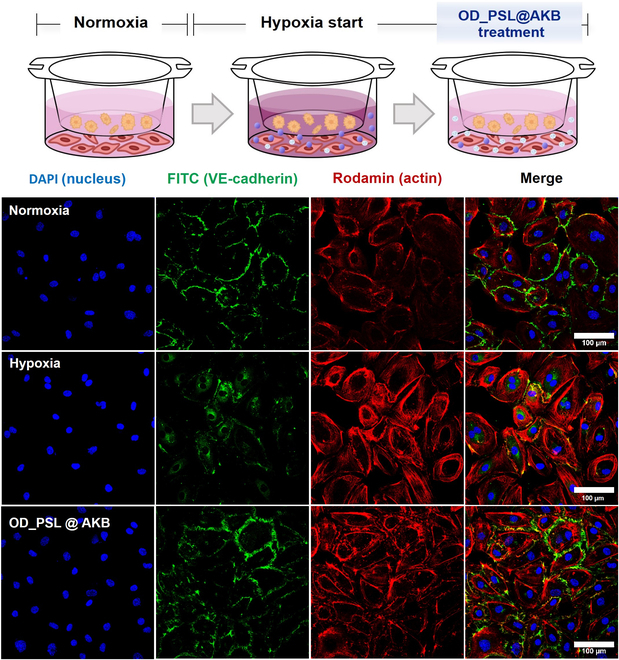
Tumors grow by receiving oxygen and nutrients from the surrounding blood vessels, leading to rapid angiogenesis. This results in functionally and structurally abnormal vasculature characterized by high permeability and irregular blood flow, causing hypoxia within the tumor microenvironment (TME). Hypoxia exacerbates the secretion of pro-angiogenic factors such as vascular endothelial growth factor (VEGF), further perpetuating abnormal vessel formation. This environment compromises the efficacy of radiotherapy, immunotherapy, and chemotherapy. In this study, we developed a pH-sensitive liposome (PSL) system, termed OD_PSL@AKB, to co-deliver oxygen (OD) and razuprotafib (AKB-9778) to tumors. This system rapidly responds to the acidic TME to alleviate hypoxia and inhibit VEGF secretion, restoring VE-cadherin expression in hypoxic endothelial cell/cancer cell cocultures. Our findings highlight the potential of OD_PSL@AKB in normalizing tumor vasculature and improving therapeutic efficacy.


Conflict of interest statement

Competing interests: J.C. is the CEO/founder and Y.C. is the CTO of Feynman Institute of Technology at the Nanomedicine Corporation.

Figures

Fig. 1.
Fig. 1.
Schematic illustration of TME modulation and tumor vascular normalization via OD_PSL@AKB delivery. OD_PSL@AKB, loaded with oxygen and AKB-9778, is a pH-sensitive lipid nanoparticle that can rapidly release its cargo in response to the acidic TME. This relieves the hypoxic environment by delivering oxygen, which in turn reduces the production of VEGF by inhibiting HIF-1α. In addition, AKB-9778, a VE-PTP-targeting small-molecule inhibitor, achieves vascular normalization through vascular maturation and stabilization by activating the Tie-2 pathway. This reduces the permeability of tumor vessels and allows normal blood flow, which may enhance drug uptake into the tumor.
Fig. 2.
Fig. 2.
Characterization of PSLs. (A) DLS size data. (B) DLS zeta potential data. (C) NTA particle concentration data. (D to F) PSL TEM image data in pH 7.4, 6.5, and 5.5 buffer. (G) SAXS data of PSL. (H) IFT analysis of PSL in pH 7.4, 6.5, and 5.5.
Fig. 3.
Fig. 3.
Oxygen and AKB-9778 in vitro release study. (A) DO levels in DPBS buffer, PSLs, OD_PSL, PSL@AKB, and OD_PSL@AKB measured using an optical DO meter. (B) The encapsulation efficiency (%) of AKB_9778 in PSL@AKB and OD_PSL@AKB was calculated by measuring the concentration of removed free AKB-9778. Analysis was conducted using HPLC. (C) Oxygen release tendency from DPBS, Oxy-DPBS, and OD_PSL using a DO meter. Normalization was performed using the highest recorded oxygen measurement as the reference point, during a total duration of 40 min. (D) AKB-9778 release tendency under different pH conditions of free AKB-9778 and PSL@AKB. Drug release was accelerated at lower pH levels, confirming the pH-sensitive release properties.
Fig. 4.
Fig. 4.
Cytotoxicity test. Cytotoxicity test of PSL, OD_PSL, PSL@AKB, and OD_PSL@AKB to HUVECs (vascular endothelial cells). (A) Data for PSL and OD_PSL, obtained through sample processing at a volume ratio (% v/v). (B) Data for PSL@AKB and OD_PSL@AKB, acquired through processing at the μM ratio of AKB-9778. Nonsignificant values are represented as ns, while ** and **** indicate P values < 0.0021 and 0.0001, respectively.
Fig. 5.
Fig. 5.
Stabilization of tube formation and permeability of HUVECs. (A) Tube formation assays were conducted using Matrigel, and bright-field images acquired at 6, 12, and 24 h were processed using ImageJ software (N, nontreated; P, treated with 10 ng/ml VEGF). (B) The total segment was graphed. (C) The total length was graphed. (D) Permeability test using a transwell system. FITC–dextran migration from the transwell chamber to the bottom plate well was quantified using a microplate reader at 12, 24, and 36 h (excitation: 488 nm, emission: 520 nm). Nonsignificant values have been represented as ns, while *, **, ***, and **** indicate P values < 0.0332, 0.0021, 0.0002, and 0.0001, respectively.
Fig. 6.
Fig. 6.
Restoration of VE-cadherin expression in vascular endothelial cells using PSL@AKB. (A) Confocal image. The expression levels of VE-cadherin and actin were compared using immunofluorescence in single-cultured HUVECs after treatment with VEGF (10 ng/ml) and treatment with free AKB and PSL@AKB. The expression level of VE-cadherin, which was attenuated by VEGF, was restored by treatment with PSL@AKB (HUVECs; blue, nucleus; green, VE-cadherin; red, actin). Analysis of fluorescence intensity of (B) VE-cadherin and (C) actin was performed using Leica Microsystems’ imaging software, LAS X, and the data are plotted as a graph. Nonsignificant values are represented as ns, while * indicate P values < 0.0001.
Fig. 7.
Fig. 7.
Suppression of VEGF in a hypoxic HUVEC/cancer coculture system. (A) Schematic representation of the entire experimental process of HUVEC/cancer cell coculture in hypoxia using a trans-well system. HUVEC/cancer cells (from left: PANC-1, MDA-MB-231, and HeLa) were cultured under hypoxia for (B) 24 h or (C) 48 h and treated with OD_PSL, OD_PSL@AKB, and Oxy-DPBS, and the changes in VEGF secretion were determined by ELISA. Nonsignificant values have been represented as ns, while *, **, ***, and **** indicate P values < 0.0332, 0.0021, 0.0002, and 0.0001, respectively.
Fig. 8.
Fig. 8.
Restoration of VE-cadherin expression by OD_PSL@AKB treatment in a hypoxic coculture environment. VE-cadherin expression levels in HUVECs in a coculture environment were analyzed by immunofluorescence confocal microscopy. VE-cadherin expression in HUVECs was affected by coculture with cancer cells and was maximized in a hypoxic environment. The expression of VE-cadherin was then restored by OD_PSL@AKB treatment. This showed that OD_PSL@AKB can effectively achieve the recovery of VE-cadherin even in a hypoxic coculture environment.

References

    1. Zanotelli MR, Reinhart-King CA. Mechanical forces in tumor angiogenesis. Adv Exp Med Biol. 2018;1092:91–112. - PMC - PubMed
    1. Martin JD, Fukumura D, Duda DG, Boucher Y, Jain RK. Reengineering the tumor microenvironment to alleviate hypoxia and overcome cancer heterogeneity. Cold Spring Harb Perspect Med. 2016;6(12):a027094. - PMC - PubMed
    1. Qian C, Liu C, Liu W, Zhou R, Zhao L. Targeting vascular normalization: A promising strategy to improve immune–vascular crosstalk in cancer immunotherapy. Front Immunol. 2023;14:1291530. - PMC - PubMed
    1. Lee W, Yoon B, Lee J, Jung S, Oh YS, Ko J, Jeon NL. Machine learning-aided three-dimensional morphological quantification of angiogenic vasculature in the multiculture microfluidic platform. Biochip J. 2023;17:357–368.
    1. Carmeliet P, Jain RK. Molecular mechanisms and clinical applications of angiogenesis. Nature. 2011;473(7347):298–307. - PMC - PubMed

LinkOut - more resources