. 2025 Feb;21(2):e14549.
doi: 10.1002/alz.14549. Epub 2025 Feb 12.

The Dementia SomaSignal Test (dSST): A plasma proteomic predictor of 20-year dementia risk

Affiliations

The Dementia SomaSignal Test (dSST): A plasma proteomic predictor of 20-year dementia risk

Michael R Duggan et al. Alzheimers Dement. 2025 Feb.

Abstract

Introduction: There is an unmet need for tools to quantify dementia risk during its multi-decade preclinical/prodromal phase, given that current biomarkers predict risk over shorter follow-up periods and are specific to Alzheimer's disease.

Methods: Using high-throughput proteomic assays and machine learning techniques in the Atherosclerosis Risk in Communities study (n = 11,277), we developed the Dementia SomaSignal Test (dSST).

Results: In addition to outperforming existing plasma biomarkers, the dSST predicted mid-life dementia risk over a 20-year follow-up across two independent cohorts with different ethnic backgrounds (areas under the curve [AUCs]: dSST 0.68-0.70, dSST+age 0.75-0.81). In a separate cohort, the dSST was associated with longitudinal declines across multiple cognitive domains, accelerated brain atrophy, and elevated measures of neuropathology (as evidenced by positron emission tomography and plasma biomarkers).

Discussion: The dSST is a cost-effective, scalable, and minimally invasive protein-based prognostic aid that can quantify risk up to two decades before dementia onset.

Highlights: The Dementia SomaSignal Test (dSST) predicts 20-year dementia risk across two independent cohorts. dSST outperforms existing plasma biomarkers in predicting multi-decade dementia risk. dSST predicts cognitive decline and accelerated brain atrophy in a third cohort. dSST is a prognostic aid that can predict dementia risk over two decades.

Keywords: dementia; machine learning; prognosis; proteomics.


Conflict of interest statement

C.P., K.L., M.S., H.B., and S.A.W. are current or former employees of SomaLogic Operating Co., Inc, and/or Standard BioTools. N.K., M.S., S.K., M.F., and I.W. are current employees of NEC Solution Innovators Limited and/or FonesLife Corporation. The remaining authors declare no conflicts of interest. Author disclosures are available in the Supporting Information.

Figures

FIGURE 1
FIGURE 1
Study design. Using high‐throughput plasma proteomic data from the ARIC study, a machine‐learning based predictor of mid‐life (20‐year) incident dementia risk called the dSST was developed and validated. After testing the dSST's capacity for predicting both mid‐ and late‐life (5‐year) dementia risk and comparing its performance to established ADRD plasma biomarkers in ARIC, the NILS‐LSA in Japan was used to test the dSST's predictive validity for 20‐year dementia risk. The BLSA was also used to assess the dSST's relationships with domain‐specific cognitive decline, changes in 3T MRI‐derived brain volumes, and differences in neuropathology, as evidenced by PET and ADRD plasma biomarkers. ADRD, Alzheimer's disease and related dementias; AFT, accelerated failure time (model); ARIC, Atherosclerosis Risk in Communities; BLSA, Baltimore Longitudinal Study of Aging; dSST, Dementia SomaSignal Test; LASSO, least absolute shrinkage and selection operator; MRI, magnetic resonance imaging; NILS‐LSA, National Institute for Longevity Sciences‐Longitudinal Study of Aging; PET, positron emission tomography.
FIGURE 2
FIGURE 2
The dSST predicts 20‐year dementia risk in the ARIC study. (A) Using blood drawn from Visit 3 (1993–1995) and dementia follow‐up through Visit 5 (2011–2013), ROC curves show the AUCs of dSST scores in discriminating 20‐year dementia risk across training and validation data sets, as well as performance of age and APOE genotype. (B) Kaplan–Meier plots show the observed 20‐year dementia event‐free probabilities grouped according to dSST risk categories (low, medium‐low, medium‐high, and high) across training and validation data sets using proteomic data from Visit 3. Event‐free probabilities were calculated across the observed times for each risk group. (C) Bar charts show the observed and predicted 20‐year dementia event rate probabilities according to dSST risk categories (low, medium‐low, medium‐high, and high) in the training data set. Predicted event rates were calculated as the mean dSST score for each risk group; the dotted line reflects average risk. (D) ROC curves show the AUC of dSST scores and ADRD plasma biomarker levels (Aβ42/40, GFAP, NfL, and p‐tau181) in discriminating 20‐year dementia risk. Results derived from Cox proportional hazard regression models. Aβ, amyloid beta; APOE, apolipoprotein E; ARIC, Atherosclerosis Risk in Communities; AUC, area under the curve; dSST, Dementia SomaSignal Test; GFAP, glial fibrillary acidic protein; NfL, neurofilament light; p‐tau, phosphorylated tau; ROC, receiver‐operating characteristic.
FIGURE 3
FIGURE 3
The dSST predicts 5‐year dementia risk in the ARIC study. (A) Using blood drawn from Visit 5 (2011–2013) and dementia follow‐up through Visit 6 (2016–2017), ROC curves show the AUCs of dSST scores in discriminating 5‐year dementia risk across training and validation data sets, as well as performance of age and APOE genotype. (B) Kaplan–Meier plots show the observed 5‐year dementia event‐free probabilities grouped according to dSST risk categories (low, medium‐low, medium‐high, and high) across training and validation data sets using proteomic data from Visit 5. Event‐free probabilities were calculated across the observed times for each risk group. (C) Bar charts show the observed and predicted 5‐year dementia event rate probabilities according to dSST risk categories (low, medium‐low, medium‐high, and high) in the training data set. Predicted event rates were calculated as the mean dSST score for each risk group; the dotted line reflects average risk. (D) ROC curves show the AUC of dSST scores and ADRD plasma biomarker levels (Aβ42/40, GFAP, NfL, p‐tau‐181) in discriminating 5‐year dementia risk. Results derived from Cox proportional hazard regression models. Aβ, amyloid beta; APOE, apolipoprotein E; ARIC, Atherosclerosis Risk in Communities; AUC, area under the curve; dSST, Dementia SomaSignal Test; GFAP, glial fibrillary acidic protein; NfL, neurofilament light; pTau, phosphorylated tau; ROC, receiver‐operating characteristic.
FIGURE 4
FIGURE 4
Changes in dSST risk categories over time in the ARIC study. A Sankey diagram shows the distribution of ARIC participants who retained the same dSST risk category across mid‐ and late‐life, and for those ARIC participants who did shift between categories, the distribution of categories to which such participants transitioned. Mid‐life dementia risk was estimated using blood draws from Visit 3 (1993–1995) and dementia follow‐up through Visit 5 (2011–2013), and late‐life dementia risk was estimated using blood draws from Visit 5 (2011–2013) and dementia follow‐up through Visit 6 (2016–2017). ARIC, the Atherosclerosis Risk in Communities; dSST, Dementia SomaSignal Test.
FIGURE 5
FIGURE 5
The dSST predicts 20‐year dementia risk in the NILS‐LSA. (A) Using blood drawn in 2000 and dementia follow‐up through 2022, ROC curves show the AUC of dSST scores in discriminating 20‐year dementia risk, as well as performance of age and APOE genotype. (B) Kaplan–Meier plots show the observed 20‐year dementia event‐free probabilities grouped according to dSST risk categories (low/medium‐low, medium‐high, and high). Event‐free probabilities were calculated across the observed times for each risk group. APOE, apolipoprotein E; AUC, area under the curve; dSST, Dementia SomaSignal Test; NILS‐LSA, National Institute for Longevity Sciences‐Longitudinal Study of Aging; ROC, receiver‐operating characteristic.
FIGURE 6
FIGURE 6
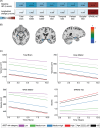
The dSST relates to differences in baseline and longitudinal brain atrophy in the BLSA. (A) Heatmaps show the associations of dSST scores with cross‐sectional differences and longitudinal rates of change in standardized regional brain volumes and SPARE‐AD scores. *Statistically significant (< 0.05). (B) Axial, coronal, and sagittal images show the associations of dSST scores with voxel‐wise longitudinal differences in gray matter volumes. A threshold of 50 voxels with an uncorrected p < 0.001 was used to define significant clusters. (C) Line graphs show the associations of dSST risk categories (relative to the low‐risk category) with cross‐sectional differences and longitudinal rates of change in total brain volume (cm3), total gray matter volume (cm3), total white matter volume (cm3), and SPARE‐AD scores. Differences in baseline and annual rates of change in brain volumes, voxels, and SPARE‐AD scores associated with dSST scores, and its risk categories were derived from linear mixed‐effects regression models. dSST, Dementia SomaSignal Test; BLSA, Baltimore Longitudinal Study of Aging; SPARE‐AD, Spatial Pattern of Atrophy for Recognition of Alzheimer's Disease.
FIGURE 7
FIGURE 7
The dSST relates to differences in biomarkers in the BLSA. (A) Boxplot (and corresponding density plots along y‐axis) shows the distribution of dSST scores across amyloid‐negative (Aβ−) and amyloid‐positive (Aβ+) PET participants. Results derived from logistic regression models. (B) ROC curves show the AUC of dSST scores and ADRD plasma biomarker levels (Aβ42/40, GFAP, NfL, and p‐tau181) in discriminating Aβ PET status (±). Results derived from logistic regression models. (C) Scatterplots and lines of best fit show differences in Aβ42/40, GFAP, NfL, and p‐tau181 levels associated with dSST scores. Density plots along the y‐axes display the distribution of ADRD plasma biomarker levels. Density plots along the x‐axis display the distribution of dSST scores. Results derived from linear regression models. Aβ, amyloid beta; ADRD, Alzheimer's disease and related dementias; AUC, area under the curve; BLSA, Baltimore Longitudinal Study of Aging; dSST, Dementia SomaSignal Test; GFAP, glial fibrillary acidic protein; NfL, neurofilament light; OR, odds ratio; PET, position emission tomography; p‐tau, phosphorylated tau; ROC, receiver‐operating characteristic.

References

    1. Sims JR, Zimmer JA, Evans CD, et al. Donanemab in early symptomatic Alzheimer disease: the TRAILBLAZER‐ALZ 2 randomized clinical trial. JAMA. 2023;330(6):512‐527. doi:10.1001/jama.2023.13239 - DOI - PMC - PubMed
    1. Dubois B, Epelbaum S, Nyasse F, et al. Cognitive and neuroimaging features and brain β‐amyloidosis in individuals at risk of Alzheimer's disease (INSIGHT‐preAD): a longitudinal observational study. Lancet Neurol. 2018;17(4):335‐346. doi:10.1016/S1474-4422(18)30029-2 - DOI - PubMed
    1. Sturchio A, Dwivedi AK, Young CB, et al. High cerebrospinal amyloid‐β 42 is associated with normal cognition in individuals with brain amyloidosis. EClinicalMedicine. 2021;38. doi:10.1016/j.eclinm.2021.100988 - DOI - PMC - PubMed
    1. Smith R, Hägerström D, Pawlik D, et al. Clinical utility of tau positron emission tomography in the diagnostic workup of patients with cognitive symptoms. JAMA Neurol. 2023. doi:10.1001/jamaneurol.2023.1323 - DOI - PMC - PubMed
    1. Boyle PA, Wang T, Yu L, et al. To what degree is late life cognitive decline driven by age‐related neuropathologies?. Brain. 2021;144(7):2166‐2175. doi:10.1093/brain/awab092 - DOI - PMC - PubMed