. 2025 Dec;17(1):2461191.
doi: 10.1080/19420862.2025.2461191. Epub 2025 Feb 12.

Nipocalimab, an immunoselective FcRn blocker that lowers IgG and has unique molecular properties

Affiliations

Nipocalimab, an immunoselective FcRn blocker that lowers IgG and has unique molecular properties

Nilufer P Seth et al. MAbs. 2025 Dec.

Abstract

Nipocalimab is a human immunoglobulin G (IgG)1 monoclonal antibody that binds to the neonatal Fc receptor (FcRn) with high specificity and high affinity at both neutral (extracellular) and acidic (intracellular) pH, resulting in the reduction of circulating IgG levels, including those of pathogenic IgG antibodies. Here, we present the molecular, cellular, and nonclinical characteristics of nipocalimab that support the reported clinical pharmacology and potential clinical application in IgG-driven, autoantibody- and alloantibody-mediated diseases. The crystal structure of the nipocalimab antigen binding fragment (Fab)/FcRn complex reveals its binding to a unique epitope on the IgG binding site of FcRn that supports the observed pH-independent high-binding affinity to FcRn. Cell-based and in vivo studies demonstrate concentration/dose- and time-dependent FcRn occupancy and IgG reduction. Nipocalimab selectively reduces circulating IgG levels without detectable effects on other adaptive and innate immune functions. In vitro experiments and in vivo studies in mice and cynomolgus monkeys generated data that align with observations from clinical studies of nipocalimab in IgG autoantibody- and alloantibody-mediated diseases.

Keywords: Adaptive immune functions; FcRn blockers; in vivo models; innate immune functions; molecular properties; pharmacologic properties.


Conflict of interest statement

NPS, RX, MD, SSih, JB, LR, TB, SB, HC, VP, KP, YW, SSuk, YP, KA, FE, JJH, and LEL are employees of and may hold stock in Johnson & Johnson. AC, JM, LM, SK, JD, and SR have no conflicts of interest to declare. ST is an employee of Orna Therapeutics, AVROBIO, and Genevant Sciences. WA is an employee of Lyndra Therapeutics, Xilio Therapeutics, and Kisbee Therapeutics; served as a consultant for Momenta Pharmaceuticals; and holds stock in Life Biosciences. EC is an employee of Myeloid Therapeutics. TD is an employee of Immunovive LLC. PN receives research support from PCORI, Alexion/AstraZeneca Rare Disease, Momenta/Janssen, and Ra Pharmaceuticals/UCB; serves on advisory boards and as a consultant for Alexion/AstraZeneca Rare Disease, Amgen, argenx, CVS, Dianthus, GSK, ImmuneAbs, Janssen, Novartis, and UCB; serves as a data monitoring committee chair for Sanofi and argenx; and receives royalties from Springer Nature.

Figures

Four illustrations showing the mechanism of action of nipocalimab.1a shows the process by which IgG molecules interact with FcRn on the endothelial membrane to be recycled (left side) and FcRn blocking by nipocalimab, which reduces levels of circulating IgG (right side). 1b illustrates these mechanisms in pregnancy, including placental transfer of IgG from maternal blood to fetal circulation (left side) and nipocalimab blocking FcRn to prevent maternal IgG from reaching fetal circulation (right side).
Figure 1.
Nipocalimab’s mechanism of action in FcRn-mediated IgG recycling and placental IgG transfer. FcRn, neonatal Fc receptor; IgG, immunoglobulin G. (a) FcRn mediates recycling in endothelial cells (left) that functions to maintain serum IgG concentrations and the long half-life of IgG (~28 days) in circulation. Nipocalimab is designed to block FcRn-mediated IgG recycling, thereby lower circulating IgG, including IgG autoantibodies and alloantibodies (right). (b) During pregnancy, placental IgG transfer occurs when maternal IgG undergoes pinocytotic uptake into syncytiotrophoblasts (the fetal-maternal barrier layer of the placenta), where they are bound to endosomal FcRn and undergo apical to basal transcytosis (transport and export) to enter the fetal vasculature (left). Nipocalimab is designed to block placental transfer of maternal IgG, including IgG alloantibodies (right), to fetal circulation.
Two illustrations showing three-dimensional co-crystal structures of nipocalimab Fab bound to FcRn. 2a shows the co-crystal structure of nipocalimab Fab bound to FcRn with one FcRn and Fab complex per asymmetric unit. 2b shows an overlay of FcRn/nipocalimab complex and FcRn/albumin complex. The overlay shows that nipocalimab and albumin share distinct, nonoverlapping epitopes on FcRn.
Figure 2.
Co-crystal structure of nipocalimab Fab bound to FcRn. Fab, antigen binding fragment; FcRn, neonatal Fc receptor; IgG, immunoglobulin G; PDB, Protein Data Bank. (a) Co-crystal structure of nipocalimab Fab bound to FcRn. Nipocalimab heavy chain is shown in magenta; the light chain is shown in yellow. FcRn α chain is shown in green, and the β2 microglobulin is shown in cyan. (b) Nipocalimab and human serum albumin share distinct, nonoverlapping epitopes on FcRn, as shown in the overlay of FcRn/nipocalimab complex (PDB ID: 9MI6) and FcRn/albumin complex (PDB ID: 4N0F). Nipocalimab centers around the Fc binding site. Albumin recognizes the other end of α1 to α2 domain of FcRn. Nipocalimab heavy chain is shown in magenta; the light chain is shown in yellow. FcRn α chain is shown in green, and the β2 microglobulin is shown in cyan. Albumin is shown in gray. FcRn residues involved in IgG Fc and albumin binding are shown in surface representation and colored in blue and orange, respectively.
Three line graphs showing the effect of nipocalimab on in vitro ADCC, ADCP, and CDC activity. In each graph, ADCC, ADCP, and CDC do not show increased activity with the addition of nipocalimab at any concentrations tested (shown in blue). With N297-nipocalimab (shown in red), these activities increase with higher concentrations.
Figure 3.
Effect of nipocalimab on in vitro ADCC, ADCP, and CDC activity. ADCC, antibody-dependent cell-mediated cytotoxicity; ADCP, antibody-dependent cellular phagocytosis; CDC, complement-dependent cytotoxicity; FcγR, Fc gamma receptor; FcRn, neonatal Fc receptor; HEK, human embryonic kidney. (a, b) ADCC and ADCP were assessed using ADCC- and ADCP-luciferase reporter assays. FcγRIIIa- and FcγRIIa-transfected Jurkat cells bound to FcRn-transfected HEK target cells treated with a range of nipocalimab or N297-nipocalimab concentrations. ADCC and ADCP activities were expressed as percent activated luciferase activity within FcγRIIIa- and FcγRIIa-transfected Jurkat cells, respectively. (c) CDC was assessed in FcRn-transfected HEK target cells treated with normal human serum complement and a range of nipocalimab or N297-nipocalimab concentrations. CDC activity was expressed as percent lysis of FcRn-HEK target cells. Points and error bars in the plots represent means and standard deviations, respectively. Experimental replicates: ADCC (n = 2), ADCP (n = 1), CDC (n = 1).
Four line graphs showing binding of nipocalimab and competitive inhibition of IgG binding to cell surface FcRn at pH 7.4 in humans (Figures 4a and 4c) and cynomolgus monkeys (Figures 4b and 4d). Each graph features a sigmoidal curve that represents the mean fluorescence intensity of nipocalimab at varying concentrations. EC50 and IC50 values from each data set are labeled on the graphs, with EC50 for binding to human and cynomolgus monkey FcRn being 0.85 µg/mL and 0.68 µg/mL, respectively, and IC50 being 3.24 µg/mL and 4.6 µg/mL, respectively, at an IgG concentration of 10 µg/mL.
Figure 4.
Binding of nipocalimab and competitive inhibition of IgG binding to cell surface FcRn at pH 7.4. APC, allophycocyanin; CI, confidence interval; Cyno, cynomolgus monkey; EC50, half-maximal effective concentration; FcRn, neonatal Fc receptor; HEK, human embryonic kidney; IC50, half-maximal inhibitory concentration; IgG, immunoglobulin G; MFI, mean fluorescence intensity. Binding of nipocalimab to cell surface (a) human FcRn or (b) cynomolgus monkey FcRn at pH 7.4 was assessed in FcRn-transfected HEK 293 cells treated with serial dilutions of nipocalimab. Following a 30-minute incubation on ice, an AF647-labeled anti-human IgG secondary antibody was added to the cells, and the MFI was measured using flow cytometry. Potency of nipocalimab for blocking IgG binding to cell surface (c) human FcRn and (d) cynomolgus monkey FcRn at pH 7.4 was also assessed using FcRn-transfected HEK 293 cells treated with 10 μg/mL human IgG–APC and serial dilutions of nipocalimab. Following a 30-minute incubation on ice, MFI of human IgG–APC bound to FcRn was measured using flow cytometry. Robust 4-parameter logistic regression models were fit to the data to estimate the EC50 and IC50 values and generate concentration-response curves, which were superimposed on the data points in the plots. Points and error bars in the plots represent means and standard deviations, respectively. Experimental replicates: n = 1.
Figure 5.
Figure 5.
Effect of nipocalimab on FcRn occupancy, IgG recycling, and albumin recycling in human endothelial cells. AF, Alexa Fluor; CI, confidence interval; DAPI, 4′,6-diamidino-2-phenylindole; DyL, DyLight; EC50, half-maximal effective concentration; FcRn, neonatal Fc receptor; HAEC, human aortic endothelial cell; HSA, human serum albumin; HUVEC, human umbilical vein endothelial cell; IC50, half-maximal inhibitory concentration; IgG, immunoglobulin G. (a) FcRn occupancy was assessed in HAECs incubated with serial dilutions of nipocalimab or nonspecific IgG isotype control for 16 hours. Cells were incubated with VivoTag 645–labeled nipocalimab and analyzed using flow cytometry. Data were calculated and presented as percentage of unoccupied FcRn. (b) IgG recycling was also assessed in HAECs incubated with fluorescently labeled human IgG in the presence of nipocalimab or a nonspecific isotype control IgG for 20 hours and analyzed using flow cytometry. Robust 4-parameter logistic regression models were fit to the nipocalimab data to estimate the EC50 and IC50 and generate concentration-response curves, which were superimposed on the data points in the plots. Points and error bars in the plots represent means and standard deviations, respectively. Experimental replicates: n = 1. (c) Subcellular localization of internalized IgG was assessed in HUVECs using fluorescence imaging. Areas of co-localization of IgG DyL-488 (green) and dextran AF594 (red) are shown in yellow. The nuclei are labeled with DAPI (blue). (d) Albumin recycling was assessed in HAECs incubated with fluorescently labeled HSA in the presence of nipocalimab or ADM31 (antibody that blocks the albumin binding site of FcRn) for 20 hours and analyzed using flow cytometry. A 4-parameter mixed-effects logistic regression model was fit to the ADM31 data to generate the concentration-response curve superimposed on the data points in the plot. Points and error bars in the plots represent means and standard deviations, respectively. Experimental replicates: n = 3.
Two line graphs revealing the effect of single IV doses of nipocalimab on FcRn occupancy and injected IgG clearance in Tg32 mice. The data points near the bottom of the graph in 6a illustrate that FcRn occupancy was >90% when nipocalimab doses of 2 mg/kg or higher were used, and these doses led to sustained occupancy. In 6b, the diamond, triangle, and inverted triangle data points corresponding to nipocalimab doses of 2 mg/kg or higher represent larger declines over time, showing an increased degradation rate of human IgG.
Figure 6.
Effect of single IV doses of nipocalimab on FcRn occupancy and injected IgG clearance in Tg32 mice. FcRn, neonatal Fc receptor; IgG, immunoglobulin G; IQR, interquartile range; IV, intravenous; IVIg, intravenous immunoglobulin; Nipo, nipocalimab. (a) FcRn occupancy in circulating monocytes and (b) injected human IgG clearance in serum samples were determined in Tg32 mice that received single IV injections of 500 kg/mg IVIg on Day −1, followed by single doses of nipocalimab or vehicle control on Day 0. FcRn occupancy was calculated and presented as the percent of unoccupied FcRn versus time post dose. IgG clearance was presented as the percent change from baseline. Points and error bars in the plots represent medians and IQRs, respectively. Experimental replicates: n = 1.
Three line graphs showing nipocalimab PK, FcRn occupancy, and serum IgG reduction following single-dose nipocalimab administration in cynomolgus monkeys. In 7a, the data points representing serum nipocalimab show a dose-dependent, nonlinear decline in concentrations over time. In 7b, data points representing nipocalimab doses ≥20 mg/kg demonstrate that >90% FcRn occupancy was observed within 4 hours and higher doses sustained longer FcRn occupancy. In 7c, data points representing nipocalimab show similar rates of reduction of serum IgG levels from baseline.
Figure 7.
Nipocalimab PK, FcRn occupancy, and serum IgG reduction following single-dose nipocalimab administration in cynomolgus monkeys. FcRn, neonatal Fc receptor; IgG, immunoglobulin G; IQR, interquartile range; Nipo, nipocalimab; PK, pharmacokinetics. (a) Nipocalimab concentration in serum, (b) FcRn occupancy in circulating monocytes, and (c) IgG concentration in serum samples were determined in cynomolgus monkeys receiving a single dose of nipocalimab or vehicle control. Points and error bars in (a) represent means and standard deviations, respectively. Experimental replicates: n = 1. FcRn occupancy was calculated and presented as the percentage of unoccupied FcRn versus time post dose. IgG clearance was presented as the percent change from baseline. Points and error bars in (b) and (c) represent medians and IQRs, respectively. Experimental replicates: n = 1.
Figure 8.
Figure 8.
Nipocalimab PK, serum IgG reduction, and immune cell functions after multiple doses of nipocalimab in cynomolgus monkeys. CPT, center point titer; IgG, immunoglobulin G; IgM, immunoglobulin M; Imm, immunization; IQR, interquartile range; IV, intravenous; KLH, keyhole limpet hemocyanin; LLOQ, lower limit of quantification; NK, natural killer; PK, pharmacokinetics. (a) Study design. Nipocalimab doses were given by IV bolus injection once weekly for 8 weeks (treatment period); cynomolgus monkeys were followed up for another 8 weeks (observation period). (b) Observed serum nipocalimab concentration over 16 weeks. Points and error bars in the plots represent means and standard deviations, respectively. Placebo concentrations are not shown as they were all below the LLOQ of 0.150 μg/mL; however, nipocalimab concentrations below LLOQ were imputed as the LLOQ divided by 2. (c) Total serum IgG concentrations expressed as percent change from baseline over 16 weeks. (d) IgM response to KLH during the treatment period. (e) IgG response to KLH during the treatment period. Points and error bars in (c), (d), and (e) represent medians and IQRs, respectively. (f) Monocyte function expressed as percent phagocytosis over 16 weeks. (g) Granulocyte function expressed as percent oxidative burst over 16 weeks. (h) NK cell killing activity expressed as percent lysis of target cells over 16 weeks. (i) CD8+ T-cell killing activity expressed as percent CD3+/CD8+/CD107a+ cytotoxic T-cells (degranulated) P815 target cells over 16 weeks. The data in (f), (g), (h), and (i) were analyzed via linear regression models using group, week, and their interaction as predictors. Points and error bars in the plots represent the estimated marginal means and 95% confidence intervals yielded from these models, respectively. Experimental replicates: n = 1.
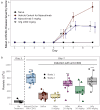
Two graphs displaying the effect of nipocalimab in the CAIA and ITP Tg32 mouse models. In 9a, a line graph shows that nipocalimab 5 mg/kg (shown in blue) reduced the progression of the arthritis disease severity score to the same extent as IVIg 1000 mg/kg (shown in gray) compared with vehicle control (shown in red) in the CAIA mouse model. In 9b, a bar graph demonstrates that nipocalimab at doses of 20 mg/kg (shown in pink) and 50 mg/kg (shown in green) and IVIg 1000 mg/kg (shown in gray) improved platelet counts compared with saline (shown in brown) in the ITP mouse model.
Figure 9.
Effect of nipocalimab in the CAIA and ITP Tg32 mouse models. CAIA, collagen antibody-induced arthritis; ctrl, control; ITP, immune thrombocytopenia; IVIg, intravenous immunoglobulin G; Nipo, nipocalimab. (a) Mean arthritis disease severity scores were evaluated over 9 days in the CAIA model treated with nipocalimab, IVIg, or vehicle control or without treatment (naive). The arthritis disease severity score is scaled from 0 to 4, where 0 = normal, no swelling and 4 = ankylosed joints, severely impaired movement. Mean arthritis disease severity scores on Days 6, 7, and 9 were analyzed via a linear regression model using group, day, and their interaction as predictors. Points and error bars represent the estimated marginal means and standard errors yielded from the model, respectively, and the stars represent p values <0.05 when the respective groups are compared to the vehicle control group. Experimental replicates: n = 1. (b) Platelet counts were determined at Days 3 and 7 in the ITP model treated with different doses of nipocalimab, isotype control, saline, or without treatment. Platelet counts at Day 7 were analyzed using a linear regression model with group and study number as predictors, and Dunnett’s test was used to compare each study group to the saline group. Asterisks represent p values <0.05 when the respective groups are compared to the saline group. Experimental replicates: n = 2.

References

    1. Dinse GE, Parks CG, Weinberg CR, Co CA, Wilkerson J, Zeldin DC, Chan EKL, Miller FW.. Increasing prevalence of antinuclear antibodies in the United States. Arthritis Rheumatol. 2022;74(12):2032–21. doi:10.1002/art.42330. - DOI - PMC - PubMed
    1. Conrad N, Misra S, Verbakel JY, Verbeke G, Molenberghs G, Taylor PN, Mason J, Sattar N, McMurray JJV, McInnes IB, et al. Incidence, prevalence, and co-occurrence of autoimmune disorders over time and by age, sex, and socioeconomic status: a population-based cohort study of 22 million individuals in the UK. Lancet. 2023;401(10391):1878–1890. doi:10.1016/S0140-6736(23)00457-9. - DOI - PubMed
    1. Hayter SM, Cook MC. Updated assessment of the prevalence, spectrum and case definition of autoimmune disease. Autoimmun Rev. 2012;11(10):754–765. doi:10.1016/j.autrev.2012.02.001. - DOI - PubMed
    1. Ludwig RJ, Vanhoorelbeke K, Leypoldt F, Kaya Z, Bieber K, McLachlan SM, Komorowski L, Luo J, Cabral-Marques O, Hammers CM, et al. Mechanisms of autoantibody-induced pathology. Front Immunol. 2017;8:603. doi:10.3389/fimmu.2017.00603. - DOI - PMC - PubMed
    1. Boekel L, Wolbink GJ. Rituximab during the COVID-19 pandemic: time to discuss treatment options with patients. Lancet Rheumatol. 2022;4(3):e154–e155. doi:10.1016/S2665-9913(21)00418-5. - DOI - PMC - PubMed

MeSH terms

LinkOut - more resources