. 2025 Jan 21;14(3):158.
doi: 10.3390/cells14030158.

RyR1 Is Involved in the Control of Myogenesis

Affiliations

RyR1 Is Involved in the Control of Myogenesis

Amandine Tourel et al. Cells. .

Abstract

The RyR1 calcium release channel is a key player in skeletal muscle excitation-contraction coupling. Mutations in the RYR1 gene are associated with congenital myopathies. Recently, a role of RyR1 in myotubes differentiation has been proposed and attributed to its calcium channel function, which nonetheless remains to be clearly demonstrated. In order to clarify RyR1 role in myogenesis, we have developed an in vitro model, the so-called RyR1-Rec myotubes, which are mouse primary myotubes with an inducible decrease in RyR1 protein amount and in RyR1-mediated calcium release. Using this model, we showed that the RyR1 protein decrease was responsible for an increase in both differentiation and fusion, from the RNA level to the morphological level, without affecting the myogenic factors MyoD and MyoG. Although an increase in mTOR pathway was observed in RyR1-Rec myotubes, it did not seem to be responsible for the role of RyR1 in myogenesis. Additionally, even if modulation of intracellular calcium level affected RyR1-Rec myotubes differentiation, we have shown that the role of RyR1 in myogenesis was independent of its calcium channel function. Therefore, our findings indicate that, besides its pivotal role as a calcium channel responsible for muscle contraction, RyR1 fulfills a calcium-independent inhibitor function of myogenesis.

Keywords: RyR1; calcium; myogenesis.


Conflict of interest statement

The authors declare no conflict of interest.

Figures

Figure 1
Figure 1
RyR1-Rec primary myotubes present a reduction in RyR1 amount and calcium release. (A) Representative Western blot of RyR1, MYHC and DHPR performed on non-treated (CTRL) and AdV-Cre treated (Cre) RyR1-Flox primary cell culture collected at different days of differentiation (D0 to D3). GAPDH is used as a loading control. (B) Quantification of the relative amount of each protein compared to GAPDH (CTRL, gray bars and RyR1-Rec, purple bars). All the data are presented as mean ± SEM of three different cultures. The mean value at D3 in the CTRL group was set to 1 as normalization for each protein. Statistical analysis: one sample t-test D3-Cre vs. D3. p = 0.0065 for RyR1. *, p < 0.05. (C,D) Fluo-4 calcium imaging performed on D3 myotubes produced from CTRL and RyR1-Rec culture (Cre). The curves represent the fluorescence variation in CTRL myotubes (gray curve) and RyR1-Rec myotubes (purple curve). All values are presented as mean ± standard error of mean (SEM) of n myotubes. In each condition, n = 175 to 256 myotubes have been analyzed, from at least three different experiments (exact number indicated for each curve). *, p < 0.05 (C) Kinetics of calcium release upon stimulation by 4-CmC at 500 µM. The stimulation is performed at 25 s and the fluorescence variation (ΔF/F0) recorded for 1 min. The peak amplitude of each curve is presented on the bar graph on the right. Statistical analysis: unpaired t-test, p < 0.0001. (D) Kinetics of calcium release upon stimulation by KCl at 140 mM. The peak amplitude of each curve is presented on the bar graph on the right. Statistical analysis: unpaired t-test, p < 0.0001.
Figure 2
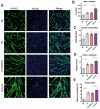
Figure 2
The reduction in RyR1 protein amount in primary myotubes is associated with an increase in myotube differentiation. (A) Representative immunofluorescence images of cultures in proliferation (D0) and after 3 days of differentiation, non-transduced (D3) or transducted with AdV-DsRed (D3-DsRed) or AdV-Cre (D3-Cre). The myotubes were stained with myosin heavy chain (MYHC, green) and the nuclei with Hoechst (blue). Scale bar: 100 um. (B) Quantification of the area of myotube, defined as the total surface occupied by myotubes divided by the number of myotubes per field, in at least 20 fields for each condition. Statistical analysis: Mann–Whitney t-test. D3 vs. D0 p = 0.0167; D3-Cre vs. D3-DsRed p = 0.0006. *, p < 0.05. (C) Quantification of the number of myotubes per field. Statistical analysis: Mann–Whitney t-test, non-significant. (D) Quantification of the number of nuclei per myotube, from at least five different cultures. Statistical analysis: Mann–Whitney t-test. D3 vs. D0 p = 0.0167, D3-Cre vs. D3-DsRed p = 0.0379. *, p < 0.05. (E) Quantification of fusion index, representing the percentage of nuclei inside MYHC-positive cells with three or more nuclei/total nuclei. Statistical analysis: Mann–Whitney t-test. D3 vs. D0 p = 0.0167, D3-Cre vs. D3-DsRed p = 0.0041. *, p < 0.05.
Figure 3
Figure 3
Reduction in RYR1 mRNA in primary myotubes is associated with an increase in late marker of myotube differentiation. The mRNA levels of myoblast proliferation/differentiation markers were quantified in control (DsRed, red bars) and RyR1-Rec (Cre, purple bars) cultures at different time points after the induction of differentiation (D0) up to 3 days (D3) by quantitative RT-qPCR. (A) Relative amount of RYR1 mRNA. Statistical analysis: Mann–Whitney comparison of RyR1-Rec vs. DsRed at each time point. On D1, p = 0.0002; on D3, p < 0.0001. *, p < 0.05. (B) Relative amount of PAX7 mRNA. Statistical analysis: Mann–Whitney comparison of RyR1-Rec vs. DsRed at each time point. Non-significant difference at each time. (C) Relative amount of MYOD mRNA. Statistical analysis: Mann–Whitney comparison of RyR1-Rec vs. DsRed at each time point. Non-significant difference at each time point. (D) Relative amount of MYOG mRNA. Statistical analysis: Mann–Whitney comparison of RyR1-Rec vs. DsRed at each time point. Non-significant difference at each time point. (E) Relative amount of MYMK mRNA. Statistical analysis: Mann–Whitney comparison of RyR1-Rec vs. DsRed at each time point. On D1, p = 0.0152. *, p < 0.05. (F) Relative amount of MYMX mRNA. Statistical analysis: Mann–Whitney comparison of RyR1-Rec vs. DsRed at each time point. At D3 p = 0.0411. *, p < 0.05. (G) Relative amount of myosin heavy chain MHC1 mRNA. Statistical analysis: Mann–Whitney comparison of RyR1-Rec vs. DsRed at each time point. On D1, p = 0.0043. *, p < 0.05. (H) Relative amount of Desmin. Statistical analysis: Mann–Whitney comparison of RyR1-Rec vs. DsRed at each time point. On D3 p = 0.0303. *, p < 0.05.
Figure 4
Figure 4
Both RyR1 quantity and calcium channel activity modulate the AMPK/mTOR pathway. (A) Representative Western blot of total and phosphorylated forms of S6rp and AMPK proteins on control (D3), AdV-DsRed transduced (D3-DsRed) and AdV-Cre transduced (D3-Cre, i.e., RyR1-Rec) RyR-Flox primary cell cultures at 3 days of differentiation. (B) Quantification of the relative amount of phosphorylated S6rp compared to the total S6rp amount performed in five to six independent cultures (left graph), and the relative amount of phosphorylated AMPK compared to the total AMPK amount performed in five to six independent cultures (non-transduced CTRL D3, gray bars; D3-DsRed, red bars; D3-Cre, purple bars). The amount in non-transduced cells is set to 1 for normalization. Statistical analysis: Mann–Whitney. D3-Cre vs. D3-DsRed p = 0.0111 for P-S6rp/S6rp. *, p < 0.05. (C) Representative Western blot of total and phosphorylated forms of S6rp and AMPK proteins on differentiated myotubes either non-treated (D3), treated for 3 h at 3 days of differentiation with 4-CmC (D3 + 4CmC), or treated for 3 h with Dantrolene (D3 + Dan). (D) Quantification of the relative amount of phosphorylated S6rp compared to the total S6rp amount performed in four independent cultures (left graph), and the relative amount of phosphorylated AMPK compared to the total AMPK amount performed in independent cultures (non-treated D3 myotubes, gray bars; myotubes treated with 4CmC horizontal stripes, myotubes treated with Dantrolene inclined stripes). The amount in non-treated cells is set to 1 for normalization. Statistical analysis: Mann–Whitney. D3 + 4CmC vs. D3 p = 0.0043 for P-S6rp/S6rp; D3 + 4CmC vs. D3 p = 0.0407 for P-AMPK/AMPK. *, p < 0.05.
Figure 5
Figure 5
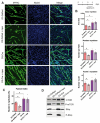
The increased myotube differentiation in RyR1-Rec myotubes is independent of the mTOR pathway. (A) Representative immunofluorescence images of myotubes at 3 days of differentiation from control (D3-DsRed) or RyR1-Rec (D3-Cre) cultures, treated or untreated with rapamycin (200 nM) for the last 24 h of differentiation. The myotubes were visualized with myosin heavy chain staining (MYHC, green) and the nuclei with Hoechst (blue). Scale bar: 100 μm. (B) The mean area of myotube, number of myotubes per field, and number of nuclei by myotubes in control myotubes (D3-DsRed) or RyR1-Rec myotubes (D3-Cre), treated or untreated with rapamycin (24 h, 200 nM), from five independent cultures. Statistical analysis: Mann–Whitney t-test. Myotubes area D3-DsRed + rapa vs. D3-DsRed p = 0.0317; D3-Cre vs. D3-DsRed p = 0.0079. Number of myotubes D3-DsRed + rapa vs. D3-DsRed p = 0.0159; nuclei/myotubes D3-DsRed + rapa vs. D3-DsRed p = 0.0317. *, p < 0.05. (C) Quantification of fusion index, representing the percentage of nuclei inside MYHC-positive cells with three or more nuclei/total nuclei on five independent cultures. Statistical analysis: Mann–Whitney t-test. D3-DsRed + rapa vs. D3-DsRed p = 0.0079; D3-Cre vs. D3-DsRed p = 0.0079. *, p < 0.05. (D) Representative Western blot showing total and phosphorylated forms of mTOR and S6rp, in control (D3-DsRed) and RyR1-Rec (D3-Cre) 3-day-myotubes with or without rapamycin treatment (24 h, 200 nM).
Figure 6
Figure 6
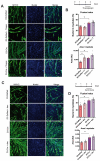
RyR1 effect on myotube differentiation is independent of RyR1-mediated calcium release. (A) Representative immunofluorescence images of primary myotube culture at 3 days of differentiation from control (D3-DsRed) or RyR1-Rec (D3-Cre) cultures and treated or untreated with thapsigargin (Thapsi or T, 50 nM) for the last 24 h of differentiation. The myotubes were visualized with myosin heavy chain staining (MYHC, green) and the nuclei with Hoechst (blue). Scale bar: 100 μm. (B) The fusion index and area of myotubes in control myotubes (D3-DsRed) or RyR1-Rec myotubes (D3-Cre), treated or untreated with thapsigargin (24 h, 50 nM), from five to six independent cultures. Statistical analysis: Mann–Whitney t-test. Fusion index: D3-Cre vs. D3-DsRed p = 0.0260. Area of myotubes: D3-DsRed + Thapsi vs. D3-DsRed p = 0.0079; D3-Cre vs. D3-DsRed p = 0.0079. *, p < 0.05. (C) Representative immunofluorescence images of primary myotubes culture at 3 days of differentiation from control (D3-DsRed) or RyR1-Rec (D3-Cre) cultures, treated or untreated with dantrolene (20 µM) for the last 24 h of differentiation. The myotubes were visualized with myosin heavy chain staining (MYHC, green) and the nuclei with Hoechst (blue). Scale bar: 100 μm. (D) The fusion index and area of myotubes in control myotubes (D3-DsRed) or RyR1-Rec myotubes (D3-Cre), treated or untreated with dantrolene (48 h, 20 µM), from four independent cultures. Statistical analysis: Mann–Whitney t-test. Fusion index: D3-Cre vs. D3-DsRed p = 0.0286. Area of myotubes: D3-Cre vs. D3-DsRed p = 0.0286. *, p < 0.05.

References

    1. Pearce L., Meizoso-Huesca A., Seng C., Lamboley C.R., Singh D.P., Launikonis B.S. Ryanodine receptor activity and store-operated Ca2+ entry: Critical regulators of Ca2+ content and function in skeletal muscle. J. Physiol. 2023;601:4183–4202. doi: 10.1113/JP279512. - DOI - PubMed
    1. Marty I., Fauré J. Excitation-Contraction Coupling Alterations in Myopathies. J. Neuromuscul. Dis. 2016;3:443–453. doi: 10.3233/JND-160172. - DOI - PMC - PubMed
    1. Lawal T.A., Todd J.J., Witherspoon J.W., Bönnemann C.G., Dowling J.J., Hamilton S.L., Meilleur K.G., Dirksen R.T. Ryanodine receptor 1-related disorders: An historical perspective and proposal for a unified nomenclature. Skelet. Muscle. 2020;10:32. doi: 10.1186/s13395-020-00243-4. - DOI - PMC - PubMed
    1. Bentzinger C.F., Wang Y.X., Rudnicki M. A Building muscle: Molecular regulation of myogenesis. Cold Spring Harb. Perspect. Biol. 2012;4:a008342. doi: 10.1101/cshperspect.a008342. - DOI - PMC - PubMed
    1. Abmayr S.M., Pavlath G.K. Myoblast fusion: Lessons from flies and mice. Development. 2012;139:641–656. doi: 10.1242/dev.068353. - DOI - PMC - PubMed

Publication types

MeSH terms

Substances

LinkOut - more resources