. 2025 Jun;48(3):725-741.
doi: 10.1007/s13402-025-01043-y. Epub 2025 Feb 12.

Meningeal leukaemic aggregates as foci of cell expansion and chemoresistance in acute lymphoblastic leukaemia metastasis

Affiliations

Meningeal leukaemic aggregates as foci of cell expansion and chemoresistance in acute lymphoblastic leukaemia metastasis

Paula Ortiz-Sánchez et al. Cell Oncol (Dordr). 2025 Jun.

Abstract

Purpose: Central nervous system (CNS) involvement and/or relapse remains one of the most important causes of morbidity/mortality in paediatric B-cell precursor acute lymphoblastic leukaemia (BCP-ALL) patients. To identify novel therapeutic targets and develop less aggressive therapies, a better understanding of the cellular and molecular microenvironment in leptomeningeal metastases is key. Here, we aimed to investigate the formation of metastatic leptomeningeal aggregates and their relevance to the expansion, survival and chemoresistance acquisition of leukaemia cells.

Methods: We used BCP-ALL xenograft mouse models, combined with immunohistofluorescence and flow cytometry, to study the development of CNS metastasis and the contribution of leptomeningeal cells to the organisation of leukaemic aggregates. To in vitro mimic the CNS metastasis, we established co-cultures of three-dimensional (3D) ALL cell spheroids and human leptomeningeal cells (hLMCs) and studied the effects on gene expression, proliferation, cytokine production, and chemoresistance.

Results: In xenografted mice, ALL cells infiltrated the CNS at an early stage and, after crossing an ER-TR7+ fibroblast-like meningeal cell layer, they proliferated extensively and formed large vascularised leukaemic aggregates supported by a network of podoplanin+ leptomeningeal cells. In leukaemia spheroid-hLMC co-cultures, unlike conventional 2D co-cultures, meningeal cells strongly promoted the proliferation of leukaemic cells and generated a pro-inflammatory microenvironment. Furthermore, in 3D cell aggregates, leukaemic cells also developed chemoresistance, at least in part due to ABC transporter up-regulation.

Conclusion: Our results provide evidence for the formation of metastatic ALL-leptomeningeal cell aggregates, their pro-inflammatory profile and their contribution to leukaemic cell expansion, survival and chemoresistance in the CNS.

Keywords: 3D cell spheroids; Acute lymphoblastic leukaemia; Cell expansion; Central nervous system; Chemoresistance; Meningeal cells.


Conflict of interest statement

Declarations. Ethical approval and consent to participate: All animal experimentation was conducted in accordance with the Spanish guidelines for care and use of laboratory animals and protocols approved by the Complutense University and Community of Madrid (PROEX 015/19; PROEX 204.2/22). BCP-ALL samples were provided by the Onco-Haematology Unit at Niño Jesús University Children’s Hospital. Informed consent was provided according to the Declaration of Helsinki, and the study was approved by the Ethics Committee of Clinical Research at Niño Jesús Hospital (R-0009/22). Competing interests: The authors declare no competing interests.

Figures

Fig. 1
Fig. 1
Kinetics of leukaemic metastasis in the leptomeninges of BCP-ALL xenografted mice. A-D Representative images of CD19 (green) and laminin (red) expression in sagittal brain cryosections of healthy (A) and primary BCP-ALL- (B), Nalm6- (C), and RS4;11-injected mice (D) at the final stage of the disease. Note the large leukaemic aggregates closely attached to the brain surface near the longitudinal fissure (SAS, subarachnoid space). E-F Semi-thin brain sections stained with toluidine blue showing cortical brain in healthy (E) and primary BCP-ALL xenografted mice (F). G Average number of CD19+ leukaemic cells (± SEM) found in the SAS of mice xenografted with BCP-ALL Nalm6, RS4;11 or primary cells at different times after cell transplantation (n = 3–8 mice/group). H Representative dot plots showing the percentage of human leukaemic cells (hCD19+) and murine leukocytes (mCD45+) present in the SAS at different times post-transplantation
Fig. 2
Fig. 2
Formation of leukaemic aggregates in the leptomeninges of mice xenografted with BCP-ALL cells. A, D, G Representative images of the early stages of the formation of leukaemic cell aggregates in the brain of Nalm6-injected mice. CD19+ leukaemic blasts appear in close contact with fibroblast-like ER-TR7+ cells. In the images the subarachnoid space (SAS) appears collapsed and the ER-TR7+ cell layer is seen in contact with the laminin+ pia mater (BV, blood vessel). B, E, H In intermediate stages, some isolated leukaemic cells are already located between the ER-TR7+ arachnoid layer and the pial-glial barrier. C, F, I In more advanced stages, leukaemia cells accumulate between the ER-TR7+ laminin+ leptomeningeal layer and the pial-glial barrier. J Podoplanin+ leptomeningeal cell network extending from the pia mater into a leukaemia cell aggregate. K CD19+ leukaemic aggregate with CD31+ blood vessels located between the inner arachnoid layer (arrows) and the pia mater. Images shown are representative of 3–5 mice per group
Fig. 3
Fig. 3
Proliferation of leukaemic cells in leptomeningeal aggregates. A-B CD19+ Ki67+ proliferating leukaemic cells located between the ERTR7+ layer and the pia mater in Nalm6-injected mice 21 days post-infusion. C Ki67+ proliferating RS4;11 leukaemic cells 35 days after transplantation. Note the Ki67 positivity of the cells regardless of their distance to the pia mater. D Large aggregate of CD19+ leukaemic cells in the leptomeninges of Nalm6-mice at the end of the disease where abundant Ki67+ proliferating cells are observed. Leukaemic cells located between the pia mater (close to brain parenchyma) and the inner arachnoid layer show a lower CD19 expression on their surface (green staining). Arrows define the inner arachnoid layer. E Toluidine blue-stained semi-thin section of a leukaemic aggregate in SAS of Nalm6-injected mice showing blasts in different phases of mitosis (red arrowheads) and in close contact with the pia mater. (A-E) Images are representative of 3–5 mice per group. F Bars represent mean (± SEM) of CD19+Ki67+ cells measured by flow cytometry in the SAS and spleen of Nalm6-mice at the end of the disease (n = 3–4). G Bars represent mean (± SEM) of CD19+ leukaemic cells in S + G2 + M cell cycle phases in the SAS and spleen of Nalm6-mice at the end of the disease (n = 3–6). H Representative dot plots showing the percentage of propidium iodide (PI+) cells within the population of CD19+ leukaemic cells recovered from whole brains of Nalm6- and RS4;11-injected mice at 28 days and 49 days post-infusion, respectively
Fig. 4
Fig. 4
Leukaemic cells downregulate CD19 expression after contact with leptomeningeal cells. A-B Representative images of human leptomeningeal cells (hLMCs) cultured for 72 h alone (A) or with Nalm6 leukaemia blasts (B). C Immunofluorescence images of CD19+ Nalm6 blasts co-cultured with hLMCs showing their typical fibroblastic appearance as revealed by phalloidin labelling. The detail shows two populations of leukaemic cells differentiated by their size and CD19 expression. D Representative flow cytometry histograms showing CD19 expression in adherent and non-adherent leukaemic cells recovered from hLMC co-cultures. In each case, the percentage of CD19high and CD19low positive cells is indicated. E Bars represent the mean fluorescence intensity (MFI) of CD19 (mean ± SEM of four independent experiments) in the non-adherent and adherent leukaemic cell populations. (*p ≤ 0.05, Student t test)
Fig. 5
Fig. 5
Changes in the expression of extracellular matrix and adhesion molecules in leukaemic spheroids mimicking in vivo leptomeningeal metastasis. A Confocal image of a 3D spheroid containing DAPI-labelled ALL cells. B RT-qPCR quantification of mRNA levels for various adhesion molecules and extracellular matrix components in BCP-ALL cells (Nalm6, red and RS4;11, blue) cultured in 3D spheroids relative to their expression in 2D suspension cultures. Bars show mean ± SEM of n = 8 and n = 4 independent experiments with Nalm6 and RS4;11 cells, respectively. (*p ≤ 0.05, **p ≤ 0.01, ***p ≤ 0.001; Mann–Whitney U test)
Fig. 6
Fig. 6
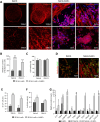
Co-culture of 3D leukaemic spheroids and leptomeningeal cells stimulate the secretion of pro-inflammatory factors and facilitate leukaemic blast expansion. A Nalm6 leukaemic spheroids cultured alone (left) and over a hLMC layer (right) after 8 days of culture. Details of peripheral (upper row) and internal (lower row) zones of leukaemia spheroids co-cultured with hLMCs are shown. The two cell types are distinguished by their morphology based on the staining of actin filaments with phalloidin (red) and the shape and size of the nuclei (DAPI; blue). Representative images of n = 4 independent experiments. B Recovery of leukaemic cells in spheroids cultured in the presence (3D ALL cells + hLMCs) or absence (3D ALL cells) of leptomeningeal cells. Results represent the mean ± SEM of eight independent experiments (**p ≤ 0.01, ***p ≤ 0.001; Mann-Whitney U test). C Viability of leukaemic cells in spheroids cultured in the presence (3D ALL cells + hLMCs) or absence (3D ALL cells) of leptomeningeal cells. Results represent the mean ± SEM of 3–4 independent experiments. D Representative images of Ki67 expression in Nalm6 leukaemic cells growing within 3D spheroids in the presence or absence of phalloidin-positive hLMCs. E Percentage of Ki67+ leukaemic cells in spheroids cultured alone or in the presence of hLMCs (mean ± SEM; n = 3; **p ≤ 0.01; Mann-Whitney U test). F Proliferation rate of Nalm6 and RS4;11 cells grown in 3D spheroids in the presence or absence of hLMCs for 8 days was determined by 7-AAD staining and analysed by flow cytometry. Mean ± SEM of proliferating cells (S + G2 + M phases) from 3–4 independent experiments are shown (*p ≤ 0.05; Mann-Whitney U test). G Cytokine and chemokine levels in the supernatant of co-cultures of leukaemia spheroids and hLMCs after 8 days. Results are expressed as increments relative to control hLMCs cultures and represent the mean ± SEM of 3–5 independent experiments (#p ≤ 0.05, ##p ≤ 0.01 represent statistically significant differences in the comparison hLMCs vs. 3D Nalm6 cells + hLMCs; *p ≤ 0.05, **p ≤ 0.01 represent statistically significant differences in the comparison hLMCs vs. 3D Nalm6 cells; $p ≤ 0.05, $$p ≤ 0.01 represent statistically significant differences in the comparison 3D Nalm6 vs. 3D Nalm6 cells + hLMCs (Mann-Whitney U test)
Fig. 7
Fig. 7
Development of chemoresistance in leukaemic aggregates. A Representative annexin V/propidium iodide dot plots showing the viability of Nalm6 and RS4;11 leukaemic cells growing in 2D or 3D conditions and in the presence or absence of human leptomeningeal cells (hLMCs), after treatment with 1 µM methotrexate (MTX) for 48 h. B Percentage of viable leukaemic cells recovered from 2D cultures, and 3D spheroids cultured alone or co-cultured with hLMCs after treatment with MTX. Data from 3–5 independent experiments are expressed as the mean ± SEM of the relative cell viability compared to the corresponding untreated cultures (*p ≤ 0.05 represent statistically significant differences respect to 2D cultures; Mann-Whitney U test). C Number of CD19+ leukaemia cells recovered from 3D BCP-ALL spheroids cultured alone or with hLMCs and after exposure to 1 µM MTX. Mean ± SEM of 3–5 independent experiments is shown (*p ≤ 0.05 represent statistically significant differences between MTX-treated and untreated cultures; $p ≤ 0.05 represent statistically significant differences between untreated cultures in the presence or absence of hLMCs; ###p ≤ 0.001 represent statistically significant differences between MTX-treated cultures in the presence or absence of hLMCs; &p ≤ 0.05 represent statistically significant differences between MTX-treated and untreated co-cultures with hLMCs; Mann-Whitney U test). D mRNA expression levels for ABC transporters in Nalm6 and RS4;11 leukaemic cells recovered from MTX-treated 3D spheroids co-cultured with or without hLMCs. Mean ± SEM of 3 independent experiments is shown (*p ≤ 0.05, **p ≤ 0.01; Mann-Whitney U test)

Similar articles

References

    1. M.T. Williams, Y.M. Yousafzai, A. Elder, K. Rehe, S. Bomken, L. Frishman-Levy, S. Tavor, P. Sinclair, K. Dormon, D. Masic, T. Perry, V.J. Weston, P. Kearns, H. Blair, L.J. Russell, O. Heidenreich, J.A. Irving, S. Izraeli, J. Vormoor, G.J. Graham, C. Halsey, The ability to cross the blood-cerebrospinal fluid barrier is a generic property of acute lymphoblastic leukemia blasts. Blood. 127(16), 1998–2006 (2016). 10.1182/blood-2015-08-665034 - PubMed
    1. R.A. Price, W.W. Johnson, The central nervous system in childhood leukemia. I. The arachnoid. Cancer. 31(3), 520–533 (1973). 10.1002/1097-0142(197303)31:3%3C520::aid-cncr2820310306%3E3.0.co;2-2 - PubMed
    1. Y.T. Cheung, N.D. Sabin, W.E. Reddick, D. Bhojwani, W. Liu, T.M. Brinkman, J.O. Glass, S.N. Hwang, D. Srivastava, C.H. Pui, L.L. Robison, M.M. Hudson, K.R. Krull, Leukoencephalopathy and long-term neurobehavioural, neurocognitive, and brain imaging outcomes in survivors of childhood acute lymphoblastic leukaemia treated with chemotherapy: a longitudinal analysis. Lancet Haematol. 3(10), e456–e466 (2016). 10.1016/S2352-3026(16)30110-7 - PMC - PubMed
    1. N.S. Phillips, K.L. Stratton, A.M. Williams, T. Ahles, K.K. Ness, H.J. Cohen, K. Edelstein, Y. Yasui, K. Oeffinger, E.J. Chow, R.M. Howell, L.L. Robison, G.T. Armstrong, W.M. Leisenring, K.R. Krull, Late-onset cognitive impairment and modifiable risk factors in adult Childhood Cancer survivors. JAMA Netw. Open. 6(5), e2316077 (2023). 10.1001/jamanetworkopen.2023.16077 - PMC - PubMed
    1. W.A. Mills, M.A. Coburn, U.B. Eyo, The emergence of the calvarial hematopoietic niche in health and disease. Immunol. Rev. 311(1), 26–38 (2022). 10.1111/imr.13120 - PMC - PubMed

MeSH terms

LinkOut - more resources