. 2025 Feb 12;38(2):52.
doi: 10.1007/s13577-025-01182-2.

Differentiation of human hyalocytes from induced pluripotent stem cells through ascorbic acid treatment

Affiliations

Differentiation of human hyalocytes from induced pluripotent stem cells through ascorbic acid treatment

Elena Laura Mazzoldi et al. Hum Cell. .

Abstract

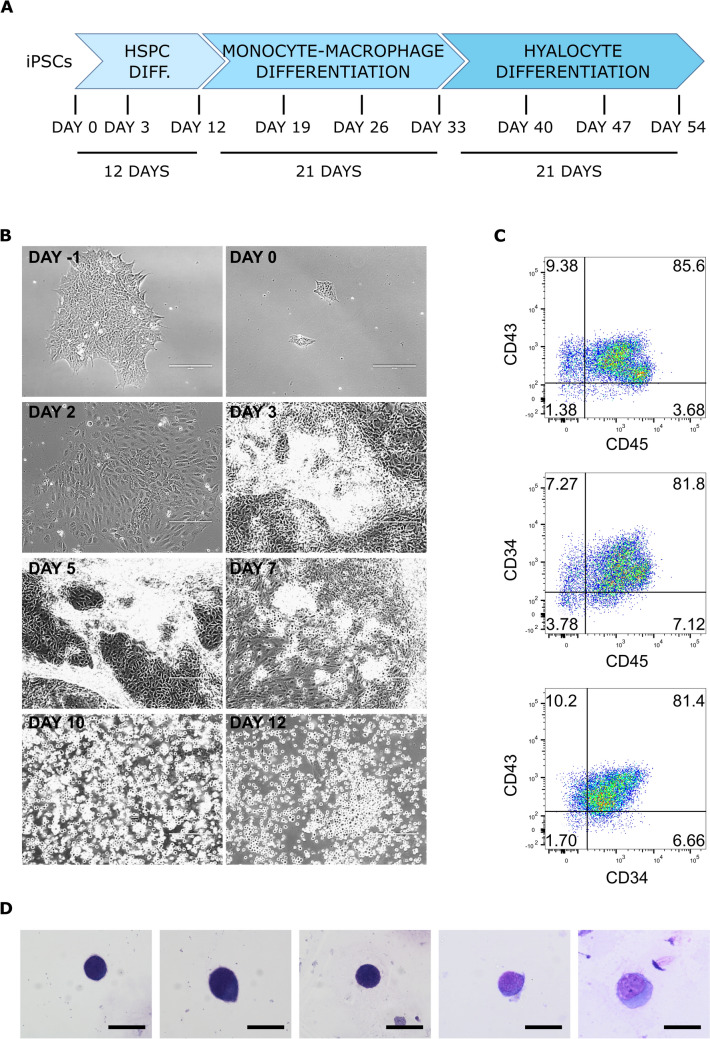
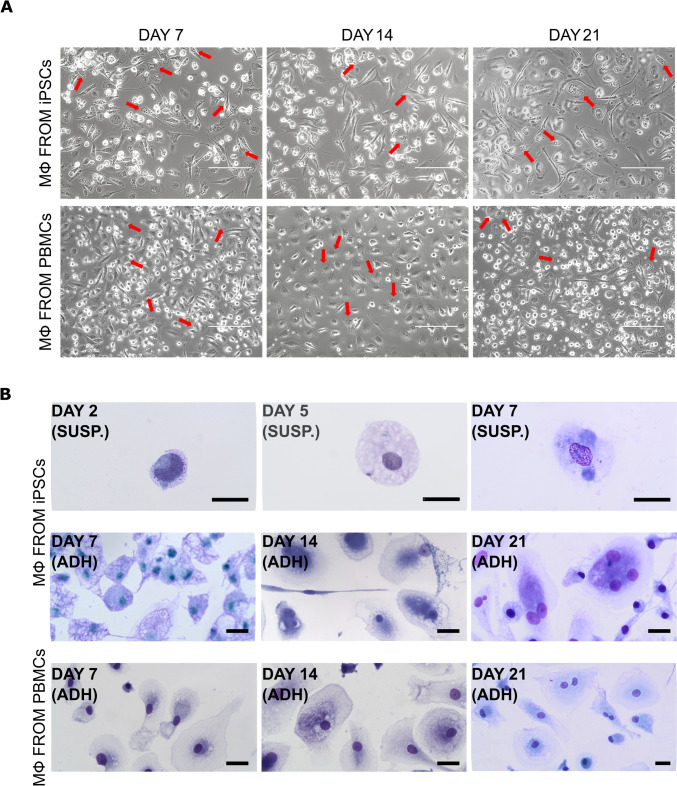
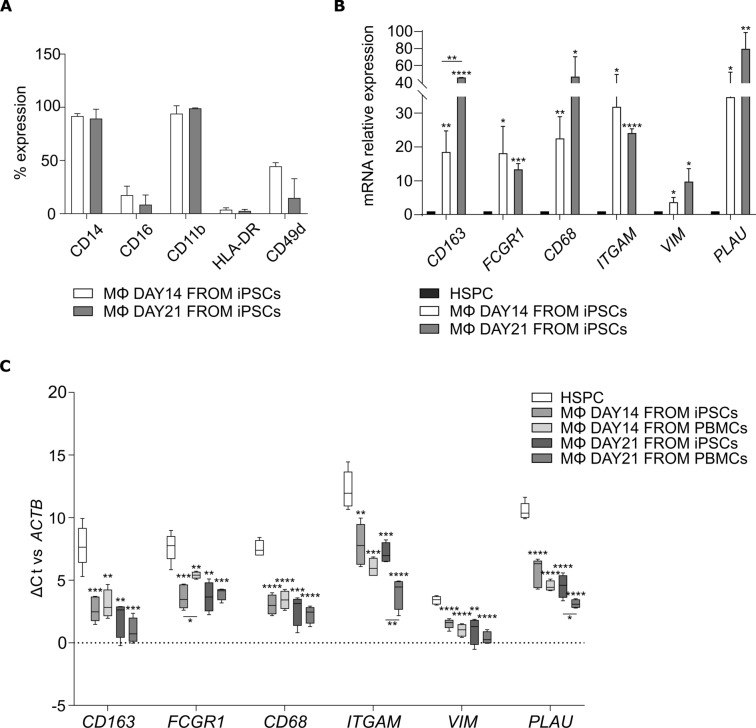
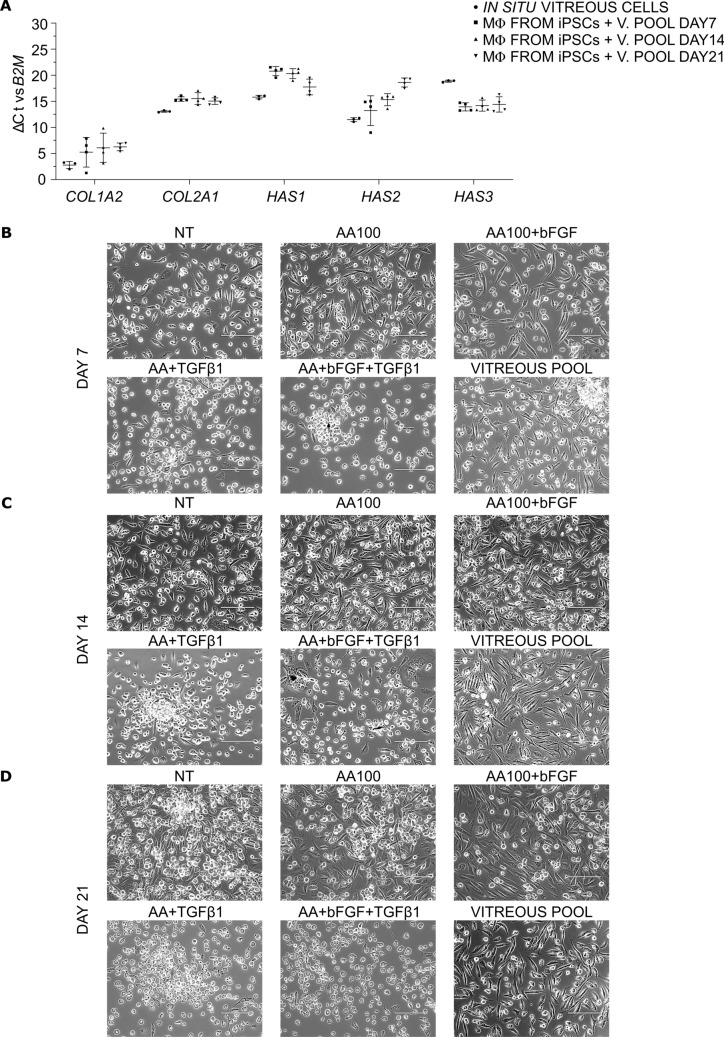
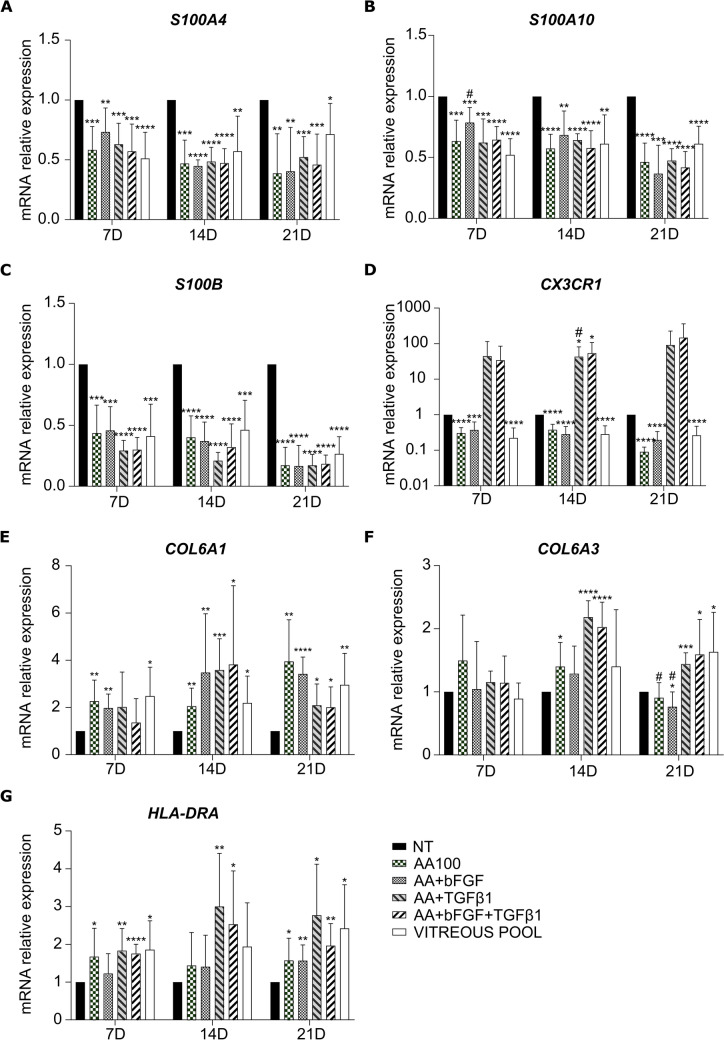
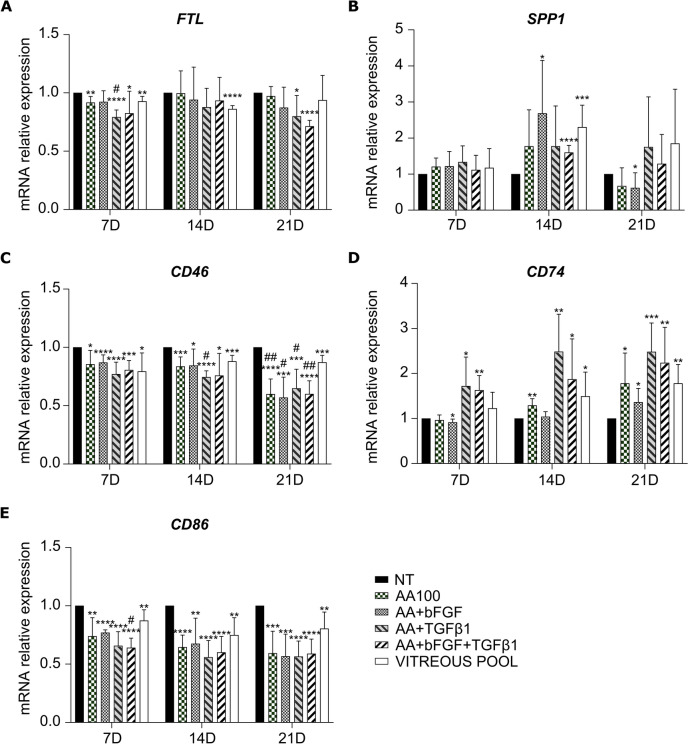
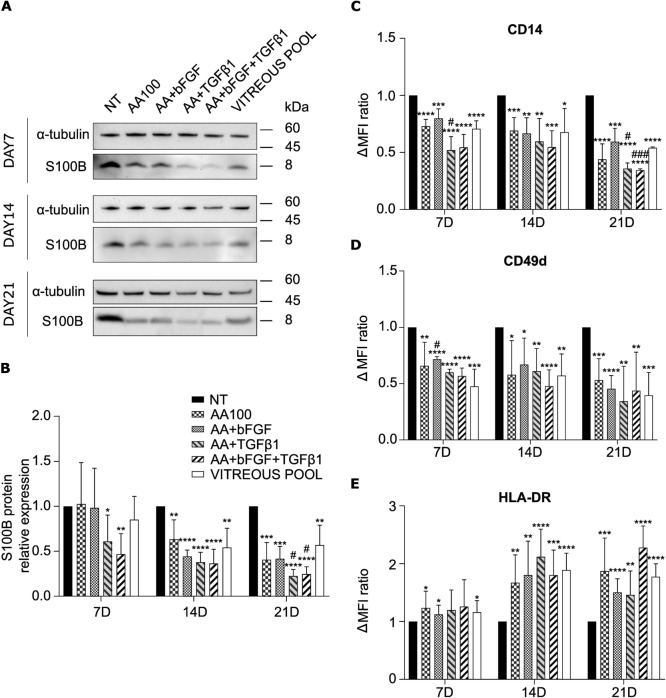
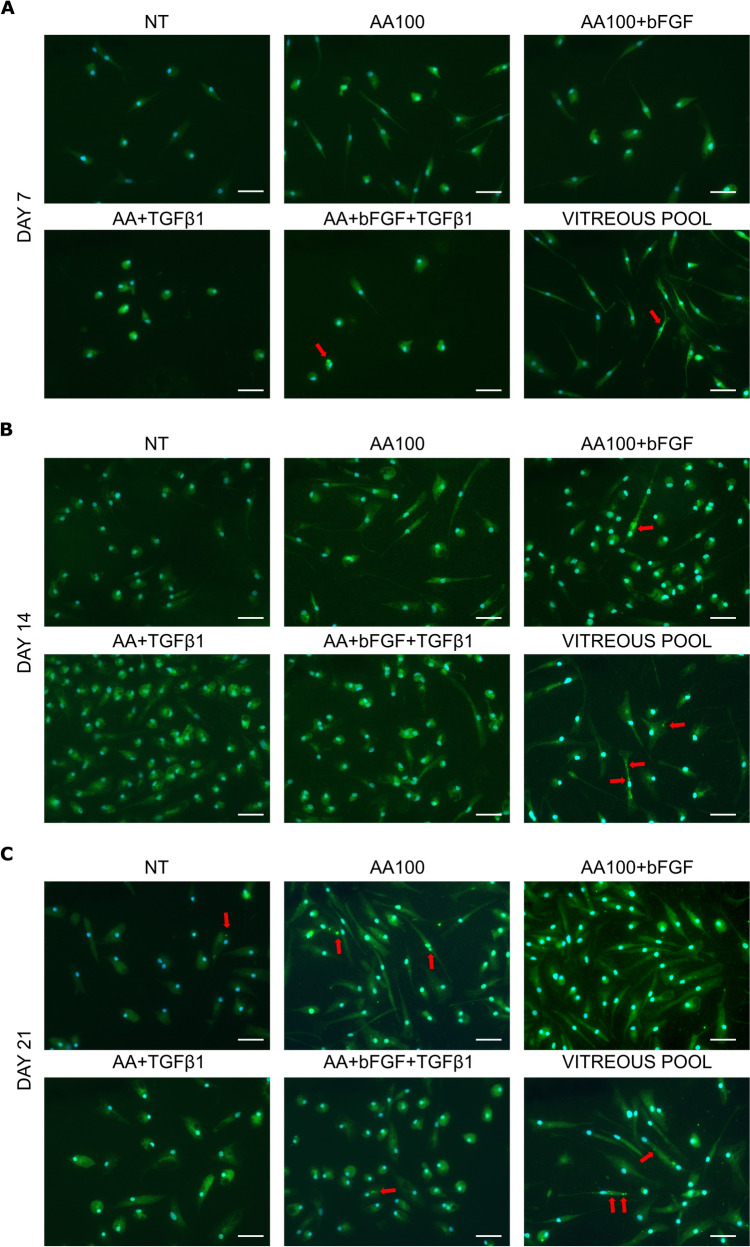
Hyalocytes are macrophage-like cells residing in the eye vitreous cortex. Even though hyalocytes have been firstly described in the mid-Nineteenth century, they have been poorly explored. Recent researches highlighted hyalocyte involvement in both physiological and pathological processes of the vitreoretinal interface. Nonetheless, the majority of works involving hyalocyte cultures were carried out in animals, while fewer studies were performed on humans because their isolation requires vitrectomy. The aim of this study was to differentiate human induced pluripotent stem cells (iPSCs) into hyalocytes as a non-invasive method to continuously obtain cells. iPSCs were first differentiated into hematopoietic stem/progenitor cells (HSPCs) and then into macrophages. Macrophages were either left untreated (NT) or treated with ascorbic acid (AA) alone or combined with bFGF and/or TGF-β1. Additionally, macrophages were cultured in the presence of a pool of vitreous bodies from vitrectomies. Cells were analyzed for morphology and then for gene and protein expression through qRT-PCR, immunofluorescence, Western Blot, and flow cytometry. Similar to cells treated with the vitreous body, macrophages treated with AA alone or in combination with bFGF exhibited a more elongated shape compared to NT or cells treated with TGF-β1. Additionally, these treatments resulted in gene expression downregulation for S100A4, S100A10, S100B, and CX3CR1, while upregulating COL6A1, HLA-DRA, and CD74. At the protein level, S100B, CD14, and CD49d were downregulated with all treatments, while collagen VI and HLA-DR were upregulated. This work demonstrates that hyalocytes can be differentiated by treatment of iPSC-derived macrophages with ascorbic acid for a period of 21 days.

Keywords: Ascorbic acid; Hyalocytes; Induced pluripotent stem cells; Macrophages; Vitreous body.


Conflict of interest statement

Declarations. Conflict of interest: The authors have no financial or non-financial interests to disclose. Ethics approval and consent to participate: The PaViCoRe study was approved by the ethics committee of the ASST Spedali Civili di Brescia in agreement with Helsinki declaration (IRB n. NP 4365). Written informed consent was obtained from the participants. Consent to publish: Not applicable.

Figures

Fig. 1
Fig. 1
HSPC differentiation from iPSCs. a Scheme of the hyalocyte differentiation protocol, consisting in 12 days of HSPC differentiation, 21 days of monocyte-macrophage differentiation, and 21 days of hyalocyte differentiation. b Representative pictures of iPSC-to-HSPC differentiation steps. Scale bar: 200 µm. c Flow cytometry analysis of HSPC marker expression after 12 days of differentiation. Representative dot plots are shown. d May-Grünwald-Giemsa staining of smears obtained from HSPCs differentiated from iPSCs. Scale bar: 20 μm
Fig. 2
Fig. 2
Macrophage differentiation from HSPCs. a Representative pictures of macrophages differentiated from iPSC-derived HSPCs and from PBMCs isolated from healthy volunteers’ blood, at day 7, 14, and 21. Scale bar: 200 µm. Red arrows indicate intracytoplasmic granules. b May-Grünwald-Giemsa staining of smears obtained from HSPCs at the first steps of differentiation towards monocytes (day 2, 5, and 7), and of adherent macrophages from iPSCs and from healthy donors’ PBMCs at day 7, 14, and 21. Scale bar: 20 μm
Fig. 3
Fig. 3
Macrophage characterization. a Flow cytometry analysis of macrophage marker expression at day 14 and 21 of differentiation from HSPCs. The bars represent the mean ± standard deviation of the percentage of positive cells (n = 3: BJ n = 2 and Episomal n = 1). b qRT-PCR analysis of macrophage-associated genes at day 14 and 21 of differentiation from HSPCs. Data were normalized to the corresponding HSPC of origin. The bars represent the mean ± standard deviation (n = 3: BJ n = 2 and Episomal n = 1). *p < 0.05, **p < 0.01, ***p < 0.001, ****p < 0.0001. c Box plots comparing the Δ cycle threshold of macrophage-associated genes versus ACTNB in HSPCs (n = 5), macrophages from iPSCs day 14 (n = 5: BJ n = 3 and Episomal n = 2) and day 21 (n = 4: BJ n = 3 and Episomal n = 1), and macrophages from healthy donors’ PBMCs (day 14 and 21, n = 4). *p < 0.05, **p < 0.01, ***p < 0.001, ****p < 0.0001
Fig. 4
Fig. 4
Hyalocyte differentiation from day 21-macrophages. a Scatter plots comparing the Δ cycle threshold of COL1A2, COL2A1, HAS1, HAS2, and HAS3 genes versus B2M in in situ vitreous cells (n = 3) and in macrophages from iPSCs cultured in the presence of a pool of vitreous bodies (1:4) for 7, 14, and 21 days (n = 4: BJ n = 3 and Episomal n = 1). Individual values are reported. The horizontal bars represent the mean ± standard deviation. b, c, d Representative pictures of macrophages either not treated (NT) or treated with 100 µg/mL ascorbic acid (AA100) alone or in combination with 10 ng/mL bFGF and/or 10 ng/mL TGF-β1. Macrophages have also been cultured in the presence of a pool of vitreous bodies (1:4). Pictures were taken at day 7 (b), day 14 (c), and day 21 (d). Scale bar: 200 µm
Fig. 5
Fig. 5
Characterization of hyalocyte gene expression. qRT-PCR analysis of S100A4 (a), S100A10 (b), S100B (c), CX3CR1 (d), COL6A1 (e), COL6A3 (f), and HLA-DRA (g) in macrophages treated with ascorbic acid alone or in combination with bFGF and/or TGF-β1, or with a pool of vitreous bodies. Data at day 7, 14, and 21 were normalized to the corresponding NT cells. The bars represent the mean ± standard deviation (n = 4: BJ n = 3 and Episomal n = 1). * and #p < 0.05, **p < 0.01, ***p < 0.001, ****p < 0.0001; * vs NT, # vs vitreous pool
Fig. 6
Fig. 6
Characterization of hyalocyte gene expression. qRT-PCR analysis of FTL (a), SPP1 (b), CD46 (c), CD74 (d), and CD86 (e) in macrophages treated with ascorbic acid alone or in combination with bFGF and/or TGF-β1, or with a pool of vitreous bodies. Data at day 7, 14, and 21 were normalized to the corresponding NT cells. The bars represent the mean ± standard deviation (n = 4: BJ n = 3 and Episomal n = 1). * and #p < 0.05, ** and ##p < 0.01, ***p < 0.001, ****p < 0.0001; * vs NT, # vs vitreous pool
Fig. 7
Fig. 7
Characterization of hyalocyte protein expression. a, b Western blot analysis of S100B expression in macrophages treated with ascorbic acid alone or in combination with bFGF and/or TGF-β1, or with a pool of vitreous bodies, for 7, 14, or 21 days. In panel a, representative blots are shown. S100B signal was normalized to α-tubulin. In panel b, the bars represent the mean ratio vs NT cells ± standard deviation (n = 4: BJ n = 3 and Episomal n = 1). * and # p < 0.05, **p < 0.01, ***p < 0.001, ****p < 0.0001; * vs NT, # vs vitreous pool. c, d, e Flow cytometry analysis of CD14 (c), CD49d (d), and HLA-DR (e) expression in macrophages treated with ascorbic acid alone or in combination with bFGF and/or TGF-β1, or with a pool of vitreous bodies, for 7, 14, or 21 days. Data were expressed as the difference between the mean fluorescence intensity (Δ MFI) of stained and unstained cells and were normalized to the corresponding NT cells. The bars represent the mean ± standard deviation (n = 3: BJ n = 2 and Episomal n = 1). * and # p < 0.05, **p < 0.01, *** and ### p < 0.001, ****p < 0.0001; * vs NT, # vs vitreous pool
Fig. 8
Fig. 8
Collagen VI immunofluorescence staining. Macrophages either not treated (NT) or treated with ascorbic acid (AA100) alone or in combination with bFGF and/or TGF-β1, or with a pool of vitreous bodies were stained at day 7 (a), 14 (b), and 21 (c). In green: Collagen VI; in blue, nuclei were stained with DAPI. Red arrows indicate spots with protein accumulation. Scale bar: 50 µm

Similar articles

References

    1. Bishop PN. Structural macromolecules and supramolecular organisation of the vitreous gel. Prog Retin Eye Res. 2000;19:323–44. - PubMed
    1. Donati S, Caprani SM, Airaghi G, Vinciguerra R, Bartalena L, Testa F, et al. Vitreous substitutes: the present and the future. Biomed Res Int. 2014;2014: 351804. - PMC - PubMed
    1. Ankamah E, Sebag J, Ng E, Nolan JM. Vitreous antioxidants, degeneration, and vitreo-retinopathy: exploring the links. Antioxidants. 2020;9(1):7. - PMC - PubMed
    1. Grabner G, Boltz G, Forster O, Grabner G. Macrophage-like properties of human hyalocytes. Invest Ophthalmol Vis Sci. 1980;19:333–40. - PubMed
    1. Sano Y, Matsuda K, Okamoto M, Takehana K, Hirayama K, Taniyama H. Characterization of equine hyalocytes: their immunohistochemical properties, morphologies and distribution. J Vet Med Sci. 2016;78:937–42. - PMC - PubMed

MeSH terms

Substances