. 2025 Aug 1;148(8):2827-2846.
doi: 10.1093/brain/awaf059.

Combined genomics and proteomics unveils elusive variants and vast aetiologic heterogeneity in dystonia

Michael Zech  1   2   3   4 Ivana Dzinovic  1   2 Matej Skorvanek  5   6 Philip Harrer  1   2 Jan Necpal  7   8 Robert Kopajtich  1   2 Volker Kittke  1   2 Erik Tilch  1   2 Chen Zhao  1   2 Eugenia Tsoma  9 Ugo Sorrentino  1   2   10 Elisabetta Indelicato  1   2   11 Antonia Stehr  1 Alice Saparov  1   2 Lucia Abela  12 Miriam Adamovicova  13 Alexandra Afenjar  14 Birgit Assmann  15 Janette Baloghova  16   17 Matthias Baumann  18 Riccardo Berutti  1   2   19 Zuzana Brezna  8 Melanie Brugger  1   4   20 Theresa Brunet  1   4   21 Benjamin Cogne  22   23 Isabel Colangelo  24 Erin Conboy  25 Felix Distelmaier  26   27 Matthias Eckenweiler  28 Barbara Garavaglia  24 Arie Geerlof  29 Elisabeth Graf  1   4 Annette Hackenberg  12 Denisa Harvanova  30 Bernhard Haslinger  31 Petra Havrankova  32 Georg F Hoffmann  15 Wibke G Janzarik  28 Boris Keren  33 Miriam Kolnikova  34 Konstantinos Kolokotronis  35 Zuzana Kosutzka  36 Anne Koy  37   38 Martin Krenn  39   40 Magdalena Krygier  41 Katarina Kusikova  34 Oliver Maier  42 Thomas Meitinger  1   4 Christian Mertes  1   4   43   44 Ivan Milenkovic  39 Edoardo Monfrini  45   46 Andre Santos Dias Mourao  29 Thomas Musacchio  47   48 Mathilde Nizon  23 Miriam Ostrozovicova  5   6 Martin Pavlov  1   2 Iva Prihodova  32 Irena Rektorova  49   50 Luigi M Romito  51 Barbora Rybanska  34 Ariane Sadr-Nabavi  1   2   52   53   54   55 Susanne Schwenger  56 Ali Shoeibi  54 Alexandra Sitzberger  21 Dmitrii Smirnov  1   2 Jana Svantnerova  36 Raushana Tautanova  57 Sandra P Toelle  12 Olga Ulmanova  32 Francesco Vetrini  25 Katharina Vill  21 Matias Wagner  1   2   4   21 David Weise  58   59 Giovanna Zorzi  60 Alessio Di Fonzo  45   46 Konrad Oexle  1   2 Steffen Berweck  21   61 Volker Mall  56   62 Sylvia Boesch  11 Barbara Schormair  1   2 Holger Prokisch  1   2   63 Robert Jech  32 Juliane Winkelmann  1   2   4   64   65
Affiliations

Combined genomics and proteomics unveils elusive variants and vast aetiologic heterogeneity in dystonia

Michael Zech et al. Brain. .

Abstract

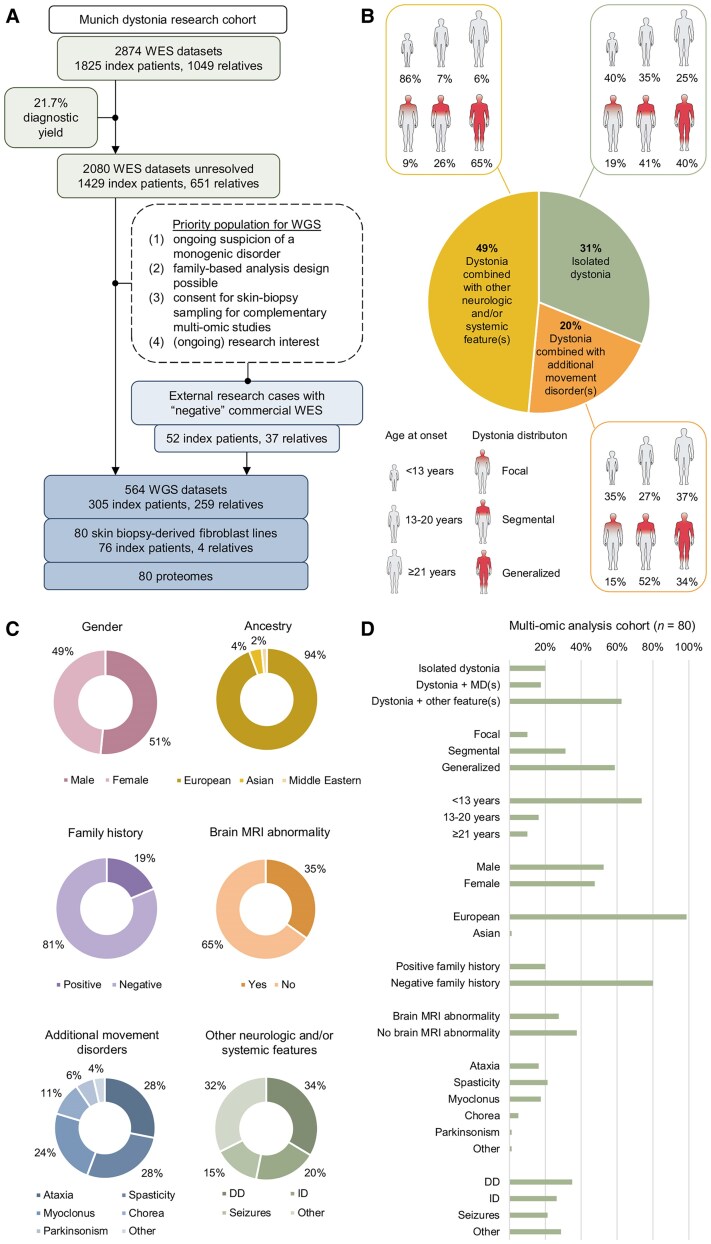
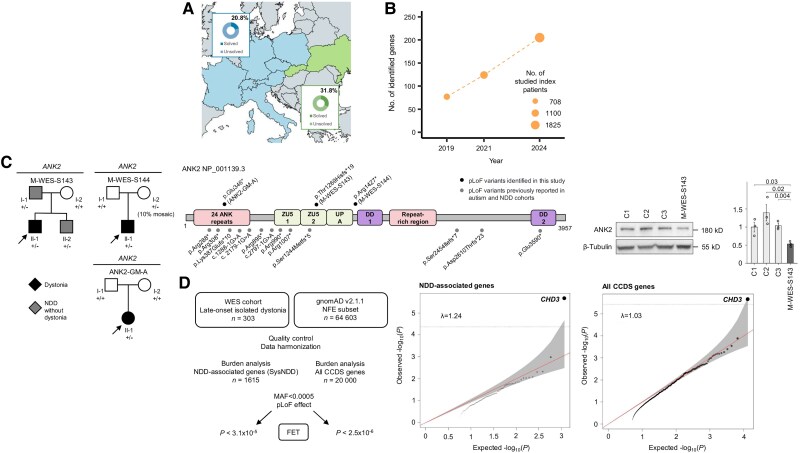
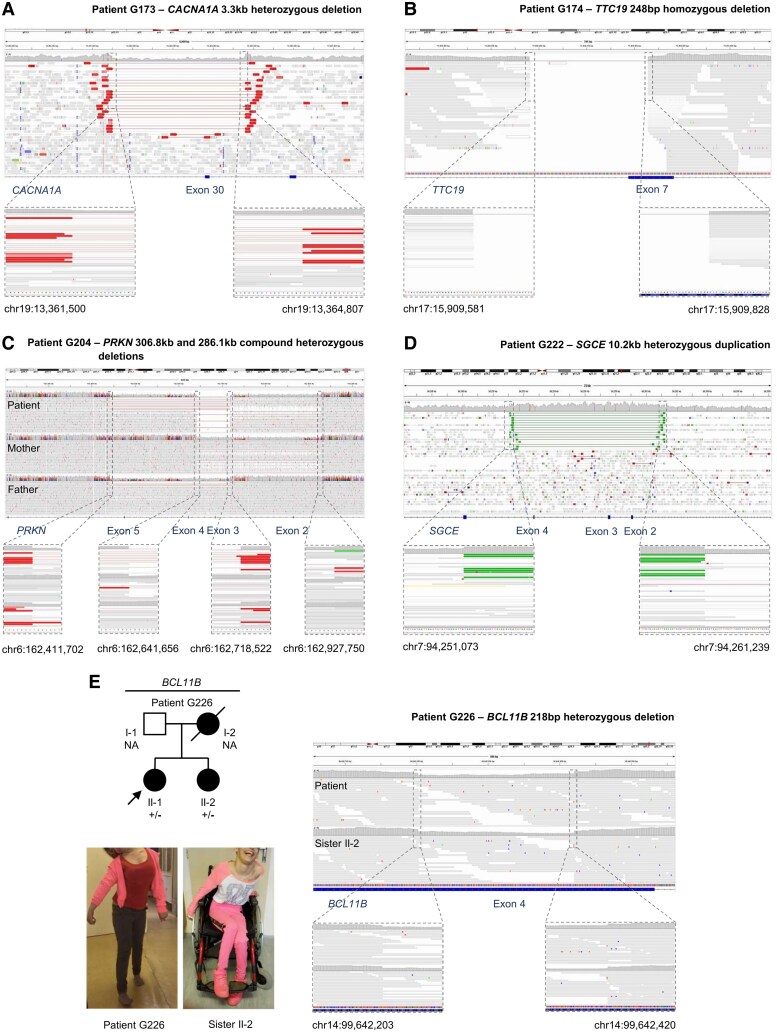
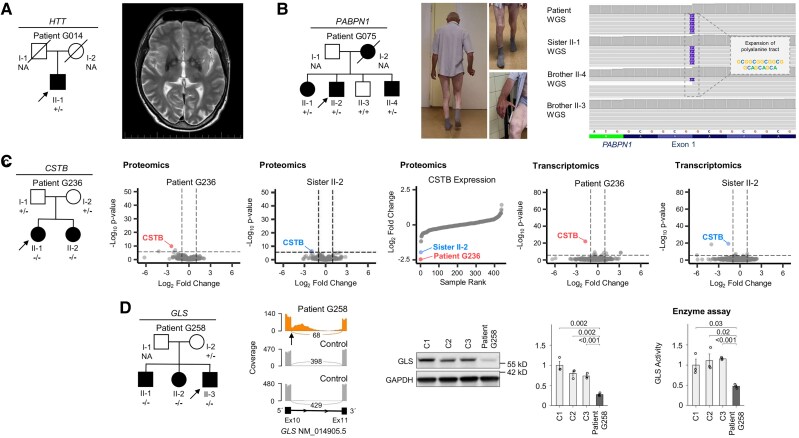
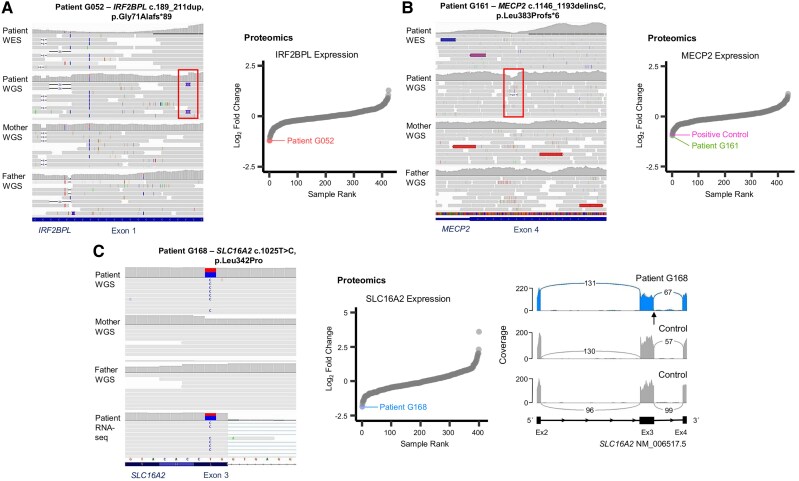
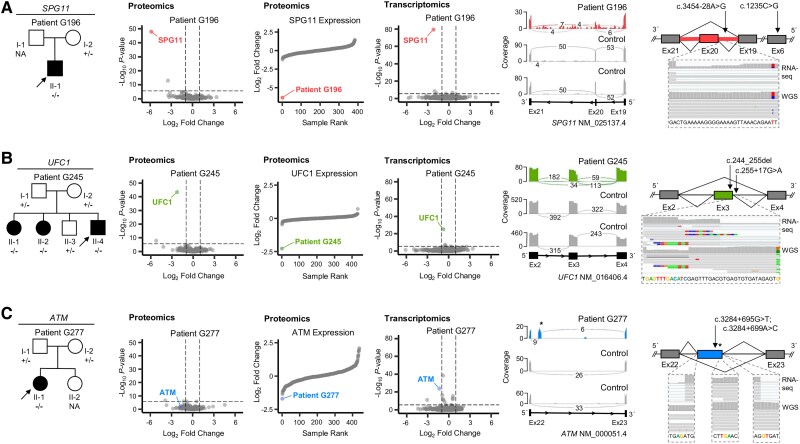
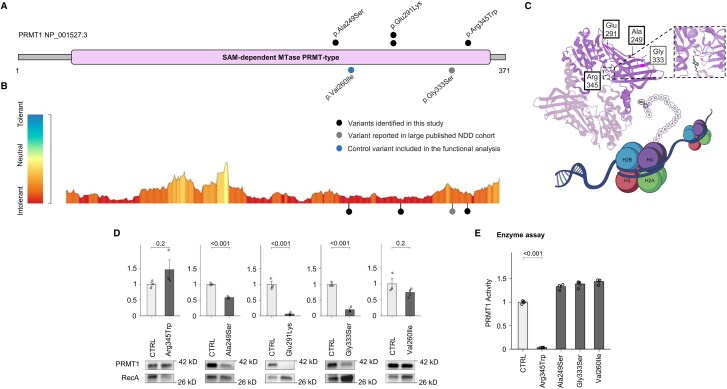
Dystonia is a rare disease trait for which large-scale genomic investigations are still underrepresented. Genetic heterogeneity among patients with unexplained dystonia warrants interrogation of entire genome sequences, but this has not yet been systematically evaluated. To significantly enhance our understanding of the genetic contribution to dystonia, we (re)analysed 2874 whole-exome sequencing (WES), 564 whole-genome sequencing (WGS), as well as 80 fibroblast-derived proteomics datasets, representing the output of high-throughput analyses in 1990 patients and 973 unaffected relatives from 1877 families. Recruitment and precision-phenotyping procedures were driven by long-term collaborations of international experts with access to overlooked populations. By exploring WES data, we found that continuous scaling of sample sizes resulted in steady gains in the number of associated disease genes without plateauing. On average, every second diagnosis involved a gene not previously implicated in our cohort. Second-line WGS focused on a subcohort of undiagnosed individuals with high likelihood of having monogenic forms of dystonia, comprising large proportions of patients with early onset (81.3%), generalized symptom distribution (50.8%) and/or coexisting features (68.9%). We undertook extensive searches for variants in nuclear and mitochondrial genomes to uncover 38 (ultra)rare diagnostic-grade findings in 37 of 305 index patients (12.1%), many of which had remained undetected due to methodological inferiority of WES or pipeline limitations. WGS-identified elusive variations included alterations in exons poorly covered by WES, RNA-gene variants, mitochondrial-DNA mutations, small copy-number variants, complex rearranged genome structure and short tandem repeats. For improved variant interpretation in WGS-inconclusive cases, we employed systematic integration of quantitative proteomics. This aided in verifying diagnoses related to technically challenging variants and in upgrading a variant of uncertain significance (3 of 70 WGS-inconclusive index patients, 4.3%). Further, unsupervised proteomic outlier analysis supplemented with transcriptome sequencing revealed pathological gene underexpression induced by transcript disruptions in three more index patients with underlying (deep) intronic variants (3/70, 4.3%), highlighting the potential for targeted antisense-oligonucleotide therapy development. Finally, trio-WGS prioritized a de novo missense change in the candidate PRMT1, encoding a histone methyltransferase. Data-sharing strategies supported the discovery of three distinct PRMT1 de novo variants in four phenotypically similar patients, associated with loss-of-function effects in in vitro assays. This work underscores the importance of continually expanding sequencing cohorts to characterize the extensive spectrum of gene aberrations in dystonia. We show that a pool of unresolved cases is amenable to WGS and complementary multi-omic studies, directing advanced aetiopathological concepts and future diagnostic-practice workflows for dystonia.

Keywords: dystonia; genomics; multi-omics; proteomics; transcriptomics; whole-genome sequencing.


Conflict of interest statement

The authors report no competing interests.

Figures

Figure 1
Figure 1
Study overview and overall cohort structures. (A) The WES cohort comprised 2874 individuals from 1825 families, analysed from 2015 to 2024. A total of 21.7% (396/1825) of the index patients received a molecular diagnosis, leaving 1429 unresolved families after exome-wide testing. Second-tier WGS was offered to a subset of undiagnosed cases and relatives, by applying inclusion criteria as follows: (1) ongoing suspicion of a monogenic condition, as defined by one or more of the following points: dystonia onset <21 years, non-focal dystonia, coexisting features, ≥3 affected family members, referring clinician formulated a specific genetic differential diagnosis (e.g. on the basis of MRI abnormalities); (2) family-based sequencing design possible; and (3) available consent for skin-biopsy sampling to complete multi-omic studies. Criteria (2) and (3) were not fulfilled by all included patients. An additional 52 index patients with uninformative WES were ascertained for the WGS experiments from external laboratories following research consent. The overall WGS sample size was determined by funding capacity, totalling 564 individuals from 305 families. We performed quantitative proteomic analyses in fibroblasts from 80 patients who underwent WGS. (B) Presence or absence of coexisting features, age at dystonia onset and dystonia distribution for 305 index patients in the WGS cohort. (C) Summary of WGS-cohort index patients with regard to gender, ancestry, family history information, neuroimaging and comorbidities. Brain MRI data were available for 204 index patients (66.9%). One or more additional movement disorders were present in 146 index patients (47.9%), and other neurologic and/or systematic features in 148 index patients (48.5%); the distributions of non-dystonic movement symptoms and other features are shown in the bottom pie charts. (D) Summary of clinical characteristics for 80 patients (76 index patients and 4 affected relatives) with available fibroblast-derived proteomic datasets. Brain MRI data were available for 52 patients (65.0%). DD = developmental delay; ID = intellectual disability; MD = movement disorder; WES = whole-exome sequencing; WGS = whole-genome sequencing.
Figure 2
Figure 2
Linearly growing number of dystonia-associated genes in the WES cohort. (A) Recruitment sites in the study with inclusion of normally underrepresented patient groups and the associated overall diagnostic rates achieved by WES. Geographical areas with underserved dystonia populations and new recruitment foci are highlighted in green. (B) Cumulative dystonia patient ascertainment for WES over time, with the number of index patients analysed at the time cut-offs of the study in 2019–2021–2024 represented by the size of each point; a detailed description of the recruitment process is provided elsewhere. The number of identified disease genes increased with increasing cohort size with no signs of plateauing. The diagnostic yield was relatively stable at ∼19%–22%. Disease genes identified by WES in the entire cohort over a decade are as follows [alphabetical order; 141/205 (68.8%) found in a single family only; for details, see Supplementary Table 2]: AARS1, ACTB, ADAR, ADCY5, AFG3L2, ALS2, ANK2, ANO3, AOPEP, ARHGEF9, ARSA, ASXL3, ATL1, ATM, ATP1A3, ATP2B2, ATP5F1A, ATP5F1B, ATP5MC3, ATP7B, ATP8A2, AUTS2, BCL11B, BRAF, BRPF1, C19orf12, CACNA1A, CACNA1E, CAMK4, CAMTA1, CASK, CD40LG, CHD3, CHD4, CHD8, CNTNAP1, COQ8A, CP, CSDE1, CTNNB1, CUL3, CUX1, CWF19L1, DCAF17, DDC, DHCR24, DHDDS, DLG4, DLL1, DNAJC6, DNM1L, DNMT1, EBF3, ECHS1, EEF1A2, EFTUD2, EIF2AK2, EIF4A2, ERCC4, ERCC8, FA2H, FBXO31, FGF14, FITM2, FOXG1, FOXP2, FRMD5, FRYL, FTL, GABBR2, GABRA1, GAD1, GCH1, GJA1, GJC2, GNAL, GNAO1, GNB1, GRIA2, GRIA3, GRID2, GRIN1, GRIN2A, HECW2, HEXA, HIBCH, IFIH1, IMPDH2, INTS11, IRF2BPL, KCNA2, KCNB1, KCNJ10, KCNMA1, KCTD17, KIF1A, KIF5A, KMT2B, LIG4, LRRK2, MAG, MATR3, MECP2, MECR, MED23, MICU1, MMAA, MORC2, MRE11, MSL3, NAA15, NARS2, NAV3, NEFL, NFIX, NGLY1, NKX2-1, NPC1, NR4A2, NUP54, OPA1, PAK1, PANK2, PARK7, PCDH12, PDE10A, PDHA1, PINK1, PLA2G6, PNKD, PNPLA6, POGZ, POLG, POLR1A, POLR3A, PPP2R5D, PPT1, PRKCG, PRKN, PRRT2, PSEN1, PTS, PURA, RALA, RARB, RERE, RHOBTB2, SATB1, SCN2A, SCO2, SCP2, SERAC1, SETX, SGCE, SHANK3, SHQ1, SLC16A2, SLC19A3, SLC20A2, SLC2A1, SLC6A1, SLC6A3, SLC9A6, SNAP25, SNX14, SON, SOX2, SOX6, SPAST, SPG11, SPG7, SPR, SPTBN1, SRRM2, SUCLG1, SUOX, SYNE1, TBC1D24, TBCD, TBX1, TCF20, TECPR2, TFE3, TH, THAP1, TMEM240, TOR1A, TTPA, TUBB4A, UBE3A, UBTF, VLDLR, VPS16, WAC, WARS2, WASHC5, WDR45, WDR73, WFS1, YY1, ZC4H2, ZEB2, ZMYND11, ZNF142, ZNF335. (C) Pedigrees for three families (black fill, individual with dystonia; grey fill, individual with neurodevelopmental phenotype without dystonia; index patients indicated with arrows) with ANK2 heterozygous predicted loss-of-function (pLoF) variants, and the positions of the variants mapped to the ANK2 protein sequence; ANK2 pLoF mutations previously reported in autism and other NDDs are shown in the protein schematic for comparison (bottom). Patient ANK2-GM-A was identified via GeneMatcher. The dystonia-related ANK2 variants p.Glu346* and p.Thr1269Hisfs*19 were absent from gnomAD v4.1.0; p.Arg1427* was present in a single gnomAD-v.4.1.0 subject, as seen for an increasing number of NDD-causing variants associated with variable expressivity; p.Arg1427* has also been identified in independent clinically affected individuals (listed as ‘likely pathogenic’ in ClinVar, ID: 3338732). Immunoblotting performed on fibroblasts from one WES-cohort individual (M-WES-S143) and three controls (C1–C3) showed significantly reduced ANK2 expression in the patient, compatible with the described haploinsufficiency mechanism of the disorder. Blots are representative of three biological replicates (see also Supplementary Fig. 1); in bar plots for quantification, results are shown as mean ± standard deviation represented by error bars (statistical significance determined by Student’s t-test). +/− = monoallelic variant carrier; +/+ = homozygous reference allele; ANK2, NM_001148.6. (D) Burden testing to demonstrate significant enrichment of heterozygous CHD3 pLoF variants in adult-onset isolated dystonia. Differences in carrier rates of rare (MAF < 0.0005) pLoF variants (defined as nonsense, frameshift and splice-site alterations) between all individuals with late adulthood-onset isolated dystonia in the WES cohort (n = 303) and controls from gnomAD-v.2.1.1 [non-Finish European (NFE) subset, n = 64 603] were determined according to established methods (Test Rare vAriants with Public Data/TRAPD approach)., A flow chart of the analysis strategy is shown. Quantile-quantile plots for the study of NDD-associated genes (n = 1615; SysNDD database) and all CCDS genes (n = 20 000) highlight a single significant signal for CHD3 (P < 3.1 × 10⁻⁵ and P < 2.5 × 10⁻⁶, respectively, indicated with dashed horizontal lines; Fisher’s exact test; genomic inflation factor λ is provided). CCDS = consensus coding sequence; gnomAD = Genome Aggregation Database; MAF = minor allele frequency; NDD = neurodevelopmental disorder; WES = whole-exome sequencing; WGS = whole-genome sequencing.
Figure 3
Figure 3
Genomic alignment of WGS data supporting CNVs reported in this study. Integrative Genomics Viewer (IGV) screenshots are shown along with zoom-in panels depicting genomic breakpoints of CNVs. Uniform coverage allowed for resolution at the nucleotide level; genomic coordinates (hg19) of the breakpoint positions are provided. (A) A heterozygous single-exon deletion in CACNA1A (NM_000068.4: exon 30) in index patient G173 with dystonia and ataxia. (B) A homozygous deletion interrupting parts of TTC19 exon-7 (NM_017775.4) in index patient G174 with dystonia, ataxia and intellectual disability. (C) Two overlapping heterozygous deletions in PRKN (NM_004562.3) in index patient G204 with dystonia-Parkinsonism. A 2-exon deletion (exons 2–3) was maternally inherited and a 3-exon deletion (exons 3–5) was paternally inherited. (D) A heterozygous intragenic tandem duplication in SGCE (NM_003919.3: exons 2–4) in index patient G222 with dystonia and myoclonus. (E) Family pedigree for index patient G226 (arrow) with dystonia and mild intellectual impairment; her sister (II-2) and deceased mother presented similar phenotypes. Representative clinical photographs of the two affected siblings illustrate generalized dystonic postures. A heterozygous intra-exonic frameshift deletion CNV was detected in exon 4 of BCL11B (NM_138576.4), the gene’s hotspot for disease-causing truncating variants., CNV = copy-number variant; NA = biological sample unavailable; WGS = whole-genome sequencing; +/− = monoallelic variant carrier.
Figure 4
Figure 4
Four examples of repeat-expansion disorders diagnosed by WGS. (A) Family pedigree for index patient G014 (arrow) with dystonia, choreatic movements and T2 signal abnormalities in basal ganglia on cerebral MRI (‘eye-of-the-tiger’ aspect), suggestive of neurodegeneration with brain-iron accumulation disorder. ExpansionHunter (EH) detected an expanded CAG allele with 40 repeat units in HTT (NM_001388492.1). (B) Family pedigree for index patient G075 (arrow) with dystonia, chorea, muscle weakness, dysphagia and cognitive decline; two siblings (II-1 and II-4) and the deceased mother had identical clinical disorders. Representative clinical photographs illustrate dystonic posturing while walking, as well as wasting of lower limbs and upper limbs in G075. EH-guided inspection of WGS reads in Integrative Genomics Viewer (IGV) revealed a 21-bp insertion, leading to an expansion of a polyalanine tract, in exon 1 of PABPN1 (NM_004643.4) in the three affected siblings, but not in a fourth, healthy brother (II-3). (C) Family pedigree for index patient G236 (arrow) and her sister (II-2), both affected by epilepsy and a combined movement disorder with dystonia, ataxia and myoclonus. Proteomic and transcriptomic analyses were performed on fibroblasts, from G236 and II-2 to demonstrate a loss-of-function effect of EH-identified bi-allelic CCCCGCCCCGCG expansions in the 5‘-UTR of CSTB (NM_000100.4). Volcano plots of proteomics display significant underexpression of CSTB protein in both siblings. Rank plot comparing CSTB levels across all proteome samples, highlights the siblings as underexpression outliers; G236: CSTB, fold-change = 0.18, sample rank = 1; II-2: CSTB, fold-change = 0.26, sample rank = 2. Volcano plots of transcriptomics, display significant underexpression of CSTB mRNA in both siblings. In volcano plots, vertical lines represent log2fold-changes of −1 and 1, and horizontal lines indicate P = 2.5 × 10⁻⁶ (Bonferroni corrected P-value for 20 000 hypotheses corresponding to the number of theoretically identifiable gene-derived proteins/RNAs). The red and blue points represent the patient measurements. (D) Family pedigree for index patient G258 (arrow) and two similarly affected siblings with developmental delay and ataxic-dystonic movement disorders. In WGS data of all three siblings, EH screening uncovered a 5‘-UTR GCA expansion as a ‘second hit’ in GLS (NM_014905.5), in addition to an exon-10 c.1197+2T>C splice donor variant. A multimodal experimental approach was deployed to validate the diagnosis of ‘global developmental delay, progressive ataxia and elevated glutamine’ (MIM: 618 412) due to glutaminase (GLS) deficiency; first, plasma amino acids were analysed in G258 to reveal increased levels of the diagnostic marker glutamine (1510 µmol/l, reference range: 329–976 µmol/l); second, fibroblast RNA-seq data were evaluated to identify a splicing abnormality resulting from c.1197+2T>C (black arrow): extension of exon-10 was observed in G258 but not in controls on Sashimi-plot visualization; third, immunoblotting was performed, showing drastic reduction of GLS expression in fibroblasts from G258 relative to three control lines (C1–C3; blots representative of three biological replicates, see also Supplementary Fig. 9; statistical significance in bar plots for quantification determined by Student’s t-test); finally, diminished GLS activity in G258 was confirmed by enzymatic testing in patient and control cells (C1–C3; activities shown in relation to activity in C1; each data-point indicates a biological replicate; statistical significance determined by Student’s t-test). NA = biological sample unavailable; RNA-seq = RNA-sequencing; UTR = untranslated region; WGS = whole-genome sequencing; +/− = monoallelic variant carrier; −/− = bi-allelic variant carrier; +/+ = homozygous reference allele.
Figure 5
Figure 5
Diagnostic confidence of WGS results enhanced by proteomics. Integrative Genomics Viewer (IGV) pileups of WGS-identified variants and rank plots for protein levels across all fibroblast proteome samples, are shown. The coloured points represent the patient measurements as indicated. (A) A de novo 23-bp duplication (red box) in a region with marked alignment complexity of IRF2BPL (NM_024496.4) in index patient G052. Note differences in read coverage of the target sequence between WES and WGS data. Diminished amounts of IRF2BPL protein in G052’s proteome supported the diagnosis of ‘neurodevelopmental disorder with regression, abnormal movements, loss of speech and seizures’ (MIM: 618088), associated with heterozygous loss of IRF2BPL expression; G052: IRF2BPL, fold-change = 0.43, sample rank = 1. (B) A poorly mapped de novo 47-bp indel (red box) in MECP2 (NM_004992.4) in index patient G161. Note differences in read coverage of the target sequence between WES and WGS data. Underexpression of MECP2 protein confirmed the diagnosis of Rett syndrome. A sample with known pathogenic heterozygous loss-of-function MECP2 variant was included in the sample rank plot as a positive control; G161: MECP2, fold-change = 0.52, sample rank = 1; positive control: MECP2, fold-change = 0.55, sample rank = 2. (C) A de novo missense c.1025T>C (p.Leu342Pro) variant of uncertain significance in SLC16A2 (NM_006517.5) identified in index patient G168. Low expression of SLC16A2 protein in G168’s proteome was indicative of a loss-of-function effect of c.1025T>C, although the variant caused no observable splicing abnormality (see RNA-seq Sashimi plot, variant position indicated with black arrow); G168: SLC16A2, fold-change = 0.28, sample rank = 1. The diagnosis was further validated by demonstration of characteristic alterations on thyroid function testing [elevated free T3 levels (7.2 pmol/l, reference range: 3.8–6 pmol/l) and elevated free T3/T4 ratio (0.82, reference range: <0.75)], adding G168 to the very short list of published female individuals with Allan–Herndon–Dudley syndrome., RNA-seq = RNA sequencing; WES = whole-exome sequencing; WGS = whole-genome sequencing.
Figure 6
Figure 6
Proteomics-guided variant prioritization in WGS data. Unbiased outlier analysis of proteomic data from index patient-derived fibroblast lines was performed and downregulated proteins were selected for closer examination in the context of WGS results. Volcano plots of fibroblast proteomic and transcriptomic analyses as well as rank plots for protein levels across all proteome samples, are shown. In volcano plots, vertical lines represent log2fold-changes of −1 and 1, and horizontal lines indicate P = 2.5 × 10⁻⁶ (Bonferroni corrected P-value for 20 000 hypotheses corresponding to the number of theoretically identifiable gene-derived proteins/RNAs). The coloured points represent the patient measurements as indicated. Schematic depictions not drawn to genomic scale. (A) Family pedigree for index patient G196 (arrow) with dystonia and spastic paraparesis. Proteomics highlighted SPG11 as expression outlier, associated with a combination of an intronic c.3454-28A>G variant and a nonsense mutation in SPG11 (NM_025137.4) in WGS data. Transcriptomics confirmed SPG11 underexpression at the RNA level. In Sashimi plots illustrating splicing in G196 (red) plus two representative controls, skipping of exon-20 and intron retention were observed as a consequence of SPG11 c.3454-28A>G. The schematic depicts the variant locations and identified splicing abnormality (top; bottom: normal splicing pattern), and the embedded IGV captures of RNA-seq and WGS data show the read pileups at the position of c.3454-28A>G. (B) Family pedigree for index patient G245 (arrow) and two similarly affected siblings with developmental delay, generalized dystonia and spasticity. Proteomics highlighted UFC1 as expression outlier, associated with a combination of an intronic c.255+17G>A variant and a 4-amino acid deletion in UFC1 (NM_016406.4) in WGS data. Transcriptomics confirmed UFC1 underexpression at the RNA level. In Sashimi plots illustrating splicing in G245 (green) plus two representative controls, skipping of exon-3 was observed as a consequence of the UFC1 variation. The schematic depicts the variant locations and identified splicing abnormality (top; bottom: normal splicing pattern), and the embedded Integrative Genomics Viewer (IGV) captures of RNA-seq and WGS data show the read pileups at the position of the variants. (C) Family pedigree for index patient G277 (arrow) with isolated dystonia and elevated AFP. Scrutiny of underexpressed products of dystonia-associated genes in proteomic data highlighted reduced levels of ATM, accompanied by a significant ATM expression deficit in transcriptomics. WGS data re-evaluation uncovered a non-coding homozygous c. 3284+695G>T; c.3284+699A>C variation in ATM intron 22 (NM_000051.3), associated with the splicing-in of a 216-bp pseudoexon containing a premature stop codon; see Sashimi plots for G277 (blue) plus two representative controls (stop codon indicated with an asterisk). The schematic depicts the variant location and identified pseudoexon inclusion (top; bottom: normal splicing pattern), and the embedded IGV captures of RNA-seq and WGS data show the read pileups at the cryptic splice sites and the premature stop codon (TGA). AFP = alpha-fetoprotein; NA = biological sample unavailable; RNA-seq = RNA sequencing; WGS = whole-genome sequencing; +/− = monoallelic variant carrier; −/− = bi-allelic variant carrier.
Figure 7
Figure 7
Discovery and functional characterization of de novo variants in PRMT1. (A) PRMT1 variants (NM_001536.5) detected in four patients affected by neurodevelopmental phenotypes with or without dystonia mapped to the PRMT1 protein sequence (black, top). An additional PRMT1 variant reported in a large study of de novo mutations in NDDs is in grey (bottom); a gnomAD control variant included in the in vitro assays is in blue (bottom). The canonical functional region is highlighted according to UniProt. (B) Regional missense constraint over PRMT1, visualized via the MetaDome tolerance landscape server. The relative positions of patient variants depicted in A are indicated on PRMT1 NP_938074.2, corresponding to the alternative transcript NM_198318.4 (MetaDome analysis not available for NM_001536.5). The variants were predicted to affect missense mutation-intolerant regions. (C) 3D dimer representation of PRMT1 (PDB: 6NT2) with mutated residues indicated; our variants (black boxes) were localized in the vicinity of the catalytic core and in the C-terminal β-barrel domain; a magnified view of the region near residue Arg345 is depicted, illustrating the close spatial relationship between this mutated site and the binding pocket for PRMT1’s cofactor S-adenosyl methionine (a synthetic inhibitor of this pocket is shown in stick representation). The association with histones is illustrated, linking the identified disorder to the family of epigenetic-regulation defect syndromes, similarly to KMT2B-related dystonia. (D) Representative immunoblots showing protein expression levels of normal control PRMT1 and mutant forms and bar plots for quantification. The here-identified variants p.Ala249Ser and p.Glu291Lys as well as the variant p.Gly333Ser from a published NDD cohort reduced PRMT1 stability, indicating decreased functional PRMT1 levels in the carrier individuals. Stable expression was not significantly altered for PRMT1 proteins carrying the patient variant p.Arg345Trp or the gnomAD variant p.Val260Ile. PRMT1 protein intensities were normalized to RecA. All analyses were performed in triplicate (each data-point indicates a biological replicate; see also Supplementary Fig. 10), and results are shown as mean ± standard deviation represented by error bars. Statistical analysis was performed by Student’s t-test. (E) Enzymatic assay results for the PRMT1 missense substitutions, showing diminished activity compared with the normal control for the dystonia-associated variant p.Arg345Trp, but not for p.Ala249Ser, p.Gly333Ser, and p.Val260Ile (gnomAD). Means ± standard deviation are plotted, and statistical significance was determined by Student’s t-test. gnomAD = Genome Aggregation Database; NDD = neurodevelopmental disorder.

Similar articles

Cited by

References

    1. Albanese A, Bhatia K, Bressman SB, et al. Phenomenology and classification of dystonia: A consensus update. Mov Disord. 2013;28:863–873. - PMC - PubMed
    1. Grutz K, Klein C. Dystonia updates: Definition, nomenclature, clinical classification, and etiology. J Neural Transm (Vienna). 2021;128:395–404. - PMC - PubMed
    1. van Egmond ME, Kuiper A, Eggink H, et al. Dystonia in children and adolescents: A systematic review and a new diagnostic algorithm. J Neurol Neurosurg Psychiatry. 2015;86:774–781. - PubMed
    1. van Egmond ME, Lagrand TJ, Lizaitiene G, Smit M, Tijssen MAJ. A novel diagnostic approach for patients with adult-onset dystonia. J Neurol Neurosurg Psychiatry. 2022;93:1039–1048. - PubMed
    1. Pozojevic J, Beetz C, Westenberger A. The importance of genetic testing for dystonia patients and translational research. J Neural Transm (Vienna). 2021;128:473–481. - PMC - PubMed