. 2025 Feb 12;17(785):eadm7269.
doi: 10.1126/scitranslmed.adm7269. Epub 2025 Feb 12.

Tumor extracellular vesicle-derived PD-L1 promotes T cell senescence through lipid metabolism reprogramming

Affiliations

Tumor extracellular vesicle-derived PD-L1 promotes T cell senescence through lipid metabolism reprogramming

Feiya Ma et al. Sci Transl Med. .

Abstract

The limited success of cancer immunotherapy has posed challenges in treating patients with cancer. However, promising strides could be made with a deeper understanding of the factors that cause T cell dysfunction within the tumor microenvironment and by developing effective strategies to counteract tumor-induced immune suppression. Here, we report that tumor-derived extracellular vesicles (tEVs) can induce senescence and suppression in T cells. Programmed death ligand 1 (PD-L1), a key component within tEVs, induced DNA damage and hyperactive lipid metabolism in both human and mouse T cells. This caused an elevated expression of lipid metabolic enzymes and an increase in cholesterol and lipid droplet formation, leading to cellular senescence. At a molecular level, PD-L1 derived from tEVs activated the cAMP-response element binding protein (CREB) and signal transducer and activator of transcription (STAT) signaling, which promoted lipid metabolism and facilitated senescence in human and mouse T cells. Inhibiting EV synthesis in tumors or blocking CREB signaling, cholesterol synthesis, and lipid droplet formation in effector T cells averted the tEV-mediated T cell senescence in vitro and in vivo in cell adoptive transfer and melanoma mouse models. The same treatments also bolstered the antitumor efficacy of adoptive transfer T cell therapy and anti-PD-L1 checkpoint immunotherapy in both human and mouse melanoma models. These studies identified mechanistic links between tumor-mediated immune suppression and potential immunotherapy resistance, and they provide new strategies for cancer immunotherapy.


Conflict of interest statement

Competing interests: The authors declare that they have no competing interests.

Figures

Fig. 1.
Fig. 1.. tEVs induce T cell senescence.
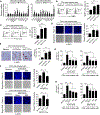
(A) The plot shows the proliferation of anti-CD3–activated T cells derived from healthy human donors cocultured with EVs purified from A375, MCF7, and A549 cell lines or normal fibroblast HFF1 and WI-38 cell lines for 48 hours using [3H]-thymidine assays. data presented as means ± SD of T cells from three independent donors. *P < 0.05 and **P < 0.01 using one-way ANOVA with Dunnett’s post hoc test. (B) The images (left) show SA-β-gal staining for anti-CD3–activated CD4+ T cells derived from healthy donors cocultured with the indicated EVs purified from tumor cell lines or normal fibroblasts for 3 days. Arrows indicate SA-β-gal+ T cells. Scale bars, 40 μm. The plot (right) shows quantification of SA-β-gal+ T cells presented as means ± SD of T cells from three independent donors. *P < 0.05 and **P < 0.01 using one-way ANOVA with Dunnett’s post hoc test. (C and D) The plots (left) show flow cytometry analyses of CD28, P16, P21, and P53 expression in anti-CD3–activated CD4+ T cells cocultured with the indicated EVs for 3 days. The graphs (right) show quantification of positive T cells presented as means ± SD of T cells from three independent donors. *P < 0.05, **P < 0.01, and ***P < 0.001 using one-way ANOVA with Dunnett’s post hoc test. (E) The plots show inflammatory cytokine mRNA expression in activated CD4+ T cells cocultured with different types of the indicated EVs for 48 hours, measured by real-time qPcr. RNA expression was normalized to β-actin. data are presented as means ± SD of T cells from five to six healthy donors. *P < 0.05 and **P < 0.01 using one-way ANOVA with Dunnett’s post hoc test.
Fig. 2.
Fig. 2.. PD-L1 in tEVs is responsible for the induction of T cell senescence.
(A) The plots show quantification of SA-β-gal staining in anti-CD3–activated CD4+ T cells with different treatments, for both A375-EV–treated and MCF7-EV–treated conditions. Data presented as means ± SD from three independent donor T cells. **P < 0.01 and ***P < 0.001 using one-way ANOVA with Dunnett’s post hoc test. (B) Proteomic analysis is shown of protein fractions in tEVs purified from tumor cell lines A375, MCF7, and A549 with mass spectrometry. Numbers indicate the total or shared proteins identified from each cell type tEV. (C) Signaling pathways and functions of the shared 321 proteins among the three different tEVs were analyzed with the PANTHER classification system and are displayed in the pie chart. (D) PD-L1–related molecules and their interactions within the shared 321 tEV-derived proteins are shown using the STRING database analysis. (E) The plots show PD-L1 expression in tEVs after incubation with aldehyde/sulfate latex beads with flow cytometry analysis. (F) The plots show PD-1 expression in anti-CD3–activated CD4+ T cells treated with or without tEVs for 72 hours. Naïve CD4+ T cells were included as a control. (G) The plots show quantification of SA-β-gal+ T cells cultured with tEVs purified from tumor cell lines A375 and MCF7 transfected with CRISPR-Cas9 PD-L1−/−sgRNA (CRISPR-PD-L1) or control plasmid pLentiV2 (Lenti-CTR) for 3 days. Data presented are means ± SD of T cells from four independent donors. *P < 0.05 and **P < 0.01 using Student’s t test. (H) Flow cytometry analysis of CD28 expression in T cells cultured with tEVs purified from tumor cell lines A375 and MCF7 transfected with CRISPR-Cas9 PD-L1−/−sgRNA (CRISPR-PD-L1) or control plasmid pLentiV2 (Lenti-CTR) for 3 days. The plots (right) show quantification of positive T cells presented as means ± SD from three independent donors. *P < 0.05, **P < 0.01, and ***P < 0.001 using Student’s t test. (I) The plots show quantification of SA-β-gal+ T cells after 3-day culture with tEVs pretreated with or without anti-human PD-L1 neutralizing antibody or CD4+ T cells pretreated with or without anti-human PD-1 neutralizing antibody. Data are presented as means ± SD of T cells from three independent donors. *P < 0.05, **P < 0.01, and ***P < 0.001 using Student’s t test. (J) Flow cytometry analysis of CD28 expression in T cells after 3-day culture with tEVs pretreated with or without anti-human PD-L1 neutralizing antibody. Anti–PD-1 group refers to CD4+ T cells that were pretreated with or without anti-human PD-1 neutralizing antibody. The plots (right) show quantification of positive T cells presented as means ± SD from three independent donors. **P < 0.01 and ***P < 0.001 using Student’s t test. (K) The plot shows quantification of SA-β-gal+ T cells in anti-CD3–activated CD4+ T cells cultured in the 24-well plates precoated with recombinant human PD-L1 plus a goat anti-human immunoglobulin G Fc antibody for 3 or 5 days. Data presented as means ± SD of T cells from three independent healthy donors. **P < 0.01 using Student’s t test.
Fig. 3.
Fig. 3.. The DNA damage response and CREB signaling control T cell senescence induced by tEVs.
(A) The images show DNA strand breaks using the alkaline comet assay in anti-CD3–activated T cells cocultured with or without the indicated tEVs for 72 hours. Scale bars, 40 μm. (B) The plots show phosphorylated activation of ATM, H2AX, and CHK2 in CD4+ T cells cultured with tEVs from A375 and MCF7 tumor cells for 5 days with flow cytometry analysis. The graphs (right) show quantification of positive T cells presented as means ± SD from three independent donors. *P < 0.05 and **P < 0.01 using Student’s t test. (C) The plots show quantification of SA-β-gal+ T cells in anti-CD3–activated T cells pretreated with or without KU55933 overnight, then cocultured with tEVs for 3 days. Data presented are means ± SD from three independent experiments. *P < 0.05 and **P < 0.01 using Student’s t test. (D) The plots (top) show CD28 expression in anti-CD3–activated T cells pretreated with or without KU55933 overnight and analyzed by flow cytometry after culture with the indicated tEVs for 3 days. The graphs (bottom) show quantification results presented as means ± SD of T cells from three independent donors. **P < 0.01 using Student’s t test. (E) The plots show phosphorylated activation of CREB and PKA in CD4+ T cells cultured with tEVs from A375 and MCF7 tumor cells for 3 days using flow cytometry analysis. The graphs (right) show quantification results presented as means ± SD of T cells from three independent donors. **P < 0.01 using Student’s t test. (F and G) The plots show SA-β-gal staining in anti-CD3–activated T cells treated with or without the PKA inhibitor H89 [in (F), left and right] or the CREB inhibitor KG501 [in (G), top and bottom], then cocultured with tEVs for 3 days. Data presented are means ± SD of T cells from at least three independent donors. *P < 0.05, **P < 0.01, and ***P < 0.001 using Student’s t test. (H and I) The plots show p-CREB expression in treated T cells. tEVs purified from A375 and MCF7 tumor cells were pretreated with or without anti-human PD-L1 neutralizing antibody [in (H)] or CD4+ T cells were pretreated with or without KU55933 [in (I)] before their coculture for 3 days. The plots (the bottom) show quantification of positive T cells presented as means ± SD from three or four independent donors. *P < 0.05 and **P < 0.01 using Student’s t test.
Fig. 4.
Fig. 4.. tEVs promote excessive lipid metabolism in tEV-induced senescent T cells.
(A) The plots show gene expression of lipid metabolism–related enzymes evaluated by real-time qPCR in anti-CD3–activated CD4+ T cells cultured with tEVs. Gene expression was normalized to β-actin expression and adjusted to the expression amount in untreated CD4+ T cells (served as 1). Data shown are means ± SD of T cells from four or five independent donors. *P < 0.05 and **P < 0.01 using Student’s t test. (B and C) The plots show amounts of NBD [in (B)] and BODIPY FL C16 [in (C)] uptake by anti-CD3–activated CD4+ T cells determined by flow cytometry after culture with tEVs for 3 days. The quantification data (right) presented are means ± SD from three independent donors. **P < 0.01 and ***P < 0.001 using Student’s t test. (D) The images show filipin III staining for anti-CD3–activated CD4+ T cells (blue) cocultured with tEVs for 3 days and analyzed by fluorescence/bright light microscopy. Scale bars, 20 μm. The plots (right) show quantification of fluorescence of filipin III intensity using ImageJ and presented as means ± SD of T cells from three independent donors. *P < 0.05 and **P < 0.01 using Student’s t test. (E) Oil Red O staining (left) and quantification (right) are shown in anti-CD3–activated CD4+ T cells cocultured with tEVs for 3 days. Scale bars, 40 μm. Data shown are means ± SD from three independent experiments. **P < 0.01 using Student’s t test. (F) Staining (left) and quantification (right) with filipin III are shown in T cells pretreated with the cholesterol inhibitor SIM overnight and cultured with tEVs from A375 tumors (top right) and MCF7 tumors (bottom right) for 3 days. Scale bars, 20 μm. The quantification data shown are means ± SD of T cells from three independent donors. *P < 0.05 and **P < 0.01 using Student’s t test. (G and H) The plots show Oil Red O staining [in (G)] and SA-β-gal staining [in (H)] for anti-CD3–activated CD4+ T cells pretreated with the lipid metabolism inhibitors MAFP, AVA, or SIM overnight and then cocultured with tEVs for 3 days. Data shown are means ± SD of T cells from three healthy donors. *P < 0.05, **P < 0.01, and ***P < 0.001 using Student’s t test.
Fig. 5.
Fig. 5.. CREB signaling cooperates with STAT signaling to regulate lipid metabolism and senescence in T cells induced by tEVs.
(A) The plots show real-time qPCR analyses of mRNA expression of lipid metabolism–related enzymes in anti-CD3–activated CD4+ T cells cultured with anti-human PD-L1 antibody–pretreated tEVs for 48 hours. mRNA expression was normalized to β-actin expression and adjusted to the gene amount in untreated CD4+ T cells (served as 1). Data shown are means ± SD of T cells from at least three healthy donors. *P < 0.05 and **P < 0.01 using Student’s t test. (B) Filipin III staining for anti-CD3–activated CD4+ T cells cultured with anti–PD-L1–pretreated tEVs for 72 hours. Scale bars, 20 μm. The plots (right) show quantification of fluorescence of filipin III intensity using ImageJ and presented as means ± SD of T cells from three independent donors. **P < 0.01 using Student’s t test. (C) The plot shows Oil Red O staining analyses of anti-CD3–activated CD4+ T cells cultured with anti–PD-L1–pretreated tEVs for 72 hours. Data shown are means ± SD of T cells from three healthy donors. *P < 0.05 and **P < 0.01 using Student’s t test. (D) The plots show real-time PCR analyses of mRNA expression of lipid metabolism–related enzymes in anti-CD3–activated CD4+ T cells pretreated with CREB inhibitor KG501 overnight and then cocultured with tEVs for 48 hours. Data shown are means ± SD of T cells from three or four healthy donors. *P < 0.05 and **P < 0.01 using Student’s t test. (E) Filipin III staining for anti-CD3–activated CD4+ T cells pretreated with KG501 overnight and cultured with tEVs for 72 hours. Scale bars, 20 μm. The quantification data of fluorescence of filipin III intensity (right) shown are means ± SD of T cells from three independent donors. *P < 0.05, **P < 0.01, and ***P < 0.001 using Student’s t test. (F) The plots show Oil Red O staining analyses of anti-CD3–activated CD4+ T cells pretreated with KG501 overnight and cultured with tEVs for 72 hours. Data shown are means ± SD of T cells from three or four healthy donors. *P < 0.05, **P < 0.01, and ***P < 0.001 using Student’s t test. (G) The plots show expression of p-STAT1 and p-STAT3 in anti-CD3–activated CD4+T cells determined by flow cytometry after culture with tEVs for 48 hours. The quantification data (right) shown are means ± SD of T cells from three independent donors. *P < 0.05 and **P < 0.01 using Student’s t test. (H) The plots show SA-β-gal staining results of anti-CD3–activated CD4+ T cells pretreated with STAT1 inhibitor MTA or STAT3 inhibitor S3I-201 overnight and then cultured with tEVs for 72 hours. Data shown are means ± SD of T cells from three or four healthy donors. *P < 0.05, **P < 0.01, and ***P < 0.001 using Student’s t test. (I) Filipin III staining for anti-CD3–activated CD4+ T cells pretreated with STAT1 inhibitor MTA or STAT3 inhibitor S3I-201 overnight and then cultured with tEVs for 72 hours. Scale bars, 20 μm. The quantification data of fluorescence of filipin III intensity (right) shown are means ± SD of T cells from three independent donors. *P < 0.05 using Student’s t test. (J) The plots show Oil Red O staining for anti-CD3–activated CD4+ T cells pretreated with STAT1 inhibitor MTA or STAT3 inhibitor S3I-201 overnight and then cultured with tEVs for 72 hours. Data shown are means ± SD of T cells from three or four healthy donors. *P < 0.05, **P < 0.01, and ***P < 0.001 using Student’s t test. (K) Flow cytometry analyses of phosphorylation of STAT1/STAT3 in anti-CD3–activated CD4+ T cells cultured with anti-human PD-L1 antibody–pretreated tEVs for 48 hours. The quantification data (bottom) shown are means ± SD of T cells from three or four independent donors. *P < 0.05 and **P < 0.01 using Student’s t test. (L) Flow cytometry analyses of phosphorylation of STAT1/STAT3 in anti-CD3–activated CD4+ T cells pretreated with CREB inhibitor KG501 overnight and then cocultured with tEVs for 48 hours. The quantification data (bottom) shown are means ± SD of T cells from four independent donors. *P < 0.05, **P < 0.01, and ***P < 0.001 using Student’s t test.
Fig. 6.
Fig. 6.. tEVs promote T cell senescence with lipid accumulation in vivo.
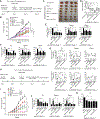
(A) A schematic representation of the adoptive transfer T cell model with tEV injection into Rag2−/− mice. Preactivated human CD3+ T cells (8 × 10⁶ per mouse) were adoptively transferred through intravenous injection into Rag2−/− mice. tEVs were purified from A375 and MCF7 cell lines with or without PD-L1 deletion and injected intravenously into mice (10 million cell-derived EVs per mouse). (B) The plots show SA-β-gal staining results of the transferred CD3+ T cells isolated from blood and spleens of the tEV-injected mice at day 12. Data shown are means ± SD (n = 5 mice per group). *P < 0.05, **P < 0.01, and ***P < 0.001 using Student’s t test. (C) The plots show the suppressive activity of the transferred CD3+ T cells isolated from blood and spleens of the tEV-injected mice at day 12 using [3H]-thymidine assays. Data shown are means ± SD (n = 5 mice per group). *P < 0.05 and ***P < 0.001 using Student’s t test. (D) Oil Red O staining analyses of the transferred CD3+ T cells isolated from blood and spleens of the tEV-injected mice at day 12. Data shown are means ± SD (n = 5 mice per group). **P < 0.01 and ***P < 0.001 using Student’s t test. (E) Filipin III staining for the transferred CD3+ T cells isolated from spleens of the tEV-injected mice at day 12. Scale bars, 25 μm. The quantification data of fluorescence of filipin III intensity (right) shown are means ± SD (n = 5 mice per group). **P < 0.01 and ***P < 0.001 using Student’s t test. (F) A schematic representation that blockages of PD-L1, CREB signaling, or lipid metabolism in T cells prevented T cell senescence mediated by tEVs in vivo in Rag2−/− mice. Activated CD3+ T cells were pretreated with or without KG501, AVA, or SIM overnight and then adoptively transferred through intravenous injection into Rag2−/− mice. tEVs purified from A375 cells were treated with or without an anti-human PD-L1 and then transferred through intravenous injection into mice every 3 days for a total of three times. Anti-human PD-L1, KG501, AVA, and SIM were also injected intraperitoneally into the mice at day 3, and then injections were continued every 3 days for a total of three times. Transferred T cells were isolated for analyses at day 12 after T cell injection. (G) The plots show SA-β-gal staining results for the transferred CD4+ and CD8+ T cells isolated from blood and spleens of the tEV-injected mice with different treatments at day 12. Data shown are means ± SD from pooled T cells (n = 5 mice per group). *P < 0.05, **P < 0.01, and ***P < 0.001 using one-way ANOVA with Dunnett’s post hoc test. (H) The plots show the suppressive activity of the transferred CD4+ and CD8+ T cells isolated from blood and spleens of the tEV-injected mice with different treatments at day 12 using [3H]-thymidine assays. Data shown are means ± SD from pooled T cells (n = 5 mice per group). *P < 0.05, **P < 0.01, and ***P < 0.001 using one-way ANOVA with Dunnett’s post hoc test. (I) Oil Red O staining analyses of the transferred CD4+ and CD8+ T cells isolated from blood and spleens of the tEV-injected mice with different treatments at day 12. Data shown are means ± SD (n = 5 mice per group). *P < 0.05, **P < 0.01, and ***P < 0.001 using one-way ANOVA with Dunnett’s post hoc test. (J) Filipin III staining for the transferred CD4+ and CD8+ T cells isolated from spleens of the tEV-injected mice at day 12. Scale bars, 25 μm. The quantification data of fluorescence of filipin III intensity (right) shown are means ± SD (n = 5 mice per group). **P < 0.01 and ***P < 0.001 using one-way ANOVA with Dunnett’s post hoc test.
Fig. 7.
Fig. 7.. Blockage of EV generation from tumor cells prevents effector T cell senescence and enhances antitumor efficacy mediated by tumor-specific T cells.
(A) A schematic representation of the experiment. Mouse B16F10 tumor cells were subcutaneously injected into C57BL/6 mice. Activated Pmel-1 T cells were adoptively transferred through intravenous injection into B16F10 tumor–bearing mice at day 6 after tumor inoculation. GW4869 was injected intratumorally or intraperitoneally into the mice every 3 days for a total of four times after T cell transfer to mice. (B) The plot shows tumor volumes as means ± SD (n = 4 mice per group). ***P < 0.001 using one-way ANOVA with Dunnett’s post hoc test. (C and D) The transferred Pmel-1 T cells were isolated from blood, spleens, and tumors in B16F10 tumor–bearing mice at day 26 after tumor injection and then stained for SA-β-gal [in (C)] and Oil Red O [in (D)]. Data shown are means ± SD (n = 4 mice per group). **P < 0.01 using Student’s t test. (E) A schematic representation of the experiment. Human A375/GP100 tumor cells were subcutaneously injected into nude mice. Activated Pmel-1 T cells were adoptively transferred through intravenous injection into A375/GP100 tumor–bearing mice at day 11 after tumor inoculation. An anti-human PD-L1 antibody was injected intraperitoneally into the mice every 3 days for a total of five times after T cell transfer to mice. (F) The plot shows tumor volumes as means ± SD (n = 4 or 5 mice per group). *P < 0.05 using one-way ANOVA with Dunnett’s post hoc test. (G) Representative tumor sizes from different groups in tumor-bearing mice are presented. (H) Tumor weights are presented as means ± SD from the indicated groups (n = 4 or 5 mice per group) at the end point of the experiments. *P < 0.05 and ***P < 0.001 using Student’s t test. (I and J) The transferred Pmel-1 T cells were isolated from blood, spleens, and tumors in A375/GP100 tumor–bearing mice at day 32 after tumor injection and then stained for SA-β-gal [in (I)] and Oil Red O [in (J)]. Data shown are means ± SD (n = 4 or 5 mice per group). *P < 0.05, **P < 0.01, and ***P < 0.001 using Student’s t test.
Fig. 8.
Fig. 8.. Reversal of effector T cell senescence by inhibiting CREB signaling and lipid metabolism enhances antitumor efficacy mediated by tumor-specific T cells and anti–PD-L1 checkpoint immunotherapy.
(A) Schematic representation of the experiment. Human A375/GP100 tumor cells were subcutaneously injected into nude mice. Activated Pmel-1 T cells were pretreated overnight with or without 666–15 or SIM and then adoptively transferred through intravenous injection into A375/GP100 tumor–bearing mice at day 11 after tumor inoculation. Anti-human PD-L1 antibody, 666–15, or SIM was injected intraperitoneally into the mice every 3 days for a total of six times after T cell transfer to mice. (B) The plot shows tumor volumes presented as means ± SD (n = 4 to 7 mice per group). *P < 0.05 and ***P < 0.001 using one-way ANOVA with Dunnett’s post hoc test. (C) Representative tumor sizes from different groups in tumor-bearing mice are presented. (D)Tumor weights are presented as means ± SD (n = 4 to 7 mice per group) at the end point of the experiments. *P < 0.05, **P < 0.01, and ***P < 0.001 using one-way ANOVA with Dunnett’s post hoc test. (E) The plots show the SA-β-gal staining analyses of the transferred Pmel-1 T cells isolated from blood, spleens, and tumors in A375/GP100 tumor–bearing mice at day 31. Data shown are means ± SD (n = 4 to 7 mice in each group). P < 0.05, **P < 0.01, and ***P < 0.001, using the one-way ANOVA with Dunnett’s post hoc test. (F) Oil Red O staining analyses of the transferred Pmel-1 T cells isolated from blood, spleens, and tumors in A375/GP100 tumor–bearing mice at day 31. Data shown are means ± SD (n = 4 to 7 mice per group). P < 0.05, **P < 0.01, and ***P < 0.001 using one-way ANOVA with Dunnett’s post hoc test. (G) Flow cytometry analyses of IFN-γ and perforin production in the transferred Pmel-1 T cells isolated from blood, spleens, and tumors in A375/GP100 tumor–bearing mice at day 31. Data shown are means ± SD (n = 4 to 7 mice per group). P < 0.05, **P < 0.01, and ***P < 0.001 using one-way ANOVA with Dunnett’s post hoc test. (H) A schematic representation of the experiment. Mouse B16F10 tumor cells were subcutaneously injected into C57BL/6 mice. Activated Pmel-1 T cells were adoptively transferred through intravenous injection into B16F10 tumor–bearing mice at day 6 after tumor inoculation. Anti-mouse PD-L1 antibody, 666–15, or SIM was injected intraperitoneally into the mice at days 1, 4, 7, and 10 after T cell transfer to mice. (I) The plot shows tumor volumes presented as means ± SD (n = 5 mice per group). *P < 0.05 and ***P < 0.001 using one-way ANOVA with Dunnett’s post hoc test. (J) The plots show the SA-β-gal staining analyses of the transferred Pmel-1 T cells isolated from blood, spleens, and tumors in B16F10 tumor–bearing mice at day 22. Data shown are means ± SD (n = 5 mice per group). *P < 0.05, **P < 0.01, and ***P < 0.001 using one-way ANOVA with Dunnett’s post hoc test. (K) Oil Red O staining analyses of the transferred Pmel-1 T cells isolated from tumors in B16F10 tumor–bearing mice at day 22. Data shown are means ± SD (n = 5 mice per group). **P < 0.01 using one-way ANOVA with Dunnett’s post hoc test.

References

    1. Rosenberg SA, Overcoming obstacles to the effective immunotherapy of human cancer. Proc. Natl. Acad. Sci. U.S.A. 105, 12643–12644 (2008). - PMC - PubMed
    1. Cagnoni AJ, Giribaldi ML, Blidner AG, Cutine AM, Gatto SG, Morales RM, Salatino M, Abba MC, Croci DO, Mariño KV, Rabinovich GA, Galectin-1 fosters an immunosuppressive microenvironment in colorectal cancer by reprogramming CD8+ regulatory T cells. Proc. Natl. Acad. Sci. U.S.A. 118, e2102950118 (2021). - PMC - PubMed
    1. DePeaux K, Delgoffe GM, Metabolic barriers to cancer immunotherapy. Nat. Rev. Immunol. 21, 785–797 (2021). - PMC - PubMed
    1. Porta C, Consonni FM, Morlacchi S, Sangaletti S, Bleve A, Totaro MG, Larghi P, Rimoldi M, Tripodo C, Strauss L, Banfi S, Storto M, Pressiani T, Rimassa L, Tartari S, Ippolito A, Doni A, Soldà G, Duga S, Piccolo V, Ostuni R, Natoli G, Bronte V, Balzac F, Turco E, Hirsch E, Colombo MP, Sica A, Tumor-derived prostaglandin E2 promotes p50 NF-κB-dependent differentiation of monocytic MDSCs. Cancer Res. 80, 2874–2888 (2020). - PubMed
    1. Zhai L, Bell A, Ladomersky E, Lauing KL, Bollu L, Nguyen B, Genet M, Kim M, Chen P, Mi X, Wu JD, Schipma MJ, Wray B, Griffiths J, Unwin RD, Clark SJ, Acharya R, Bao R, Horbinski C, Lukas RV, Schiltz GE, Wainwright DA, Tumor cell IDO enhances immune suppression and decreases survival independent of tryptophan metabolism in glioblastoma. Clin. Cancer Res. 27, 6514–6528 (2021). - PMC - PubMed

Substances