. 2025 Feb 14;11(7):eado9455.
doi: 10.1126/sciadv.ado9455. Epub 2025 Feb 12.

Gut IgA functionally interacts with systemic IgG to enhance antipneumococcal vaccine responses

Affiliations

Gut IgA functionally interacts with systemic IgG to enhance antipneumococcal vaccine responses

Cindy Gutzeit et al. Sci Adv. .

Abstract

The gut microbiota enhances systemic immunoglobulin G (IgG) responses to vaccines, but it is unknown whether this effect involves IgA, which coats intestinal microbes. That IgA may amplify postimmune IgG production is suggested by the impaired IgG response to pneumococcal vaccines in some IgA-deficient patients. Here, we found that antipneumococcal but not total IgG production was impaired in mice with IgA deficiency. The positive effect of gut IgA on antipneumococcal IgG responses started very early in life and could implicate gut bacteria, as these responses were attenuated in germ-free mice recolonized with gut microbes from IgA-deficient donors. IgA could exert this effect by constraining the systemic translocation of gut antigens, which was associated with chronic immune activation, including T cell overexpression of programmed cell death protein 1 (PD-1). This inhibitory receptor may attenuate antipneumococcal IgG production by causing B cell hyporesponsiveness, which improved upon anti-PD-1 treatment. Thus, gut IgA functionally interacts with systemic IgG to enhance antipneumococcal vaccine responses.


Figures

Fig. 1.
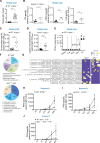
Fig. 1.. IgA increases systemic IgG responses to TD immunogens, including protein-conjugated pneumococcal vaccine.
(A) ELISA of plasma IgG1 to PPS from five WT or seven Igha−/− mice prior to immunization (PI) and following Prevnar13 intravenously. (B) Flow cytometry of intracellular (ic) and extracellular (ec) IgG1 from splenic ecIgG1+icIgG1 SBCs, ecIgG1+icIgG1+ plasmablasts (PBs), and ecIgG1loicIgG1+ PCs of representative WT or Igha−/− mice 28 days following Prevnar13 intravenously. Numbers indicate frequency of B220+ cells. (C) ELISA of plasma high- [NP7–bovine serum albumin (BSA)] and low-affinity (NP23-BSA) IgG1 and (D) IgG1 affinity maturation calculated as optical density (OD) ratio of high- and low-affinity IgG1 in 13 WT or 11 Igha−/− mice following NP15-OVA and aluminum hydroxide and magnesium hydroxide (alum) intraperitoneally. (E and F) Steady-state flow cytometry of CD21lowCD23high splenic FO B cells from representative WT or Igha−/− mice (E), frequency of CD19+ cells, and absolute number from 10 WT or 11 Igha−/− mice (F). (G and H) Flow cytometry of IgG1+B220+ cells from splenic B cells of representative WT or Igha−/− mice incubated with medium alone (ctrl) or anti-CD40 and IL-4 for 6 days (G) and frequency of live cells from 6 WT or Igha−/− mice (H). (I and J) Flow cytometry of B220+CD138+ PCs from splenic B cells of representative WT or Igha−/− mice incubated as in (G) (I) and frequency of live cells (J). (K) IgG1 ELISA from four WT or Igha−/− mice incubated as in (G). Data show representative mice [(B), (E), (G), and (I)], are representative of two experiments (F), or summarize results from either two [(A), (C), (D), and (K)] or three experiments [(H) and (J)]. Results are shown with mean [(A) and (F)] or mean ± SEM [(C), (D), (H), (J), and (K)]; two-tailed unpaired Student’s t test used for normally distributed data otherwise Mann-Whitney test. *P < 0.05, **P < 0.01, and ***P <0.001. d7, day 7; AU, arbitrary units.
Fig. 2.
Fig. 2.. IgA restrains preimmune IgG responses, including responses targeting gut commensal antigens.
(A) ELISA of total steady-state plasma IgG1 from 20 WT or 27 Igha−/− mice. (B) ELISA of steady-state plasma IgG1 to LTA from S. aureus, CPS14 from S. pneumoniae, or LPS from S. typhimurium in eight Igha+/+ or six Igha−/− littermate mice. (C and D) ELISA of plasma IgG1 to paired small intestine (SI) (C) or colon (D) fecal bacteria obtained from 8 to 12 WT or 8 to 10 Igha−/− mice. (E) Quantification of colony-forming units (CFUs) of anaerobic bacteria in homogenates of spleen, liver, mesenteric lymph nodes (MLNs), mesenteric adipose tissue (MAT), and SI from 8 to 13 WT or 9 to 13 Igha−/− mice. (F) Taxonomic classification of anaerobic bacterial colonies isolated from MAT from two WT or seven Igha−/− mice by mass spectrometry. (G) Top 10 differentially abundant amplicon sequence variants between six WT and seven Igha−/− cohoused littermate mice using analysis of composition of microbiomes (ANCOM) (P < 0.05) on 16S rRNA gene sequences of colonic feces. (H) ELISA of IgG1 to PPS from 9 WT mice or 10 Pigr−/− mice PI and following Prevnar13 intraperitoneally. (I) ELISA of IgG1 to PPS from 11 Igha+/+ or 16 Igha−/− cohoused littermate mice from Igha+/− parents PI and following Prevnar13 intraperitoneally. (J) ELISA of IgG1 to PPS PI or following intraperitoneal immunization with Prevnar13 of ex-GF mice 2 weeks after reconstitution of six to seven GF recipient mice with specific pathogen–free WT or Igha−/− cecal content. Results summarize five [(A), (E), and (F)], one [(B), (G), and (J)], or two [(C), (D), (H), and (I)] independent experiments. Data are presented with mean [(A) to (E)] or as mean ± SEM [(H) to (J)]; two-tailed unpaired Student’s t test used for normally distributed data otherwise Mann-Whitney test. *P < 0.05, **P < 0.01, ***P <0.001, and ****P < 0.0001.
Fig. 3.
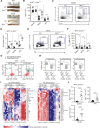
Fig. 3.. IgA restrains IgG1+ GC B cell expansion and IgG1+ PC differentiation.
(A) Images of PPs and MLNs from representative WT or Igha−/− mice. (B) Total cells in spleen, MLNs, and PPs from 11 to 19 WT or 12 to 20 Igha−/− mice. (C and D) Flow cytometry of splenic CD95+GL7+ GC B cells (live CD45+B220+ cells) from representative WT or Igha−/− mice (C) and absolute numbers in spleen, MLNs, and PPs from seven to eight WT or 8 Igha−/− mice. (E and F) PD-1+CXCR5+ TFH cells (CD45+CD19TCRβ+CD4+ cells) from MLNs of representative WT or Igha−/− mice (E) and absolute numbers in spleen, MLNs, and PPs from 10 to 11 WT or 11 Igha−/− mice (F). (G) Volcano plot of differentially expressed genes (DEGs) identified by RNA-seq in splenic MZ and FO B cell from four to five WT or five Igha−/− mice. (H) Gene set variation analysis (GSVA) of proliferation (G2-M checkpoint) and GC and PC differentiation gene signatures identified by RNA-seq as in (G). (I) Heatmap of z score for top 30 DEGs related to GC (left) and PC differentiation (right) gene sets identified by RNA-seq as in (G). Asterisks indicate DEGs discussed in the text. The scale bar shows color coding for z score. (J) Absolute numbers of IgG1+ PCs (IgDloCD45+; fig. S4B) in spleen, MLNs, and PPs from 14 WT or Igha−/− mice. Data show representative images or flow plots [(A), (C), and (E)], summarize two (J), three (D), six (B), or one [(G) to (I)] independent experiments, or summarize three experiments representative of five (F). Data presented with mean [(B), (D), and (F)], median (J), or mean GSVA score and 95% confidence interval (H); two-tailed unpaired Student’s t test used for normally distributed data otherwise Mann-Whitney test or limma modeling (H). *P < 0.05, **P < 0.01, ***P <0.001, and ****P < 0.0001.
Fig. 4.
Fig. 4.. IgA constrains activation-induced T cell expression of the immune inhibitor PD-1, and anti–PD-1 improves postimmune IgG production in IGAD.
(A) GSVA of anergy gene signature identified by RNA-seq from splenic MZ and FO B cells from four to five WT or five Igha−/− mice at steady state. (B) Heatmap shows gene expression for top 30 DEGs from anergy gene set in (A). Asterisks indicate DEGs discussed in the text. The scale bar shows color coding for z score. (C) Absolute numbers of splenic PD-1+CD4+ (top) or PD-1+CD8+ (bottom) total (left) or antigen-experienced CD44+ (right) T cells from 14 WT or Igha−/− mice determined by flow cytometry. (D) PD-L1 [mean fluorescence intensity (MFI)] on splenic MZ B, FO B, total B-1, B-1a, and B-1b cells from five WT or six Igha−/− mice. (E) ELISA of plasma IgG1 to PPS PI and following Prevnar13 intraperitoneally of seven to eight WT or Igha−/− mice treated with anti–PD-1 or isotype control (ctrl) 1 day before and after immunization, followed by every third day through day 19. Results summarize one [(A), (B), and (D)] or two (C) independent experiments or show one experiment representative of two (E). Data are presented with mean GSVA score and 95% confidence interval (A), median (C), mean (D), or mean and SEM (E). Significance was determined using limma modeling (A) or Mann-Whitney test [(C) to (E)]. *P < 0.05, **P < 0.01, ***P < 0.005, and ****P < 0.001. In (E), # compares isotype ctrl WT and isotype ctrl Igha−/−, * compares isotype ctrl Igha−/− and anti–PD-1 Igha−/−, compares anti−PD-1 WT and anti–PD-1 Igha−/−, and compares WT isotype ctrl and anti–PD-1 WT.
Fig. 5.
Fig. 5.. IgA constrains the systemic translocation of gut commensal antigens.
(A) Frequency (%) of circulating B cells with hyporesponsive-anergic IgMloCD21lo phenotype within total IgD+CD27 naive B cell population from 17 HCs and 12 IgA-deficient (IGAD) patients. (B) ELISA of soluble (s)CD14 in plasma from 18 HCs and 15 patients with IGAD. (C) Quantitative PCR of bacterial 16S rDNA in plasma from 18 HCs and 15 patients with IGAD. (D) ELISA of IgG to LPS from E. coli in plasma from 18 HCs and 15 patients with IGAD. (E) Proposed model depicting the impact of gut IgA on systemic IgG responses to pneumococcal vaccines. Compared to the IgA-sufficient gut (left), the IgA-deficient gut (right) experiences increased penetration of viable gut commensals into the MAT due to the defective immune exclusion of intraluminal bacteria. The resulting peripheral penetration of soluble commensal antigens from MAT-based bacteria starts at an early age and leads to the chronic stimulation of the immune system, including B and T cells. B cells release progressively increasing amounts of IgG to gut commensal antigens (left inset), whereas T cells up-regulate PD-1 expression (right inset), respectively. Persistent B cell stimulation by gut antigens combined with enhanced B cell inhibitory signals from PD-1 could cause the functional exhaustion of systemic B cells, which would then become hyporesponsive to neoantigens from pneumococcal vaccines. Results summarize one experiment with multiple biological replicates. Data are presented with mean and significance determined using Mann-Whitney test. *P < 0.05 and **P < 0.01. (E) was created in BioRender.com.

References

    1. Belkaid Y., Hand T. W., Role of the microbiota in immunity and inflammation. Cell 157, 121–141 (2014). - PMC - PubMed
    1. De Jong S. E., Olin A., Pulendran B., The impact of the microbiome on immunity to vaccination in humans. Cell Host Microbe 28, 169–179 (2020). - PMC - PubMed
    1. Chen K., Magri G., Grasset E. K., Cerutti A., Rethinking mucosal antibody responses: IgM, IgG and IgD join IgA. Nat. Rev. Immunol. 20, 427–441 (2020). - PMC - PubMed
    1. Bunker J. J., Flynn T. M., Koval J. C., Shaw D. G., Meisel M., McDonald B. D., Ishizuka I. E., Dent A. L., Wilson P. C., Jabri B., Antonopoulos D. A., Bendelac A., Innate and adaptive humoral responses coat distinct commensal bacteria with immunoglobulin A. Immunity 43, 541–553 (2015). - PMC - PubMed
    1. Grasset E. K., Chorny A., Casas-Recasens S., Gutzeit C., Bongers G., Thomsen I., Chen L., He Z., Matthews D. B., Oropallo M. A., Veeramreddy P., Uzzan M., Mortha A., Carrillo J., Reis B. S., Ramanujam M., Sintes J., Magri G., Maglione P. J., Cunningham-Rundles C., Bram R. J., Faith J., Mehandru S., Pabst O., Cerutti A., Gut T cell-independent IgA responses to commensal bacteria require engagement of the TACI receptor on B cells. Sci. Immunol. 5, eaat7117 (2020). - PMC - PubMed

MeSH terms