. 2025 Mar-Apr;18(2):225-234.
doi: 10.1016/j.brs.2025.02.001. Epub 2025 Feb 10.

Controlling the local extracellular electric field can suppress the generation and propagation of seizures and spikes in the hippocampus

Affiliations

Controlling the local extracellular electric field can suppress the generation and propagation of seizures and spikes in the hippocampus

Muthumeenakshi Subramanian et al. Brain Stimul. 2025 Mar-Apr.

Abstract

Objective: Neural activity such as theta waves, epileptic spikes and seizures can cross a physical transection using electric fields thus propagating by ephaptic coupling and independently of synaptic transmission. Recruitment of neurons in epilepsy occurs in part due to electric field coupling in addition to synaptic mechanisms. Hence, controlling the local electric field could suppress or cancel the generation of these epileptic events.

Methods: 4-aminopyridine (4-AP) was used to induce spontaneous epileptic spikes and seizures in longitudinal hippocampal slices in-vitro. Two extracellular recording electrodes were placed in the tissue, one at the edge of the slice on the temporal side at the focus of the epileptic activity and the other on the septal side to record the propagation. Two stimulating electrodes were placed outside the slice at the edge of the focal zone. An extracellular voltage clamp circuit maintained the voltage within the focus at 0V with respect to the bath ground.

Results: Experiments showed that 100 % of the epileptic activity originated at the temporal region and propagated to the septal region of the slices thereby establishing the existence of a focus in the temporal end of the tissue. The clamp achieved 100 % suppression of all seizure activity in the tissue with current amplitudes between 70 and 250 nA. No spikes or seizures were observed in either the focus or the septal region when the clamp was "on". When the clamp was turned off, both the spikes and seizure events recovered immediately.

Conclusions: The experiments show that controlling the extracellular voltage within a focus can prevent the generation and the propagation of epileptiform activity from the focus with very low amplitudes currents.


Conflict of interest statement

Declaration of competing interest The authors declare that there are no conflicts of interest regarding the publication of this article.

Figures

Fig. 1.
Fig. 1.
Detection of a focus in the temporal region: (A) Longitudinal hippocampal slice with two recording electrodes Rec1 and Rec2 showing origin of 4-aminopyridine induced epileptic events originating at the temporal edge 100 percent of the time and propagating to the septal side. (B) Example of induced epileptic seizures propagating from Rec1 to Rec2 (C) Example of induced epileptic spikes propagating from Rec1 to Rec2 (D) Significant difference between the number of seizures that originated from the temporal region at 8.75 ± 5.5 and zero seizures that originated from the septal origin. (E) Significant difference between the number of spikes that originated from the temporal region at 93.6 ± 36.9 and zero spikes that originated from the septal origin (***p < 0.001, n = 9).
Fig. 2.
Fig. 2.
Effect of voltage clamping of the focus on seizure activity (A) Representation of induced seizures and completely suppressed baseline activity, seizures come back immediately once the clamp is turned off, traces from each condition, they are not continuous in time (longer than represented here). (B) Zoomed in image showing propagation of seizures from Rec1 to Rec2 temporal to septal side of the hippocampal slice. (C) Extracellular clamp set up showing stimulating electrodes in line with Rec 1. (D) Significant difference between number of seizures before clamp and stim on conditions (n = 4; p < 0.05), no significant difference between before and after clamp conditions. (E) Significant difference between amplitude before clamp and stim on, no significant difference between baseline and post clamp. (*p < 0.05, ***<0.001, n = 9).
Fig. 3.
Fig. 3.
Effect of voltage clamping of the focus on interictal spikes (A) Both the spikes in the focal region (Rec1) and propagating spikes (Rec2) are suppressed with clamp ON, traces from each condition, they are not continuous in time (longer than represented here). (B) Zoomed in image showing propagation of spikes from Rec1 to Rec2 temporal to septal side of the hippocampal slice. (C) Extracellular clamp set up showing stimulating electrodes lined up with Rec 1. (D) Significant difference between number of spikes before clamp and stim on conditions (n = 9; p < 0.05). (E) Significant difference between spike amplitude before clamp and stim on, no significant difference between before and post clamp.
Fig. 4.
Fig. 4.
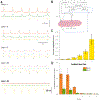
Effect of loop gain on the suppression. The extracellular voltages at Rec1, Rec2 are shown in orange and green while the applied current is shown in yellow. (A) Feedback loop gain values ranging from 1 to 50 increased the suppression effect. The current applied (yellow) has no effect at gain 1 at an average of 0.005 ± 0.001 μA and increases progressively to maximum current at an average of 0.26 ± 0.07 μA when the gain value was 50. (B) Extracellular voltage clamp system to control the local Electric Field. (C) Histogram of current values with maximum at gain 50 and minimum at gain 1. (D) Histogram of corresponding amplitude of spikes at Rec 1 and Rec2 with maximum amplitude at gain 1 and minimum at gain 50 (n = 9 slices).
Fig. 5.
Fig. 5.
Effect of electrode position and polarity (A) Case (a) where the recording electrode was positioned away (“stim away”) from the temporal edge of the slice but still within the somatic layer, the clamp reduced the amplitude of the spikes at Rec1 and Rec2 but did not achieve complete suppression (B) Case (b) where the stimulating electrode S1-S2 polarity was reversed which worsened the condition by increasing the spike amplitude instead of spike suppression. Significant difference were observed between cathodic stimulation (“original stimulation”) and anodic stimulation (“reversed stimulation”)(*p < 0.05, ***p < 0.001, n = 6)).
Fig. 6.
Fig. 6.
Clamping applied to the transverse hippocampal slice (A) Transverse hippocampus slice with two recording electrodes Rec 1 and Rec 2, stimulating electrode set up for the clamp (B) Induced spikes from the CA3 region are in Rec 1 (orange) propagating to CA1 region in Rec 2 (green). With the clamp turned ON, the spikes were suppressed from generating and propagating to Rec 2 (Traces from each condition as examples are not continuous in time and longer than represented here) (C) There was a significant difference between the amplitude of the spikes before clamp and during clamp (p,0.001). No significant difference between before clamp and after clamp spike amplitudes (p < 0.05). (D) There was a significant difference between the number of spikes before clamp and during clamp average of 104 ± 25 and 105 ± 29 spikes respectively (p < 0.01, N = 9). No difference between before and after clamp, average number of spikes of 104 ± 25 and 105 ± 29 spikes respectively. (E) Evoked potentials are recorded in baseline condition (purple) by stimulating the mossy fibers that synapse at the CA3 region, LTP is induced by 100 Hz stimulation (green) and then the clamp is turned on for 5 min. Post-clamp evoked potential shows how LTP is still preserved (orange). (F) Post-LTP evoked potential shows increased mean amplitude of 0.76 ± 0.27 mV from the baseline 0.37 ± 0.12 mV and still preserved after clamp stimulation at 0.75 ± 0.24 mV. There is also a significant slope increase between baseline and post-LTP mean slope from 0.1 ± 0.02 to 0.3 ± 0.07 mV/ms (p < 0.05, N = 9), no significant difference between post-LTP and post-clamp slope values.
Fig. 7.
Fig. 7.
Applied current doesn’t cancel downstream event (A) Signal suppression achieved at 70 nA injected feedback current (via Clamp). (B) Injected 300 nA, 10 Hz sinusoid signal decaying as a function of orthogonal distance relative to cathode stim in 4-AP-ACSF solution. Signal becomes indistinguishable from noise at 3.2 mm. (C) Case (a); Stimulating electrodes positioned at the septal edge of the slice: the clamp reduced the amplitude of the spikes at Rec2 (green) but not Rec1 (orange). Source activity (at temporal edge) is unaffected by clamping.(***p < 0.001, n = 6).

Similar articles

References

    1. Weiss SA, Faber DS. Field effects in the CNS play functional roles. Front Neural Circ 2010;4:1–10. - PMC - PubMed
    1. Gloor P, Vera CL, Sperti L. Electrophysiological studies of hippocampal neurons I. Configuration and laminar analysis of the “resting” potential gradient, of the main-transient response to perforant path, fimbrial and mossy fiber volleys and of “spontaneous” activity. Electroencephalogr Clin Neurophysiol 1963;15:353–78. - PubMed
    1. Green JD, Petsche H. Hippocampal electrical activity IV. Abnormal electrical activity. Electroencephalogr Clin Neurophysiol 1961;13:868–79.
    1. Jefferys JGR. Nonsynaptic modulation of neuronal activity in the brain: electric currents and extracellular ions. Physiol Rev 1995;75:689–723. - PubMed
    1. Swann JW, Brady RJ, Friedman RJ, Smith EJ. The dendritic origins of penicillin-induced epileptogenesis in CA3 hippocampal pyramidal cells. J Neurophysiol 1986;56:1718–38. - PubMed

Substances