. 2025 Mar-Apr;18(2):280-286.
doi: 10.1016/j.brs.2025.02.007. Epub 2025 Feb 10.

Statistical method accounts for microscopic electric field distortions around neurons when simulating activation thresholds

Affiliations

Statistical method accounts for microscopic electric field distortions around neurons when simulating activation thresholds

Konstantin Weise et al. Brain Stimul. 2025 Mar-Apr.

Abstract

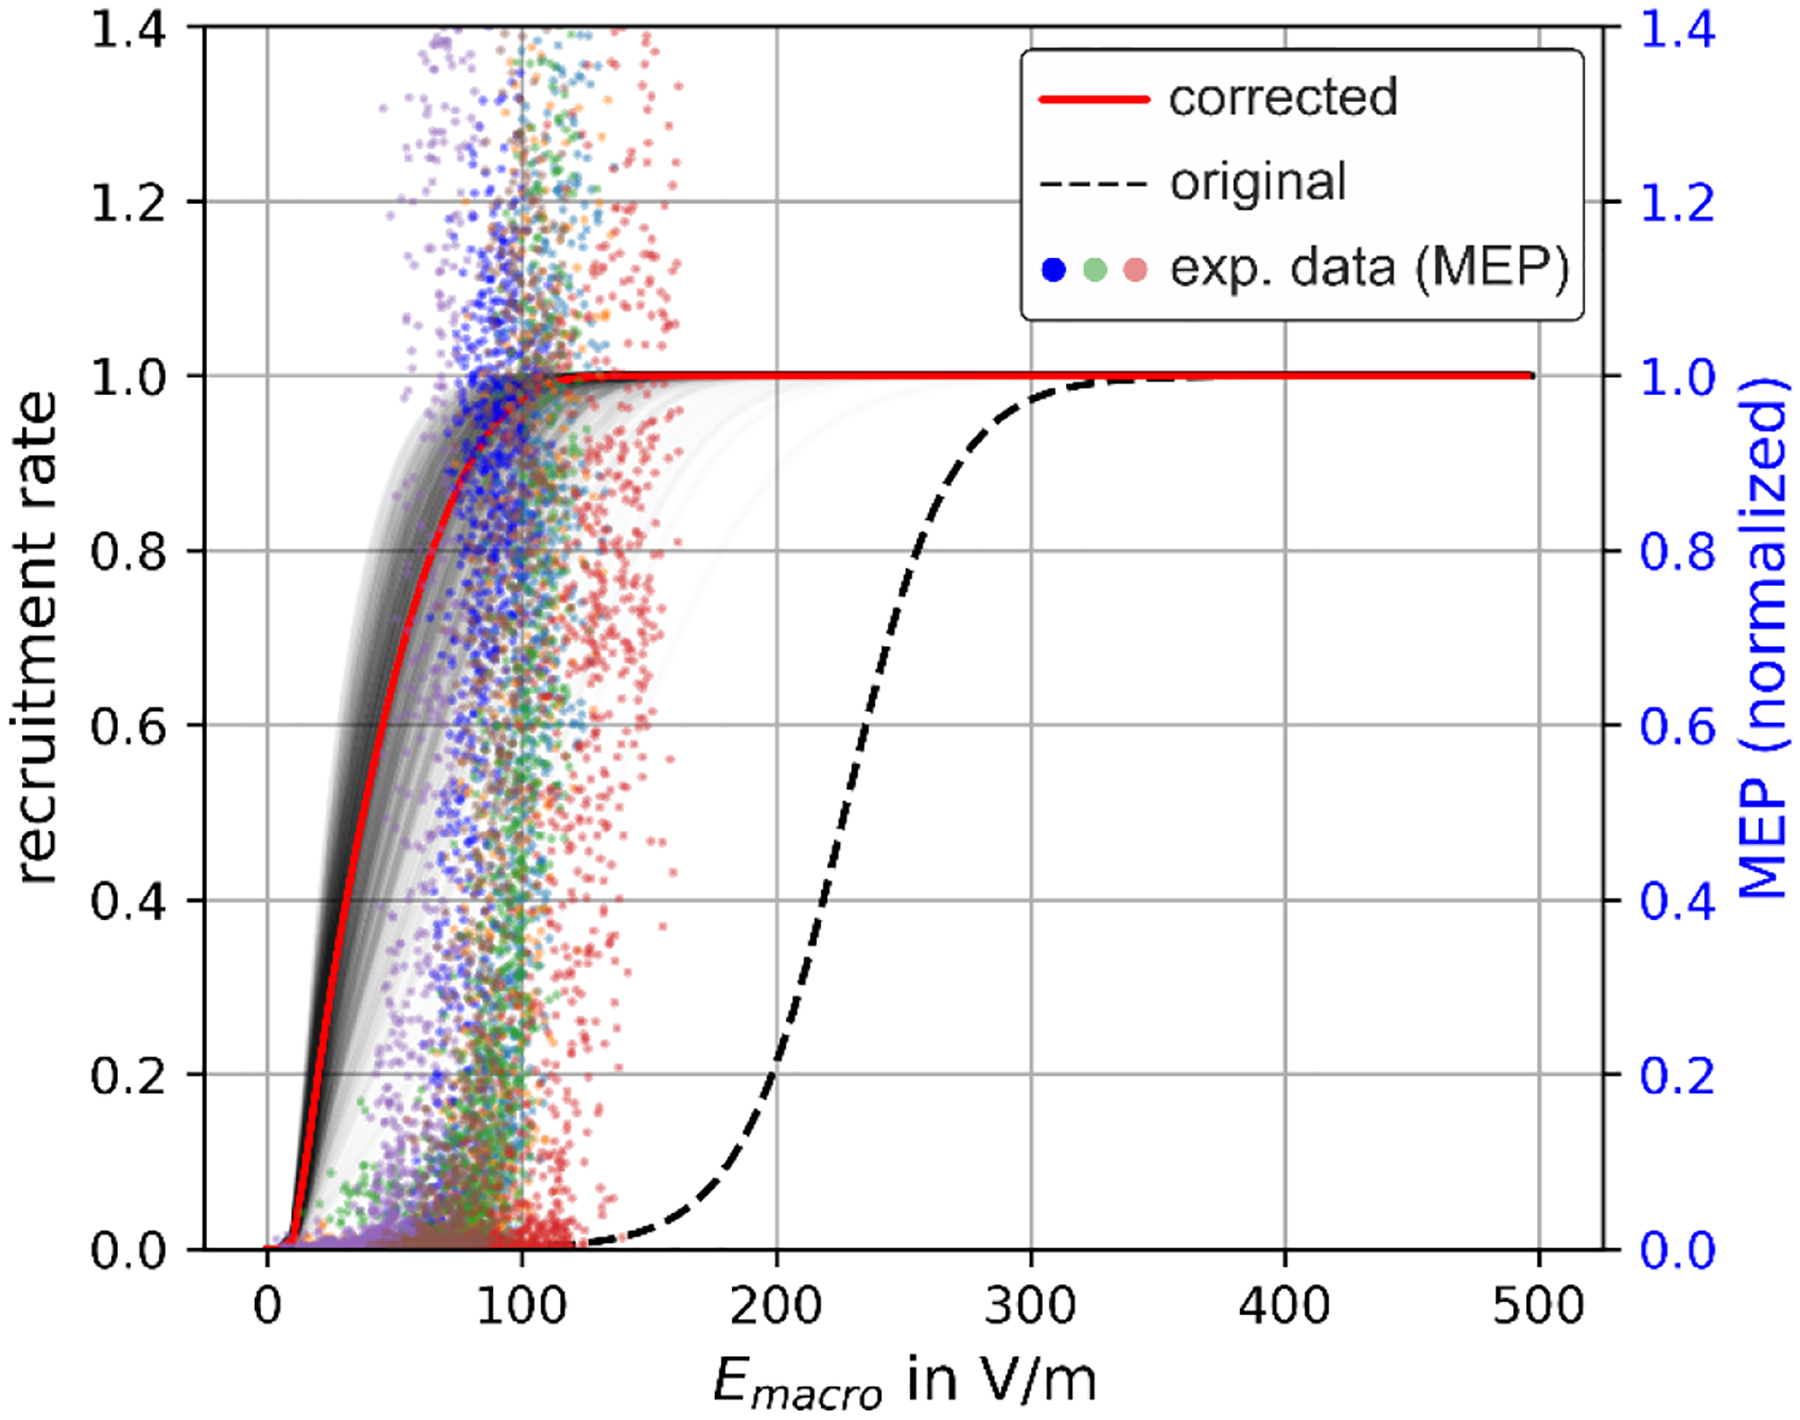
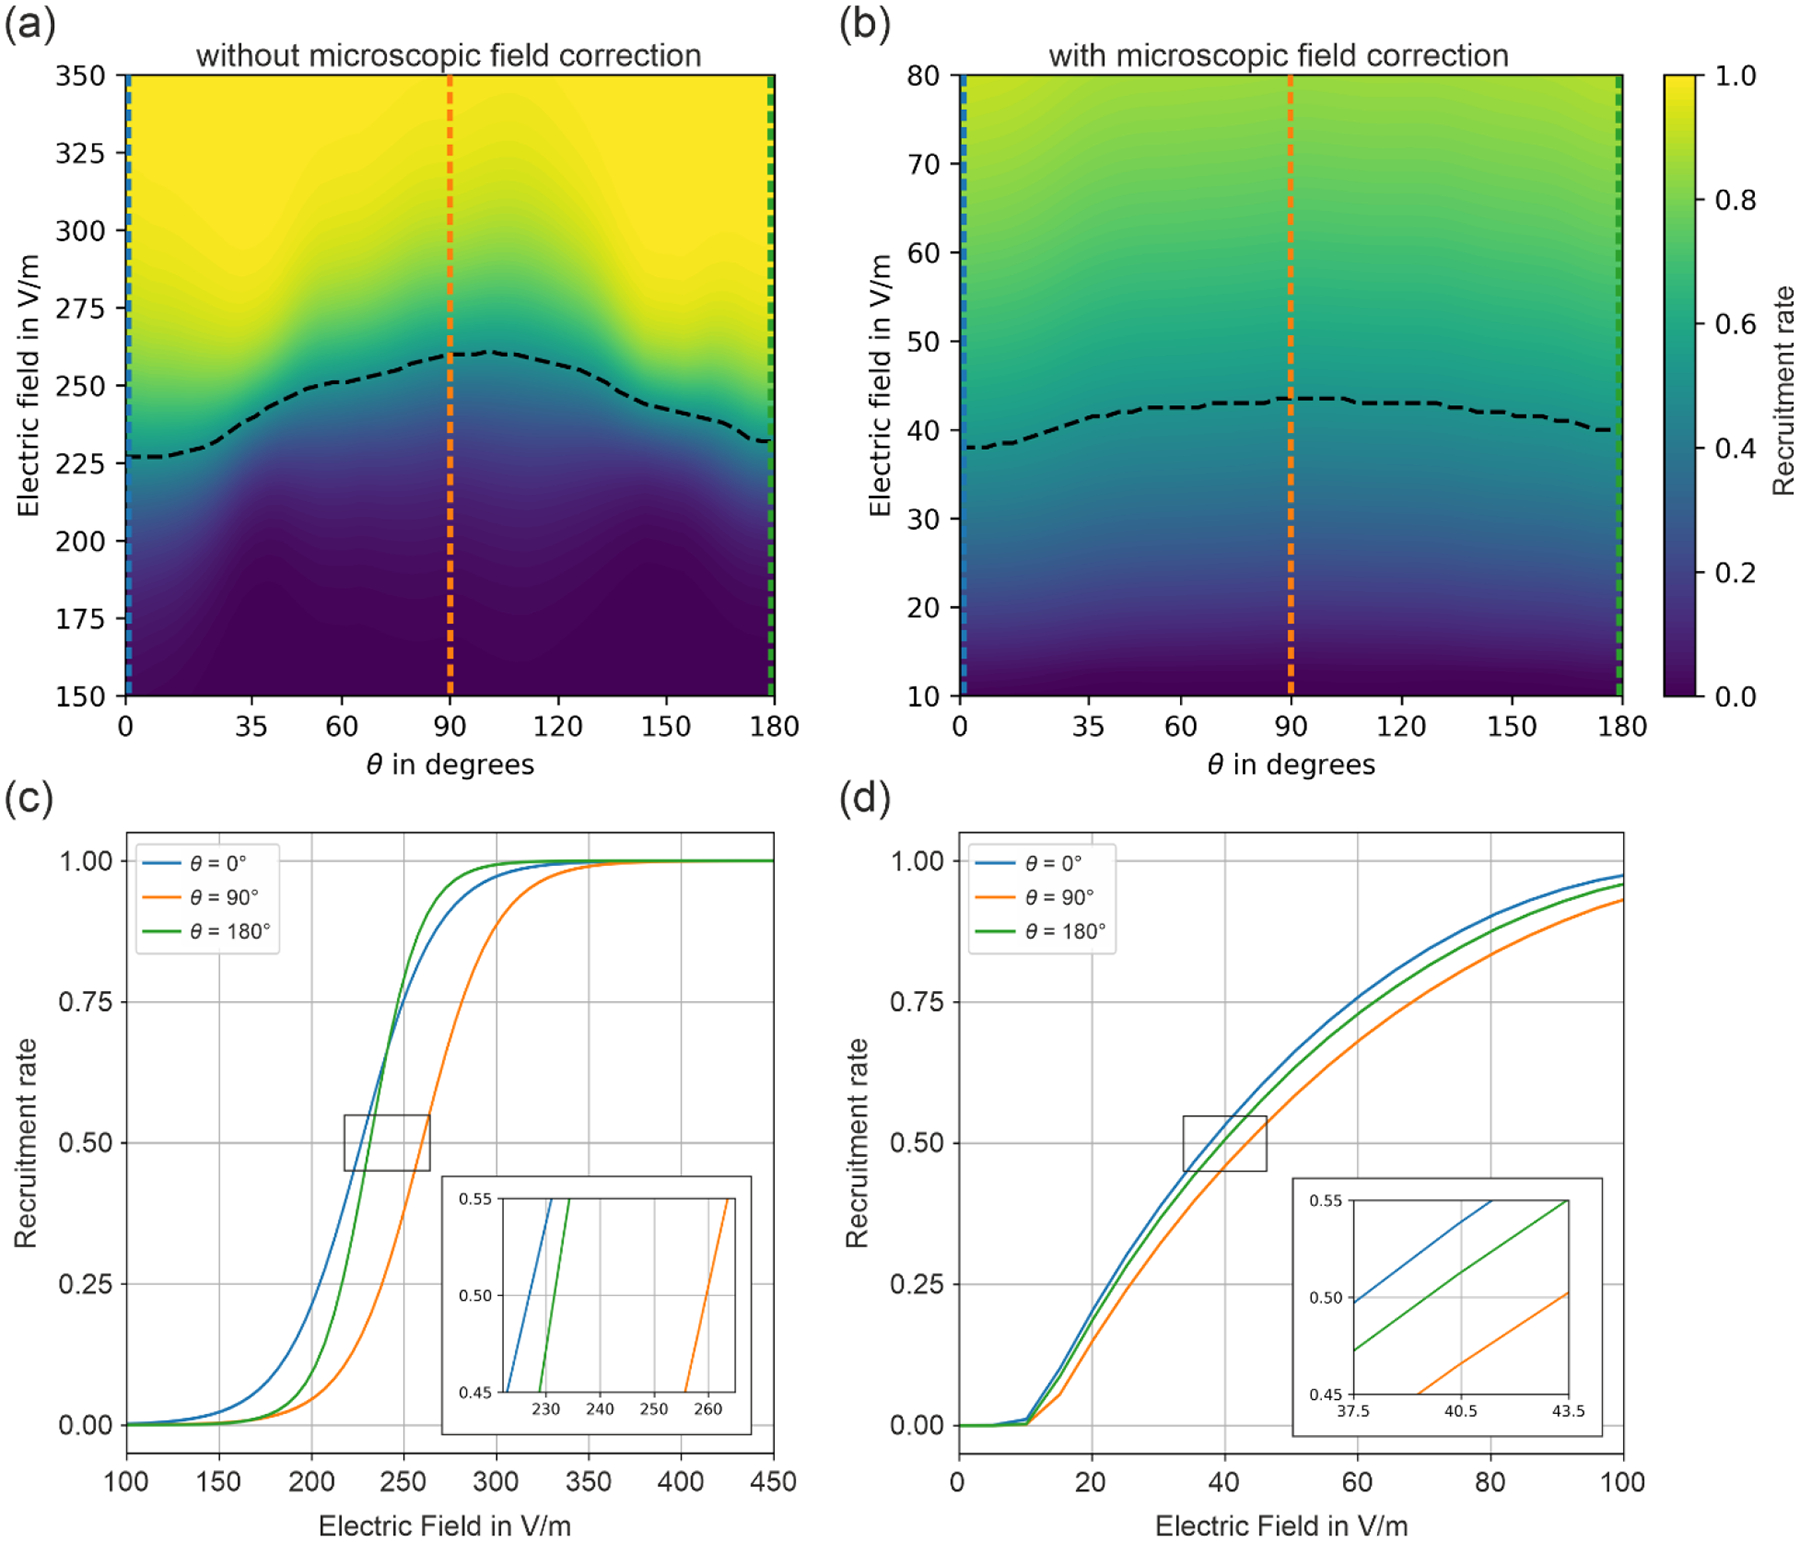
Introduction: Notwithstanding advances in computational models of neuromodulation, there are mismatches between simulated and experimental activation thresholds. Transcranial Magnetic Stimulation (TMS) of the primary motor cortex generates motor evoked potentials (MEPs). At the threshold of MEP generation, whole-head models predict macroscopic (at millimeter scale) electric fields (50-70 V/m) which are considerably below conventionally simulated cortical neuron thresholds (175-350 V/m).

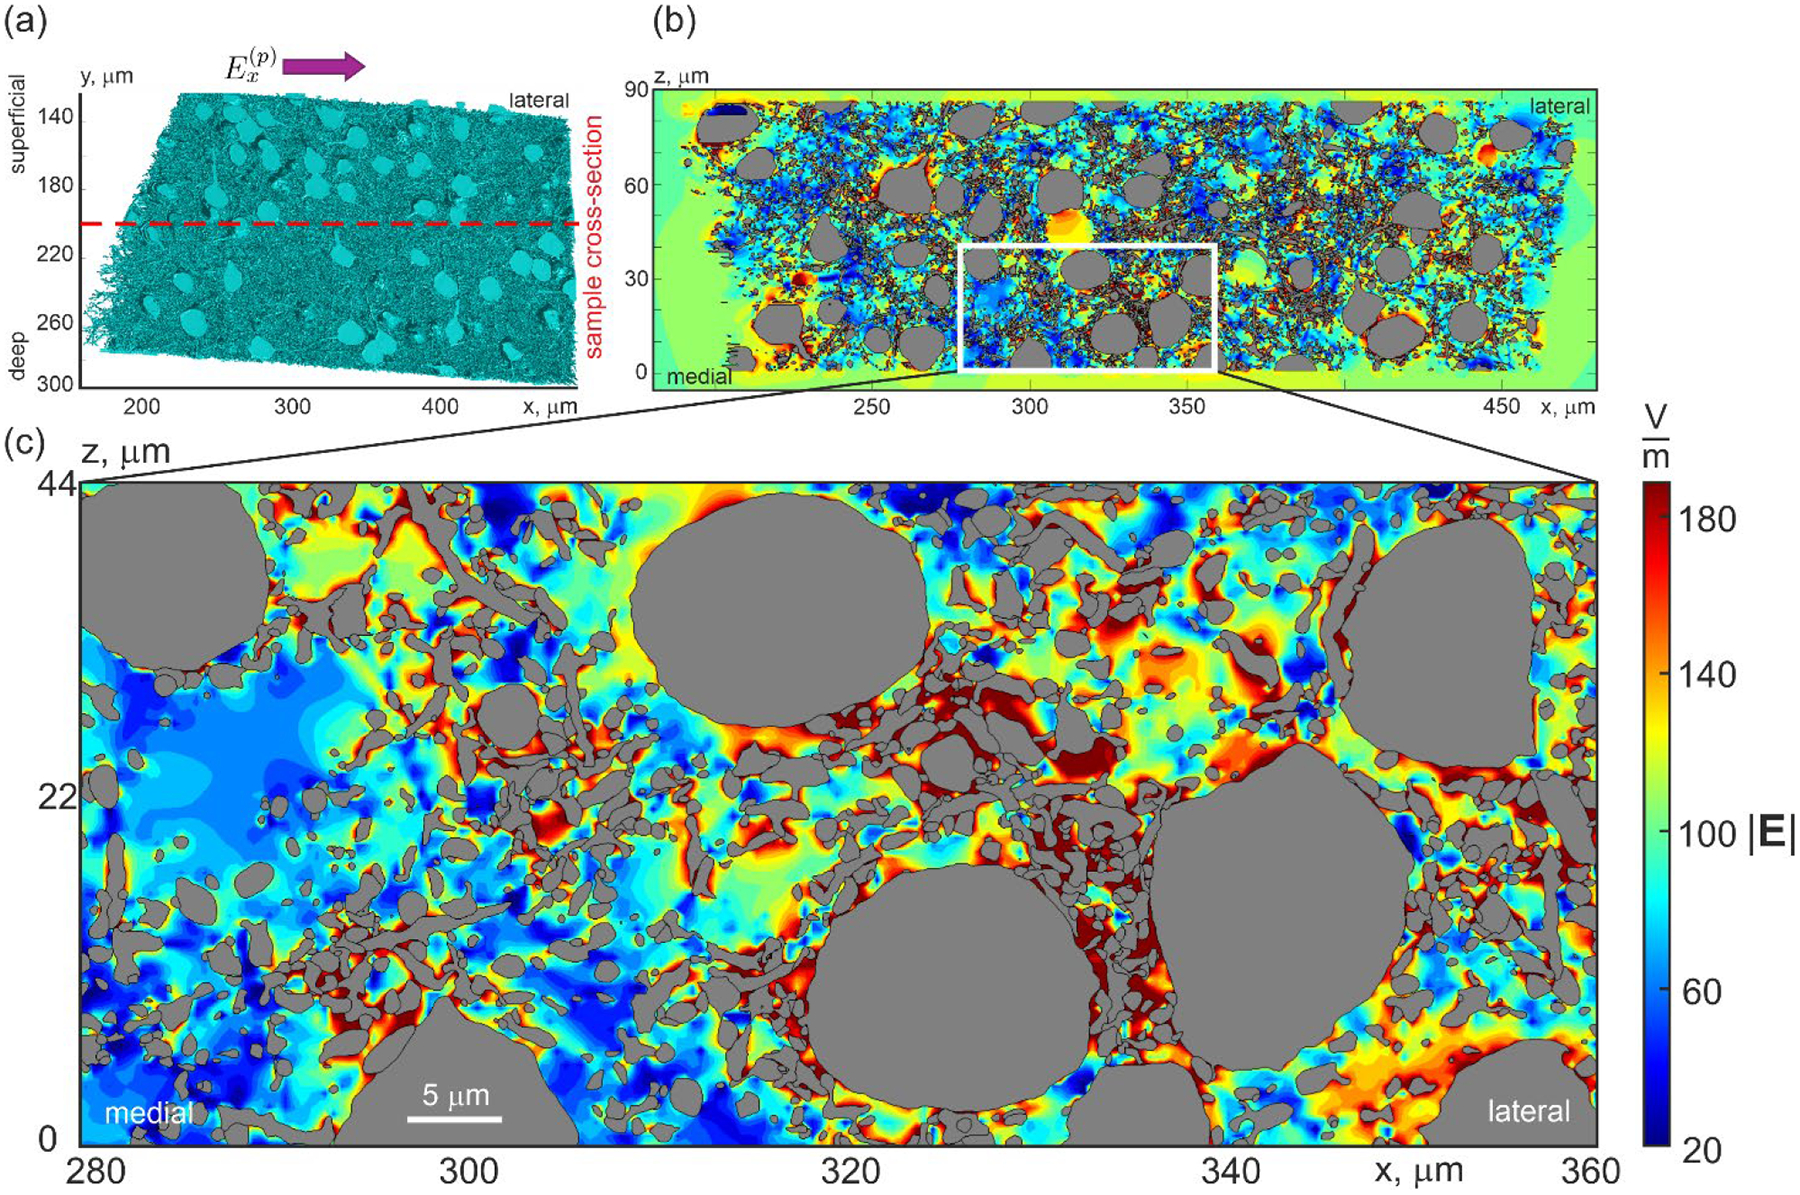
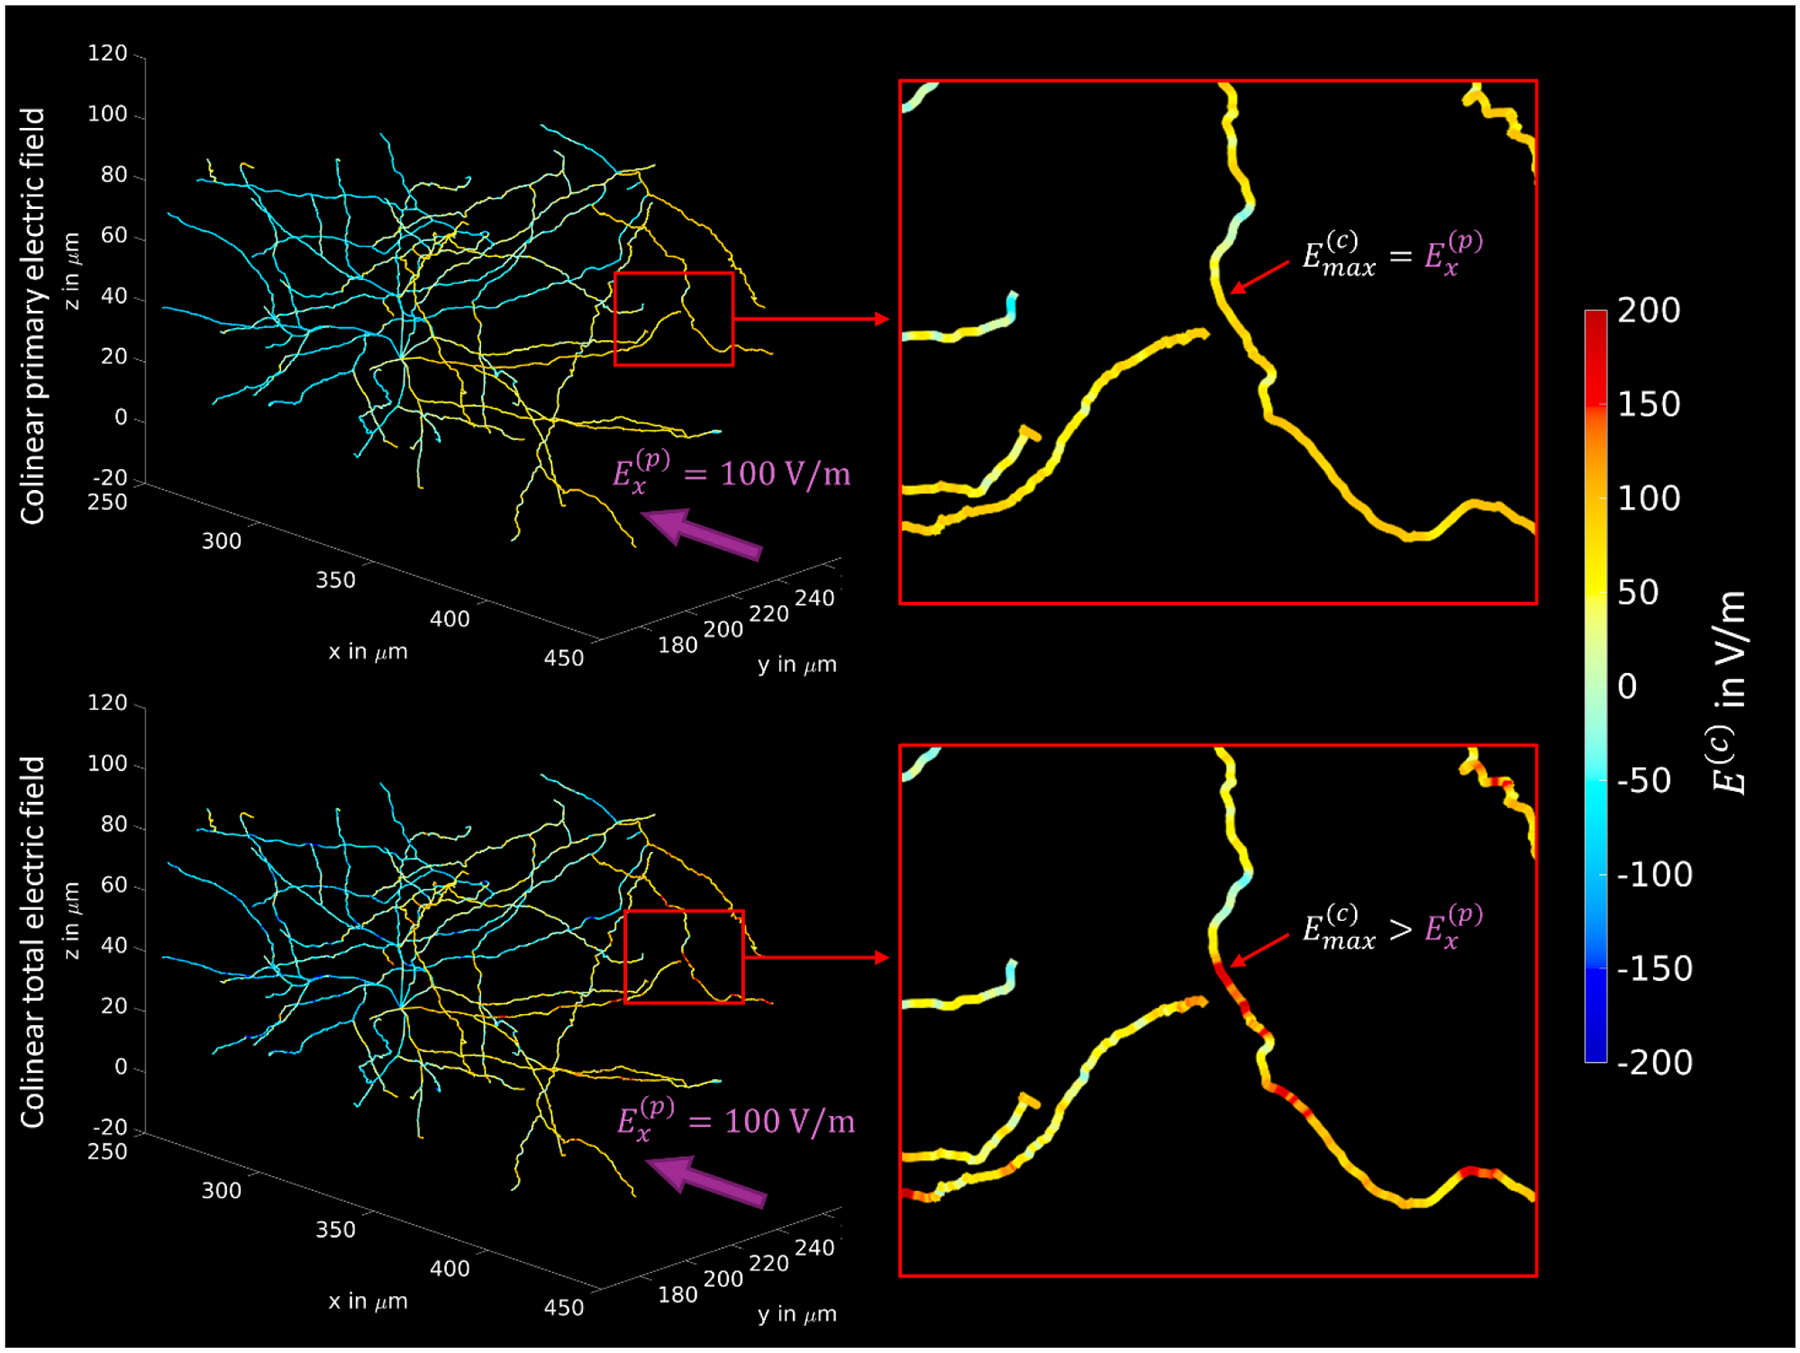
Methods: We hypothesize that this apparent contradiction is in part a consequence of electrical field warping by brain microstructure. Classical neuronal models ignore the physical presence of neighboring neurons and microstructure and assume that the macroscopic field directly acts on the neurons. In previous work, we performed advanced numerical calculations considering realistic microscopic compartments (e.g., cells, blood vessels), resulting in locally inhomogeneous (micrometer scale) electric field and altered neuronal activation thresholds. Here we combine detailed neural threshold simulations under homogeneous field assumptions with microscopic field calculations, leveraging a novel statistical approach.

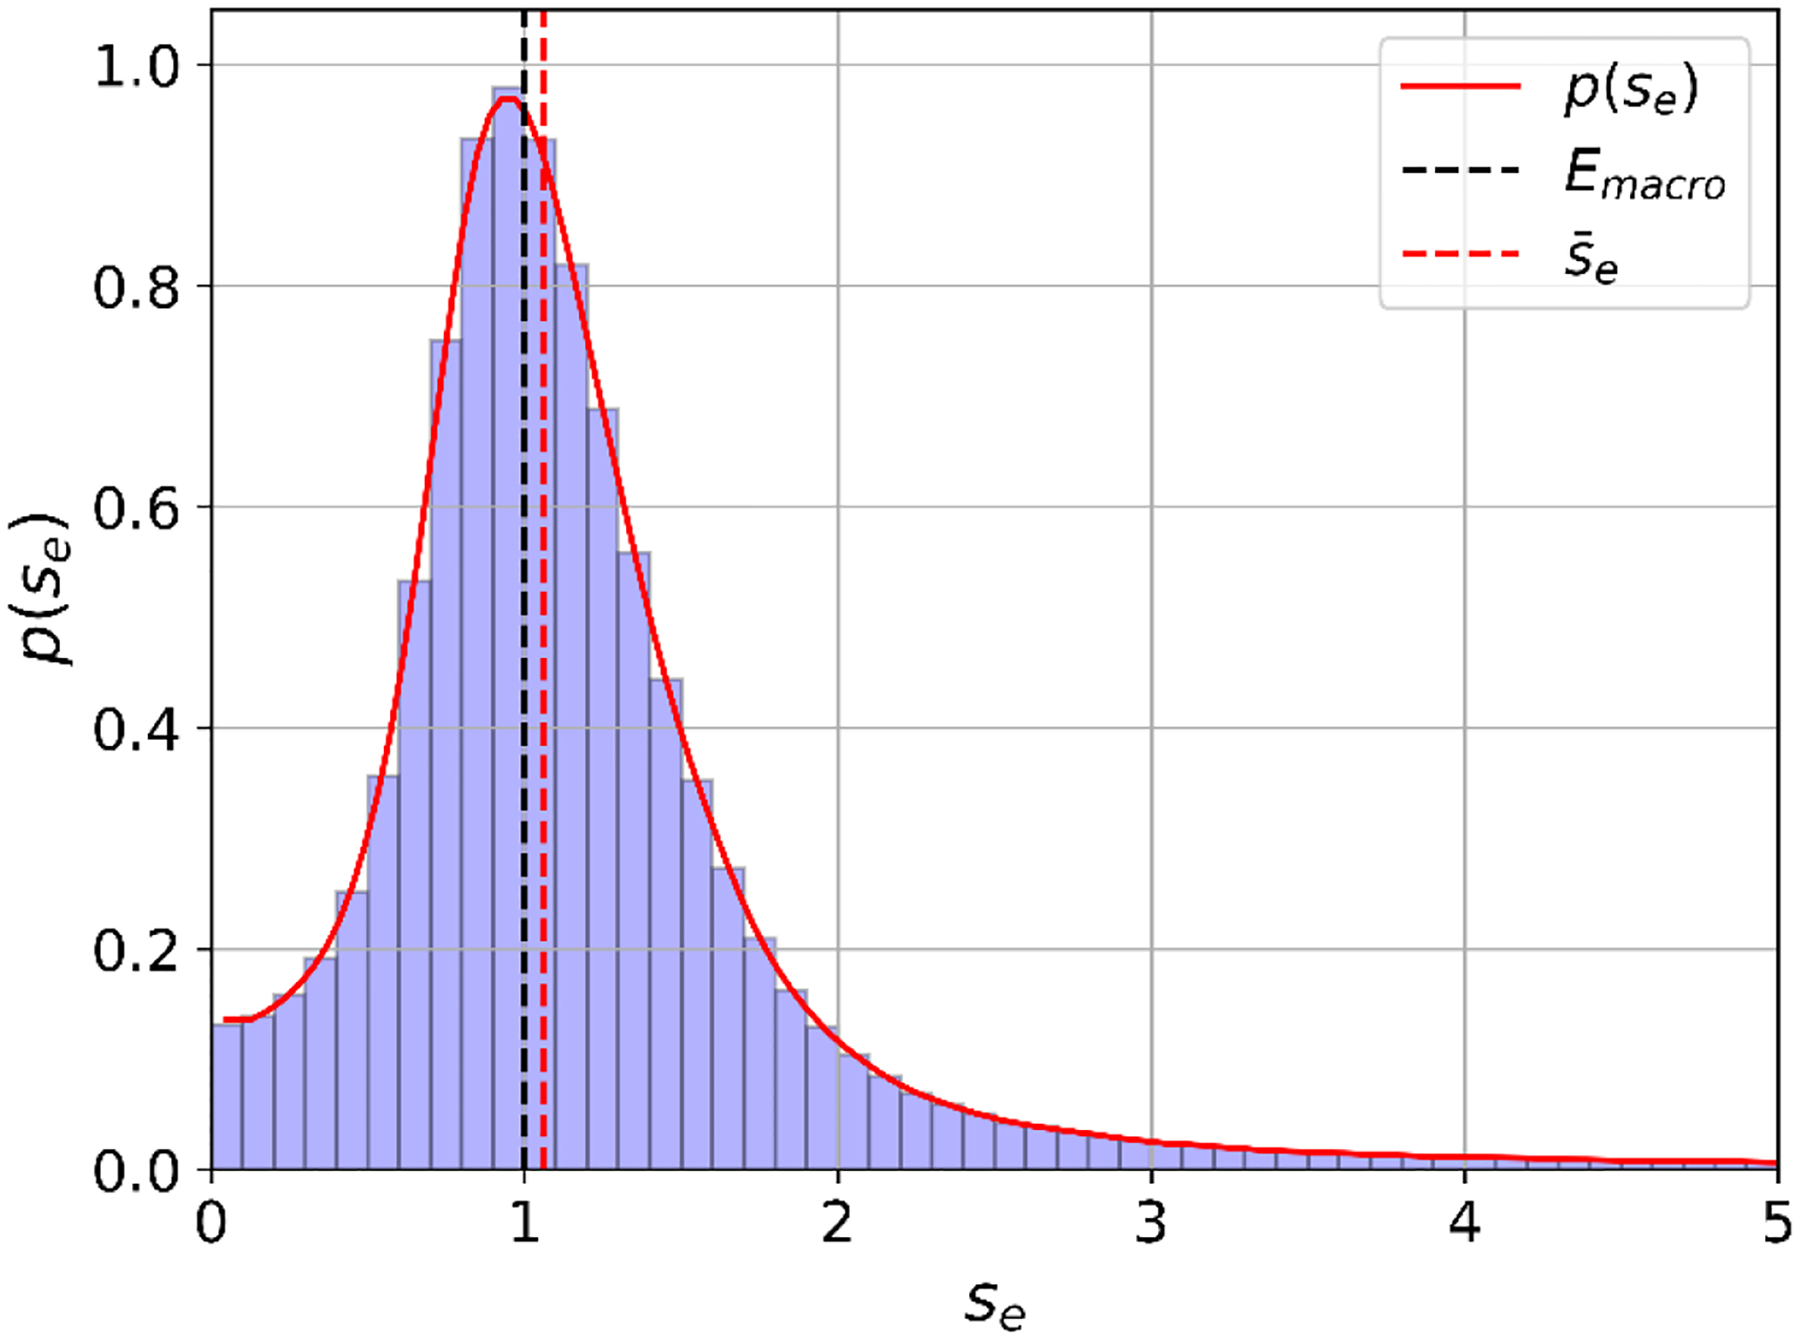
Results: We show that, provided brain-region specific microstructure metrics, a single statistically derived scaling factor between microscopic and macroscopic electric fields can be applied in predicting neuronal thresholds. For the cortical sample considered, the statistical method matches TMS experimental thresholds.

Conclusions: Our approach can be broadly applied to neuromodulation models, where fully coupled microstructure scale simulations may not be computationally tractable.

Keywords: Biophysical modeling; Brain stimulation; Multiscale brain modeling; TMS.


Conflict of interest statement

Declaration of competing interest The authors declare that they have no known competing financial interests or personal relationships that could have appeared to influence the work reported in this paper.

Figures

Fig. 1:
Fig. 1:
Distribution of the extracellular electric field magnitude (V/m) inside the sample when a uniform impressed electric field of Ex(p)=100V/m is applied in the medial-lateral direction (from left to right in the (a)), showing how low conducting barriers (e.g., cell membranes) cause charge accumulation and associated field distortion in (b) and (c). The intracellular space (grey) is not included in the computations. Tissue segmentation and electric field computations are from Qi et al. (2025).
Fig. 2.
Fig. 2.
The influence of the accumulation of charges on the membranes onto the collinear electric field at the centerlines of neuronal processes for an example neuron. Top: A uniform impressed electric field is applied along the x-axis (from dorsal to ventral) with Ex(p)=100V/m. The influence of the charges is not considered and the impressed field is directly projected to the centerlines. Hence, the maximum achievable collinear field (for an optimally oriented neuronal segment) at the neurons Emax(c) is equal to the impressed field. Bottom: The same uniform impressed field is applied, but realistic neuronal (sub-)compartments are included into the voltage simulation and the impressed field is distorted by the field of the induced charges. In consequence, the maximum achievable collinear field Emax(c) can be larger than the impressed field Ex(p).
Fig. 3:
Fig. 3:
Histogram and probability density pse of the electric field scaling factor se=EmicroEmacro between microscopic and macroscopic electric fields (black dashed line). The median of the scaling factor is s-e=1.06 (red dashed line).
Fig. 4:
Fig. 4:
Uncorrected and corrected recruitment rates in comparison to experimental MEPs. Dashed black line: original recruitment rates from Weise et al. (2023b) of L2/3 PC for θ=0° and ΔE~=0%/mm considering homogeneous macroscopic electric fields and a biphasic TMS pulse, without taking into account microscopic electric field effects. Red line: corrected recruitment rates determined from eqs. (1) and (2) using the probability density pse of the electric field scaling factor between microscopic and macroscopic electric fields from Fig. 2, together with the recruitment rate determined using macroscopic electric fields from Weise et al. (2023b) assuming an average number of axon terminals of N=35. Grey lines: Recruitment rate curves after sampling the number of axon terminals N from a normal distribution with the given mean of N=35 and standard deviation of 13.7. Colored dots: MEPs as function of the external macroscopic electric field determined experimentally in Numssen et al. (2021) after motor mapping (different colors represent different subjects).
Fig. 5:
Fig. 5:
Recruitment rates of L2/3 PC without (a) and with (b) microscopic field corrections stimulated by biphasic TMS pulses for different electric field angles. No e-field gradient (ΔE~=0%/mm) was assumed. (a) The neuronal recruitment rate from Weise et al. (2023b) did not consider microscopic electric field variations, yielding e-field thresholds of above 200 V/m. (b) Recruitment rate of a neuronal population taking electric field variations from Fig. 3 into account yields thresholds of below 50 V/m. (c) and (d) Recruitment rates for field angles of θ=0°,θ=90°, and θ=180° without and with microscopic field correction, respectively.

Update of

Similar articles

Cited by

References

    1. Aberra AS, Wang B, Grill WM, & Peterchev AV (2020). Simulation of transcranial magnetic stimulation in head model with morphologically-realistic cortical neurons. Brain stimulation, 13(1), 175–189. - PMC - PubMed
    1. Balanis Constantine A., Advanced Engineering Electromagnetics, Dec, 8, 2023, Print ISBN:9781394180011 |Online ISBN:9781394180042 |DOI:10.1002/9781394180042. - DOI
    1. Caulfield KA, Li X, & George MS (2021). Four electric field modeling methods of dosing prefrontal transcranial magnetic stimulation (TMS): Introducing APEX MT dosimetry. Brain Stimul, 14(4), 1032–1034. 10.1016/j.brs.2021.06.012 - DOI - PMC - PubMed
    1. Czerwonky DM, Aberra AS, Gomez LJ. (2023-December-16), “A Boundary Element Method of Bidomain Modeling for Predicting Cellular Responses to Electromagnetic Fields”, BioRxiv: The Preprint Server for Biology, doi:10.1101/2023.12.15.571917. - DOI - PubMed
    1. Di Lazzaro V, & Ziemann U (2013). The contribution of transcranial magnetic stimulation in the functional evaluation of microcircuits in human motor cortex. Frontiers in neural circuits, 7, 18. - PMC - PubMed

LinkOut - more resources