. 2025 Feb 12;13(2):e009568.
doi: 10.1136/jitc-2024-009568.

Radiomic analysis of patient and interorgan heterogeneity in response to immunotherapies and BRAF-targeted therapy in metastatic melanoma

Affiliations

Radiomic analysis of patient and interorgan heterogeneity in response to immunotherapies and BRAF-targeted therapy in metastatic melanoma

Alexandra G Tompkins et al. J Immunother Cancer. .

Abstract

Variability in treatment response may be attributable to organ-level heterogeneity in tumor lesions. Radiomic analysis of medical images can elucidate non-invasive biomarkers of clinical outcome. Organ-specific radiomic comparison across immunotherapies and targeted therapies has not been previously reported. We queried the UPMC Hillman Cancer Center registry for patients with metastatic melanoma (MEL) treated with immune checkpoint inhibitors (ICI) (anti-programmed cell death protein-1 (PD-1)/cytotoxic T-lymphocyte associated protein 4 (CTLA-4) (ipilimumab+nivolumab; I+N) or anti-PD-1 monotherapy) or BRAF-targeted therapy. The best overall response was measured using Response Evaluation Criteria in Solid Tumors V.1.1. Lesions were segmented into discrete volume-of-interest with 400 radiomics features extracted. Overall and organ-specific machine-learning models were constructed to predict disease control (DC) versus progressive disease (PD) using XGBoost. 291 patients with MEL were identified, including 242 ICI (91 I+N, 151 PD-1) and 49 BRAF. 667 metastases were analyzed, including 541 ICI (236 I+N, 305 PD-1) and 126 BRAF. Across cohorts, baseline demographics included 39-47% women, 24%-29% M1C, 24-46% M1D, and 61-80% with elevated lactate dehydrogenase. Among ICI patients experiencing DC, the organs with the greatest reduction were liver (-66%±8%; mean±SEM) and lung (-63%±5%). For patients with multiple same-organ target lesions, the highest interlesion heterogeneity was observed in brain among patients who received ICI while no intraorgan heterogeneity was observed in BRAF. 221 ICI patients were included for radiomic modeling, consisting of 86 I+N and 135 PD-1. Models consisting of optimized radiomic signatures classified DC/PD across I+N (area under curve (AUC)=0.85) and PD-1 (0.71) and within individual organ sites (AUC=0.72~0.94). Integration of clinical variables improved the models' performance. Comparison of models between treatments and across organ sites suggested mostly non-overlapping DC or PD features. Skewness, kurtosis, and informational measure of correlation (IMC) were among the radiomic features shared between overall response models. Kurtosis and IMC were also used by multiple organ-site models. In conclusion, differential organ-specific response was observed across BRAF and ICI with within organ heterogeneity observed for ICI but not for BRAF. Radiomic features of organ-specific response demonstrated little overlap. Integrating clinical factors with radiomics improves the prediction of disease course outcome and prediction of tumor heterogeneity.

Keywords: Immune Checkpoint Inhibitor; Immunotherapy; Skin Cancer.


Conflict of interest statement

Competing interests: RB declares PCT/US15/612657 (Cancer Immunotherapy), PCT/US18/36052 (Microbiome Biomarkers for Anti-PD-1/PD-L1 Responsiveness: Diagnostic, Prognostic and Therapeutic Uses Thereof), PCT/US63/055227 (Methods and Compositions for Treating Autoimmune and Allergic Disorders); JJL declares DSMB: AbbVie, Immutep; Scientific Advisory Board: (no stock) 7 Hills, Fstar, Inzen, RefleXion, Xilio (stock) Actym, Alphamab Oncology, Arch Oncology, Kanaph, Mavu, Onc.AI, Pyxis, Tempest; Consultancy with compensation: AbbVie, Alnylam, Avillion, Bayer, Bristol-Myers Squibb, Checkmate, Codiak, Crown, Day One, Eisai, EMD Serono, Flame, Genentech, Gilead, HotSpot, Kadmon, KSQ, Janssen, Ikena, Immunocore, Incyte, Macrogenics, Merck, Mersana, Nektar, Novartis, Pfizer, Regeneron, Ribon, Rubius, Silicon, Synlogic, Synthekine, TRex, Werewolf, Xencor; Research Support: (all to institution for clinical trials unless noted) AbbVie, Agios (IIT), Astellas, AstraZeneca, Bristol-Myers Squibb (IIT & industry), Corvus, Day One, EMD Serono, Fstar, Genmab, Ikena, Immatics, Incyte, Kadmon, KAHR, Macrogenics, Merck, Moderna, Nektar, Next Cure, Numab, Pfizer (IIT & industry) Replimmune, Rubius, Scholar Rock, Synlogic, Takeda, Trishula, Tizona, Xencor; Patents: (both provisional) Serial #15/612,657 (Cancer Immunotherapy), PCT/US18/36052 (Microbiome Biomarkers for Anti-PD-1/PD-L1 Responsiveness: Diagnostic, Prognostic and Therapeutic Uses Thereof). P.C.L. declares equity interest in Amgen. D.D. declares grants/research support (NIH/NCI and Checkmate Pharmaceuticals) and consulting (Checkmate Pharmaceuticals) during the conduct of the study. D.D. also reports grants/research support (Arcus, CellSight Technologies, Immunocore, Merck Sharp & Dohme, Tesaro/GSK), consulting [Clinical Care Options (CCO), Finch Therapeutics, Gerson Lehrman Group (GLG), Medical Learning Group (MLG), Xilio Therapeutics], speakers' bureau (Castle Biosciences) and pending provisional patents related to gut microbial signatures of response and toxicity to immune checkpoint blockade (US Patent 63/124,231 and US Patent 63/208,719) outside the submitted work. J.M.K. declares grants/research support (Bristol-Myers Squibb, Amgen Inc.) and consulting (Bristol-Myers Squibb, Checkmate Pharmaceuticals, Novartis, Amgen Inc., Checkmate, Castle Biosciences, Inc., Immunocore LLC, Iovance, Novartis.) outside the submitted work. H.M.Z. declares grants/research support (NIH/NCI and Checkmate Pharmaceuticals) and consulting (Checkmate Pharmaceuticals) during the conduct of the study, grants/research support (NIH/NCI, Bristol-Myers Squibb and GlaxoSmithKline), personal fees (GlaxoSmithKline and Vedanta) and pending provisional patents related to gut microbial signatures of response and toxicity to immune checkpoint blockade (US Patent 63/124,231 and US Patent 63/208,719) outside the submitted work. Y.G.N. declares consulting/advisory board (Immunocore, replimune, BMS, Pfizer, Novartis, Merck, Mallinkrodt, Intervenn bio), research to institution (BMS, Pfizer, Merck, replimune), and speaker (Immunocore, Pfizer). Correspondence and requests for materials should be addressed to R.B. (baor@upmc.edu) and J.J.L. (lukejj@upmc.edu). The remaining authors declare no competing interests.

Figures
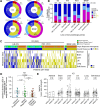
Figure 1
Figure 1. Overall and organ-specific response in ICI (I+N, PD-1) and BRAF cohorts. (A) Overall response to therapy by treatment. For each cohort, the outer circle shows the percentage of patients who experienced CR, PR, SD, or PD. The inner circle shows DC% (including CR, PR, and SD) and PD%. (B) Patients stratified by previous exposure to immunotherapy. Color represents CR, PR, SD, and PD same as in (A). The number above each bar shows the percentage of patients who experienced DC in each subset. (C) Heatmap showing the organ-specific response (adrenal, brain, liver, LN, lung, soft tissue, on the row) and in the context of overall response per patient (on the column). n=291 patients are shown in (A), (B), and (C), with 91 from I+N, 151 from PD-1, and 49 from BRAF. (D) Comparison of interorgan heterogeneity in patients with mixed response versus those with uniform progression versus those with uniform disease control. The y-axis represents the SD of weighted RECIST scores across all metastases in a patient. Each data point represents one patient. n=111 ICI patients who had at least two metastasis sites are shown. (E) Intraorgan heterogeneity by organ site comparing lesions 01 and 02. The y-axis represents the individual lesion’s tumor size change in percentage. Each data point represents one lesion. Lines connect lesion 01/02 from the same metastasis site in the same patient. n=168 sites from ICI patients who had two lesions per site are shown. Wilcoxon rank-sum test was used in (D), Wilcoxon signed-rank test was used in (E). FDR-adjusted p values are shown in (D) and (E). FDR was controlled at 0.10. All tests are two-sided. Denotations: **p<0.01, *p<0.05, + p<0.10. CR, complete response; DC, disease control; FDR, false discovery rate; ICI, immune-checkpoint inhibitors; I+N, ipilimumab+nivolumab; Imtx, immunotherapy; LN, lymph node; PD, progressive disease; PD-1, programmed cell death protein-1; PR, partial response; SD, stable disease.
Figure 2
Figure 2. Radiomic features differentiate overall response or organ-specific response DC versus PD. (A) 39 features that distinguish overall response in patients who received I+N at FDR-adjusted p<0.10. Patients are clustered on the column and features are clustered on the row with dendrograms shown. The horizontal annotation bar on top of the heatmap indicates the overall response PD and DC. Feature names (eg, IMC_1_variance) are shown on the right side of the heatmap, which correspond to the feature IDs (eg, SOF194, SOF038). n=82 patients from I+N cohort are shown. (B) Overlapping or unique features across patient cohorts. The DC versus PD differences of the 39 features from (A) (I+N) are shown in patients who received PD-1 monotherapy or BRAF-targeted therapy. Features are shown in the same order as on the heatmap from (A). (C) 14 features that distinguish organ-specific response in one or more cohorts (left to right) each organ site is shown in I+N or PD-1: lung, LN, liver, and soft tissue. For (A) and (C), full feature IDs and names are described in online supplemental tables S2 and S3. Wilcoxon rank-sum test was used in (A), (B), and (C). All tests are two-sided. DC, disease control; FDR, false discovery rate; I+N, ipilimumab+nivolumab; IMC, informational measure of correlation; LN, lymph node; PD, progressive disease; PD-1, programmed cell death protein-1; FOF, first-order feature; SOF, second-order feature; SOVF, volume-adjusted second-order feature.
Figure 3
Figure 3. Radiomics models predict overall response DC/PD in ICI cohorts. For each cohort, models were optimized in the training set with 10-fold CV, and the final performance was reported on unseen data in the test set. We show both the training set 10-fold CV ROC curve as well as the test set ROC curve. AUC, sensitivity (Sens), specificity (Spec), precision (Prec), and F-score (F1) were reported. (A) Model of radiomic features only in I+N cohort. (B) Model of radiomic features only in the PD-1 cohort. (C) Model of radiomic features and clinical variables in I+N cohort. (D) Model of radiomic features and clinical variables in PD-1 cohort. For I+N models in (A) and (C): n=67 and 15 patients in training/test set (80%/20% split), respectively (total is 82). 400 radiomic features were reduced to 17 prior to model training. For PD-1 models in (B) and (D): n=104 and 25 patients in training/test set (80%/20% split), respectively (total is 129). 400 radiomic features were reduced to 23 prior to model training. (E) Variable importance (VarImp) of the features from I+N model in (C). (F) Variable importance (VarImp) of the features from the PD-1 model in D). Features with VarImp>1 are shown in (E) and (F); red vertical dashed line indicates VarImp=20; features with VarImp≥20 are generally considered important in predicting outcome. Color indicates whether a feature is greater in overall response PD (blue) or DC (gold). Clinical variables are bolded. The AUC p value shown at the top left corner of each ROC panel in (A-D) was computed using function roc.area from R package verification (V.1.42), which implements a two-sided Wilcoxon rank-sum test. ASM, angular s moment; AUC, area under the curve; BMI, body mass index; CV, cross-validation; DC, disease control; FPR, false positive rate; ICI, immune-checkpoint inhibitors; I+N, ipilimumab+nivolumab; IMC, informational measure of correlation; NLR, neutrophil-to-lymphocyte ratio; PD, progressive disease; PD-1, programmed cell death protein-1; ROC, receiver operating characteristic; TPR, true positive rate.
Figure 4
Figure 4. Radiomics models predict organ-specific response DC/PD in immune-checkpoint inhibitors cohorts. For each cohort, leave-one-out cross-validation was applied to all samples to generate the ROC curve. AUC, sensitivity (Sens), and specificity (Spec) were reported. 400 radiomic features were reduced to 10 prior to model construction. (A) Model of radiomic features in I+N cohort (left to right): lung (34), LN (37), liver (21), soft tissue (32), and brain (20). Numbers in paratheses indicate the number of metastases for model construction per organ. (B) Model of radiomic features in PD-1 cohort (left to right): lung (54), LN (52), liver (22), soft tissue (50). Brain models of the PD-1 cohort were not constructed considering the small sample size. (C) Heatmap summarizing radiomic features used by overall response or organ-specific response models to predict DC/PD. Models are shown on the row, and features are shown on the column. Same radiomic features at different gray levels were collapsed as one entry for visualization purposes. Features of variable importance (VarImp)≥20 from each model were included in these comparisons. Asterisks highlight top shared features high in DC (IMC_2_Avg, kurtosis) or high in PD (skewness). Blue arrow indicates features shared by I+N organ models (correlation_Avg). The AUC p value shown at the top left corner of each ROC panel in (A) and (B) was computed using function roc.area from R package verification (V.1.42), which implements a two-sided Wilcoxon rank-sum test. ASM, angular s moment; AUC, area under curve; CV, cross-validation; DBV, divided by volume (indicating this is a volume-independent second-order feature); DC, disease control; FPR, false positive rate; IMC, informational measure of correlation; I+N, ipilimumab+nivolumab; LN, lymph node; PD, progressive disease; PD-1, programmed cell death protein-1; ROC, receiver operating characteristic; TPR, true positive rate.

Update of

References

    1. Luke JJ, Flaherty KT, Ribas A, et al. Targeted agents and immunotherapies: optimizing outcomes in melanoma. Nat Rev Clin Oncol. 2017;14:463–82. doi: 10.1038/nrclinonc.2017.43. - DOI - PubMed
    1. Wolchok JD, Chiarion-Sileni V, Gonzalez R, et al. Long-Term Outcomes With Nivolumab Plus Ipilimumab or Nivolumab Alone Versus Ipilimumab in Patients With Advanced Melanoma. J Clin Oncol. 2022;40:127–37. doi: 10.1200/JCO.21.02229. - DOI - PMC - PubMed
    1. Pires da Silva I, Lo S, Quek C, et al. Site-specific response patterns, pseudoprogression, and acquired resistance in patients with melanoma treated with ipilimumab combined with anti-PD-1 therapy. Cancer. 2020;126:86–97. doi: 10.1002/cncr.32522. - DOI - PubMed
    1. Lee JHJ, Lyle M, Menzies AM, et al. Metastasis-specific patterns of response and progression with anti-PD-1 treatment in metastatic melanoma. Pigment Cell Melanoma Res. 2018;31:404–10. doi: 10.1111/pcmr.12675. - DOI - PubMed
    1. Khoja L, Kibiro M, Metser U, et al. Patterns of response to anti-PD-1 treatment: an exploratory comparison of four radiological response criteria and associations with overall survival in metastatic melanoma patients. Br J Cancer. 2016;115:1186–92. doi: 10.1038/bjc.2016.308. - DOI - PMC - PubMed

Substances